| Param | Original file | Final file |
|---|---|---|
| Filename | modeM0/AS1C03_015T03_9000002366cztM0_level2.fits | modeM0/AS1C03_015T03_9000002366cztM0_level2_quad_clean.evt |
| Size (bytes) | 134,484,480 | 183,634,560 |
| Size | 128.3 MB | 175.1 MB |
| Events in quadrant A | 800,658 | 1,169,785 |
| Events in quadrant B | 774,644 | 1,182,281 |
| Events in quadrant C | 789,682 | 1,141,987 |
| Events in quadrant D | 695,738 | 1,055,130 |
| Mode M9 | |||
|---|---|---|---|
| Quadrant | BADHDUFLAG | Total packets | Discarded packets |
| A | 0 | 5 | 0 |
| B | 0 | 5 | 0 |
| C | 0 | 5 | 0 |
| D | 0 | 5 | 0 |
| Mode SS | |||
|---|---|---|---|
| Quadrant | BADHDUFLAG | Total packets | Discarded packets |
| A | 0 | 300 | 0 |
| B | 0 | 300 | 0 |
| C | 0 | 300 | 0 |
| D | 0 | 300 | 0 |
| Mode M0 | |||
|---|---|---|---|
| Quadrant | BADHDUFLAG | Total packets | Discarded packets |
| A | 0 | 30312 | 0 |
| B | 0 | 31714 | 0 |
| C | 0 | 30148 | 0 |
| D | 0 | 30790 | 0 |
| Quadrant | Total seconds | Saturated seconds | Saturation percentage |
|---|---|---|---|
| A | 14664 | 47 | 0.320513% |
| B | 14664 | 198 | 1.350245% |
| C | 14664 | 105 | 0.716039% |
| D | 14664 | 52 | 0.354610% |
Noise dominated data is calculated using 1-second bins in cleaned event files. If a bin has >2000 counts, and if more than 50% of those come from <1% of pixels, then it is considered to be noise-dominated and hence unusable.
| Quadrant | # 1 sec bins | Bins with >0 counts | Bins with >2000 counts | High rate bins dominated by noise | Noise dominated (total time) | Noise dominated (detector-on time) | Marked lightcurve |
|---|---|---|---|---|---|---|---|
| A | 15235 | 14664 | 0 | 0 | 0.00% | 0.00% |  |
| B | 15235 | 14663 | 0 | 0 | 0.00% | 0.00% |  |
| C | 15235 | 14664 | 0 | 0 | 0.00% | 0.00% | 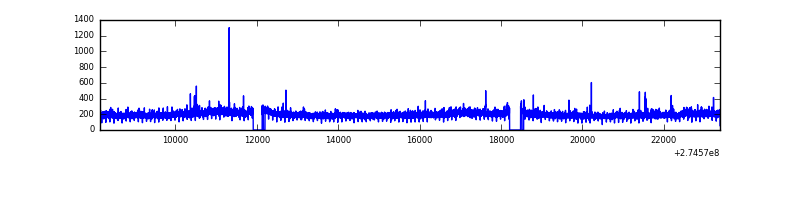 |
| D | 15235 | 14663 | 0 | 0 | 0.00% | 0.00% |  |
Top three noisy pixels from each quadrant. If the there are fewer than three noisy pixels in the level2.evt file, extra rows are filled as -1
| Pixel properties | Quadrant properties | ||||||
|---|---|---|---|---|---|---|---|
| Quadrant | DetID | PixID | Counts | Sigma | Mean | Median | Sigma |
| A | 0 | 29 | 775 | 10.81 | 208 | 196 | 53.6 |
| A | 7 | 110 | 650 | 8.48 | 208 | 196 | 53.6 |
| A | 15 | 236 | 612 | 7.77 | 208 | 196 | 53.6 |
| B | 2 | 9 | 681 | 11.23 | 204 | 195 | 43.3 |
| B | 3 | 17 | 539 | 7.95 | 204 | 195 | 43.3 |
| B | 2 | 8 | 536 | 7.88 | 204 | 195 | 43.3 |
| C | 12 | 241 | 560 | 6.63 | 208 | 195 | 55.0 |
| C | 3 | 126 | 553 | 6.5 | 208 | 195 | 55.0 |
| C | 9 | 233 | 544 | 6.34 | 208 | 195 | 55.0 |
| D | 6 | 231 | 514 | 6.09 | 198 | 180 | 54.9 |
| D | 6 | 38 | 511 | 6.03 | 198 | 180 | 54.9 |
| D | 10 | 189 | 503 | 5.89 | 198 | 180 | 54.9 |
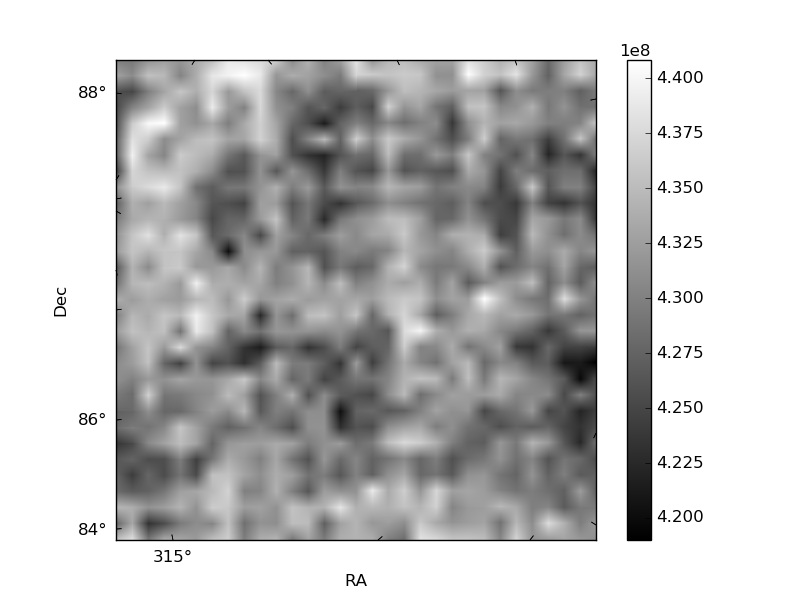
Histogram calculated using DETX and DETY for each event in the final _common_clean file
| Quadrant A | 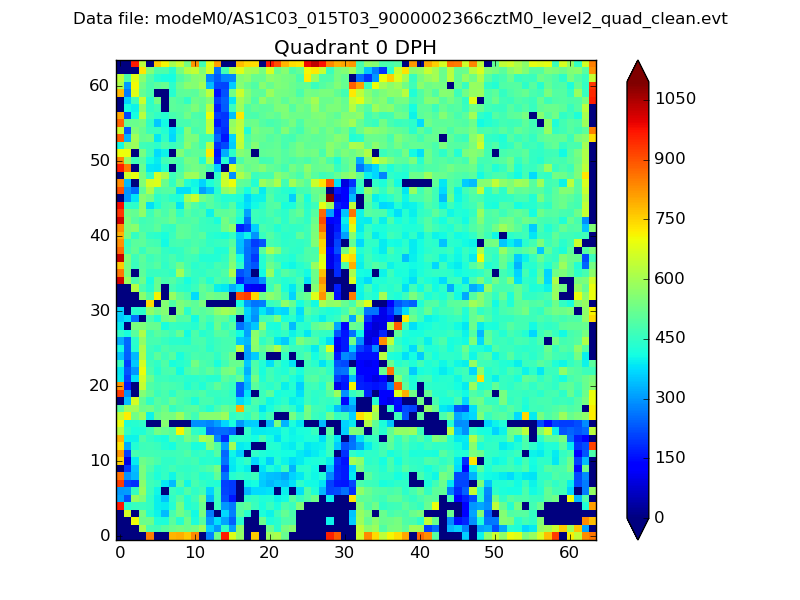 |
 |
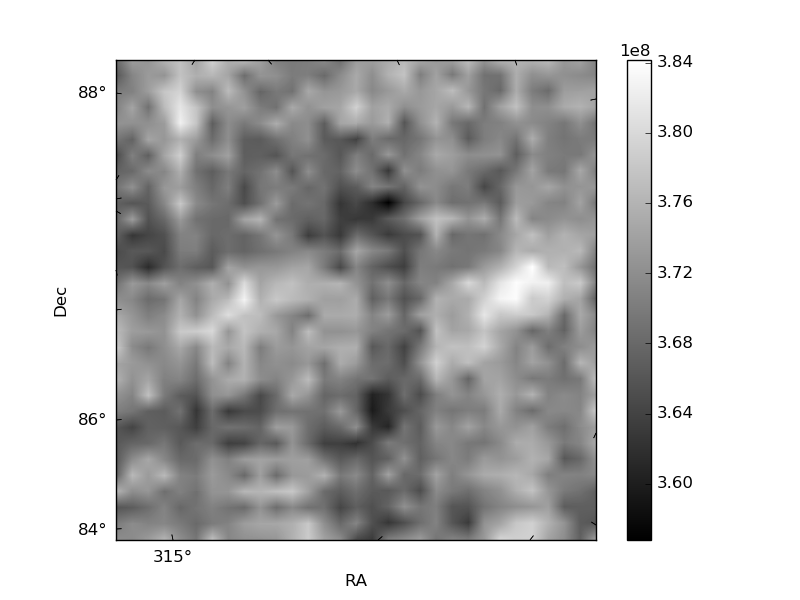
Quadrant B |
|---|---|---|---|
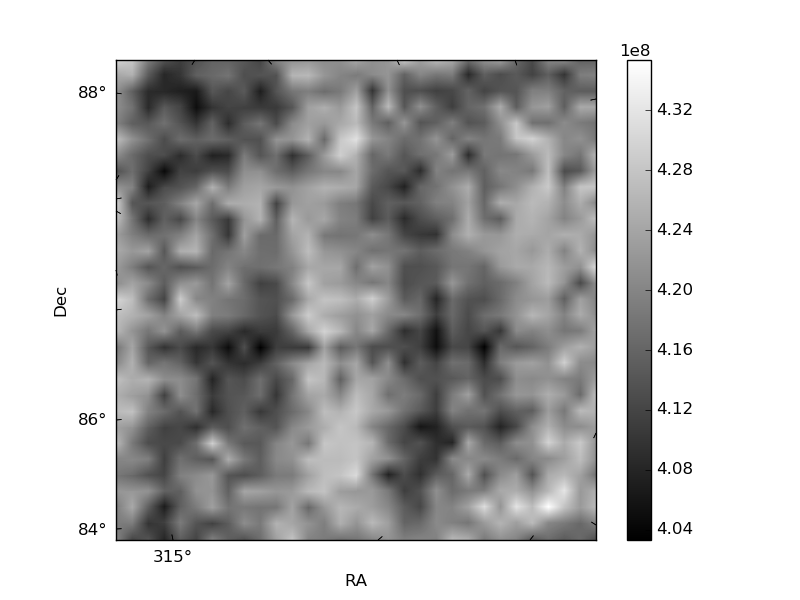
| Quadrant D | 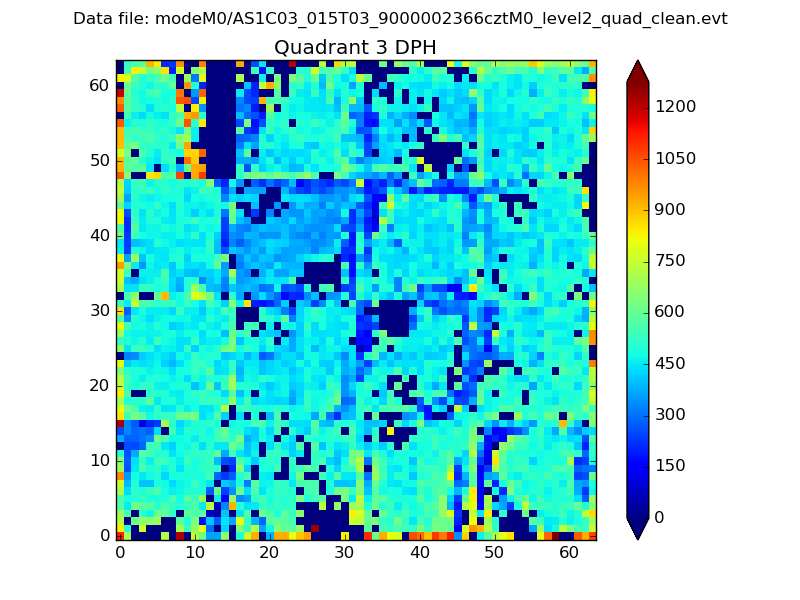 |
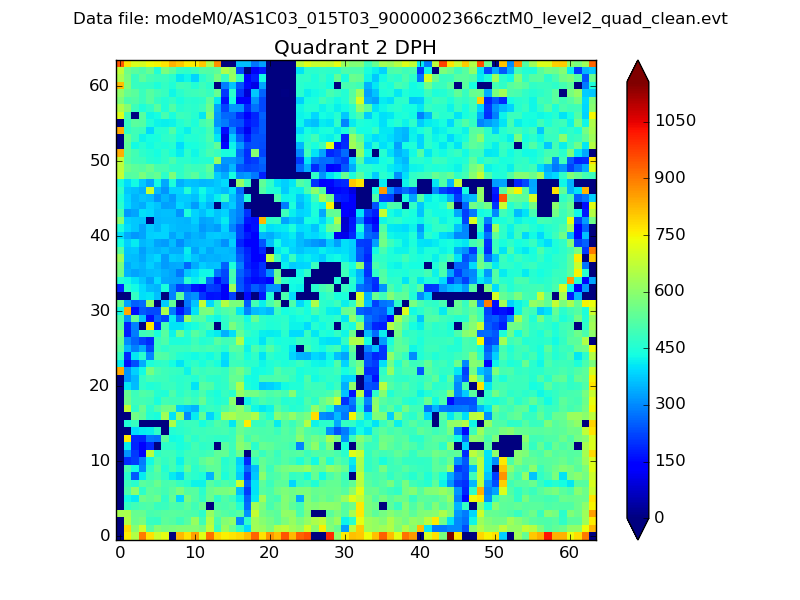 |
Quadrant C |
| Plot type | Count rate plots | Images |
|---|---|---|
| Comparison with Poisson distribution Blue bars denote a histogram of data divided into 1 sec bins. Red curve is a Poisson curve with rate = median count rate of data. |
 |
 |
| Quadrant-wise count rates Data is divided into 100 sec bins |
 |
|
| Module-wise count rates for Quadrant A Data is divided into 100 sec bins |
 |
 |
| Module-wise count rates for Quadrant B Data is divided into 100 sec bins |
 |
 |
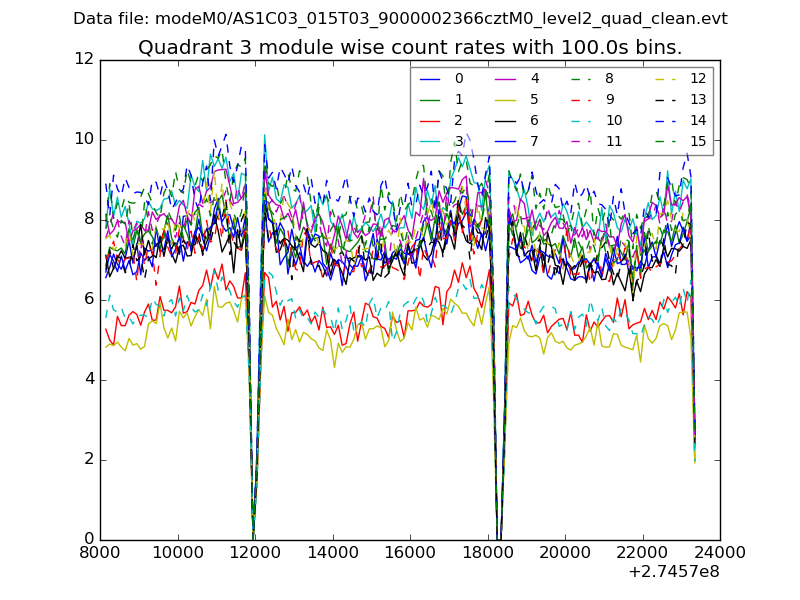
| Module-wise count rates for Quadrant C Data is divided into 100 sec bins |
 |
 |
| Module-wise count rates for Quadrant D Data is divided into 100 sec bins |
 |
 |
| Parameter | Plot |
|---|---|
| CZT HV Monitor | 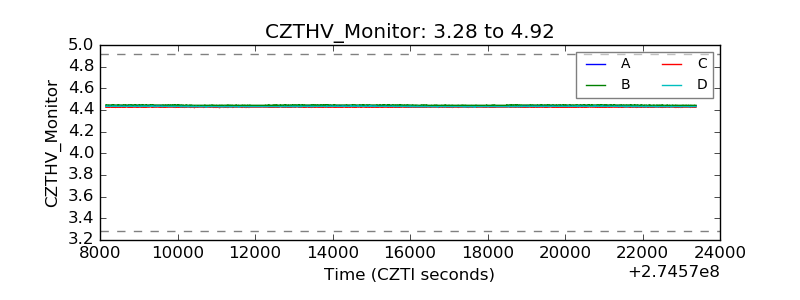 |
| D_VDD |  |
| Temperature 1 |  |
| Veto HV Monitor |  |
| Veto LLD | 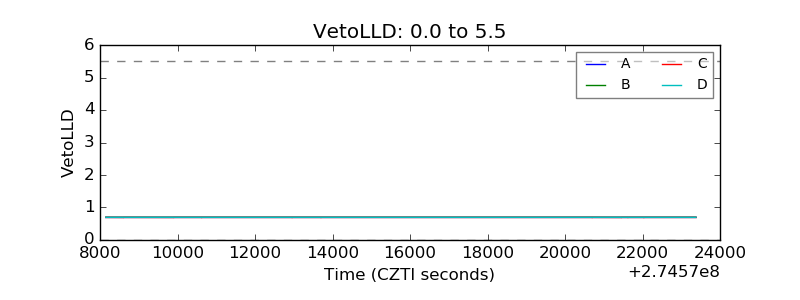 |
| Alpha Counter | 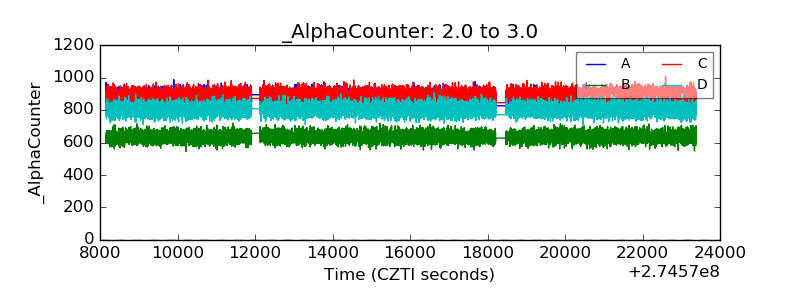 |
| _CPM_Rate |  |
| CZT Counter |  |
| +2.5 Volts monitor |  |
| +5 Volts monitor |  |
| _ROLL_ROT | 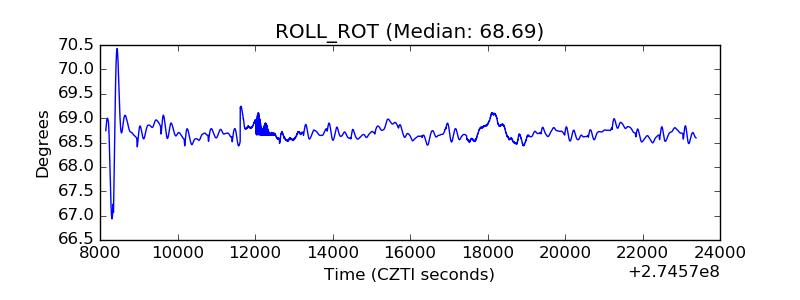 |
| _Roll_DEC |  |
| _Roll_RA | 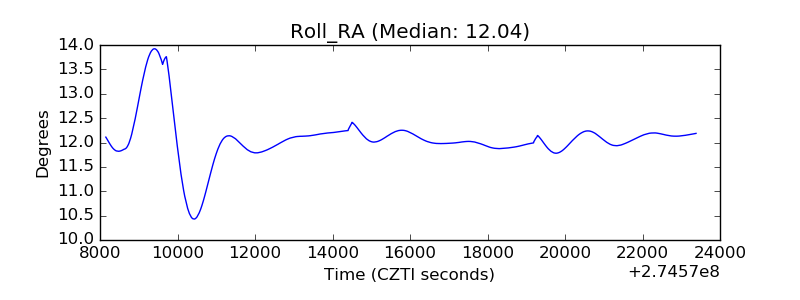 |
| Veto Counter | 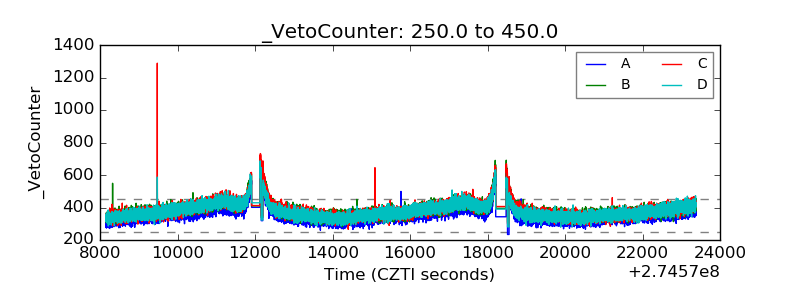 |