| Param | Original file | Final file |
|---|---|---|
| Filename | modeM0/AS1C03_015T03_9000002366_16013cztM0_level2.evt | modeM0/AS1C03_015T03_9000002366_16013cztM0_level2_quad_clean.evt |
| Size (bytes) | 347,391,360 | 99,480,960 |
| Size | 331.3 MB | 94.9 MB |
| Events in quadrant A | 2,484,597 | 661,078 |
| Events in quadrant B | 2,699,364 | 675,326 |
| Events in quadrant C | 2,547,455 | 655,705 |
| Events in quadrant D | 2,425,048 | 646,528 |
| Mode M9 | |||
|---|---|---|---|
| Quadrant | BADHDUFLAG | Total packets | Discarded packets |
| A | 0 | 3 | 0 |
| B | 0 | 3 | 0 |
| C | 0 | 3 | 0 |
| D | 0 | 3 | 0 |
| Mode SS | |||
|---|---|---|---|
| Quadrant | BADHDUFLAG | Total packets | Discarded packets |
| A | 0 | 110 | 0 |
| B | 0 | 110 | 0 |
| C | 0 | 110 | 0 |
| D | 0 | 110 | 0 |
| Mode M0 | |||
|---|---|---|---|
| Quadrant | BADHDUFLAG | Total packets | Discarded packets |
| A | 0 | 11069 | 2 |
| B | 0 | 11747 | 1 |
| C | 0 | 11170 | 1 |
| D | 0 | 11101 | 1 |
| Quadrant | Total seconds | Saturated seconds | Saturation percentage |
|---|---|---|---|
| A | 5348 | 19 | 0.355273% |
| B | 5348 | 63 | 1.178010% |
| C | 5348 | 44 | 0.822737% |
| D | 5348 | 14 | 0.261780% |
Noise dominated data is calculated using 1-second bins in cleaned event files. If a bin has >2000 counts, and if more than 50% of those come from <1% of pixels, then it is considered to be noise-dominated and hence unusable.
| Quadrant | # 1 sec bins | Bins with >0 counts | Bins with >2000 counts | High rate bins dominated by noise | Noise dominated (total time) | Noise dominated (detector-on time) | Marked lightcurve |
|---|---|---|---|---|---|---|---|
| A | 5609 | 5351 | 0 | 0 | 0.00% | 0.00% | 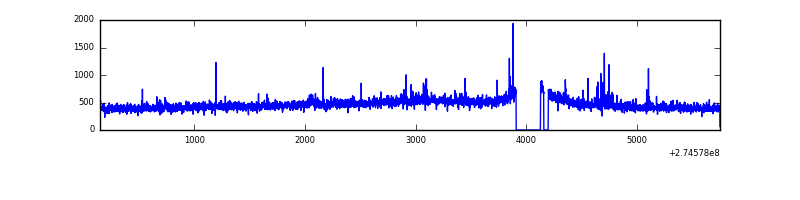 |
| B | 5609 | 5351 | 12 | 12 | 0.21% | 0.22% | 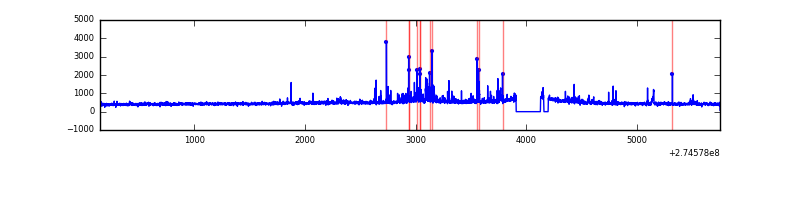 |
| C | 5609 | 5351 | 1 | 1 | 0.02% | 0.02% | 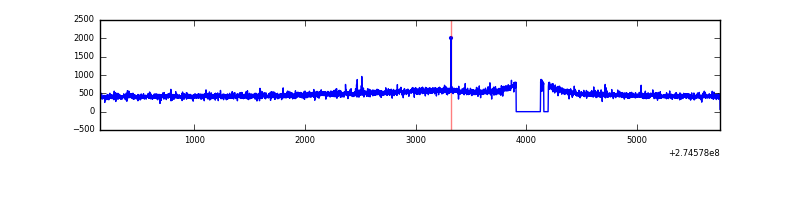 |
| D | 5609 | 5351 | 0 | 0 | 0.00% | 0.00% | 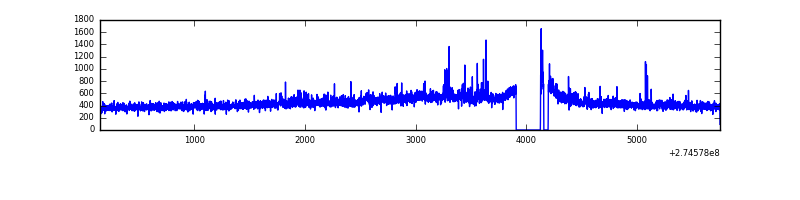 |
Top three noisy pixels from each quadrant. If the there are fewer than three noisy pixels in the level2.evt file, extra rows are filled as -1
| Pixel properties | Quadrant properties | ||||||
|---|---|---|---|---|---|---|---|
| Quadrant | DetID | PixID | Counts | Sigma | Mean | Median | Sigma |
| A | 15 | 239 | 14329 | 107.41 | 629 | 614 | 127.7 |
| A | 15 | 157 | 13965 | 104.55 | 629 | 614 | 127.7 |
| A | 14 | 239 | 13269 | 99.1 | 629 | 614 | 127.7 |
| B | 7 | 220 | 122718 | 1013.07 | 632 | 615 | 120.5 |
| B | 0 | 189 | 45142 | 369.44 | 632 | 615 | 120.5 |
| B | 12 | 111 | 13350 | 105.66 | 632 | 615 | 120.5 |
| C | 14 | 238 | 92911 | 646.87 | 609 | 612 | 142.7 |
| C | 3 | 233 | 56027 | 388.37 | 609 | 612 | 142.7 |
| C | 0 | 207 | 9611 | 63.07 | 609 | 612 | 142.7 |
| D | 2 | 152 | 74672 | 491.6 | 617 | 598 | 150.7 |
| D | 2 | 234 | 21318 | 137.51 | 617 | 598 | 150.7 |
| D | 2 | 16 | 8831 | 54.64 | 617 | 598 | 150.7 |
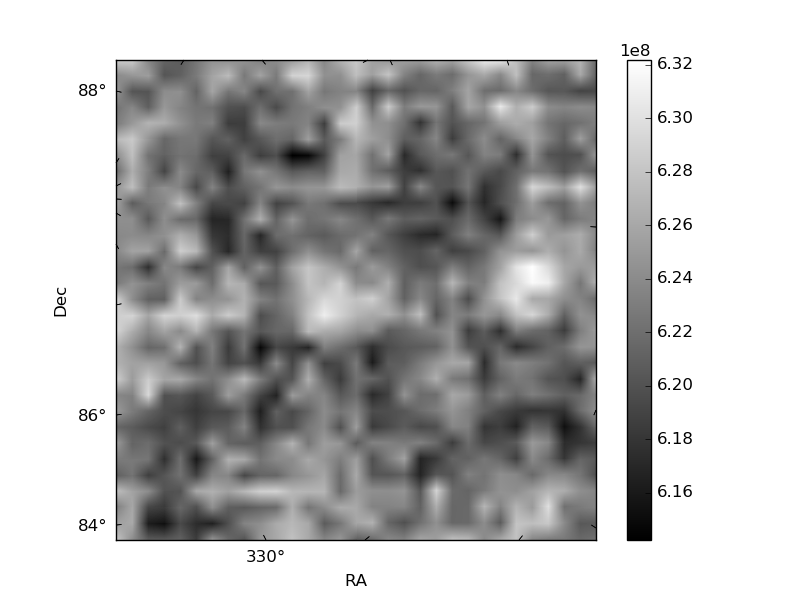
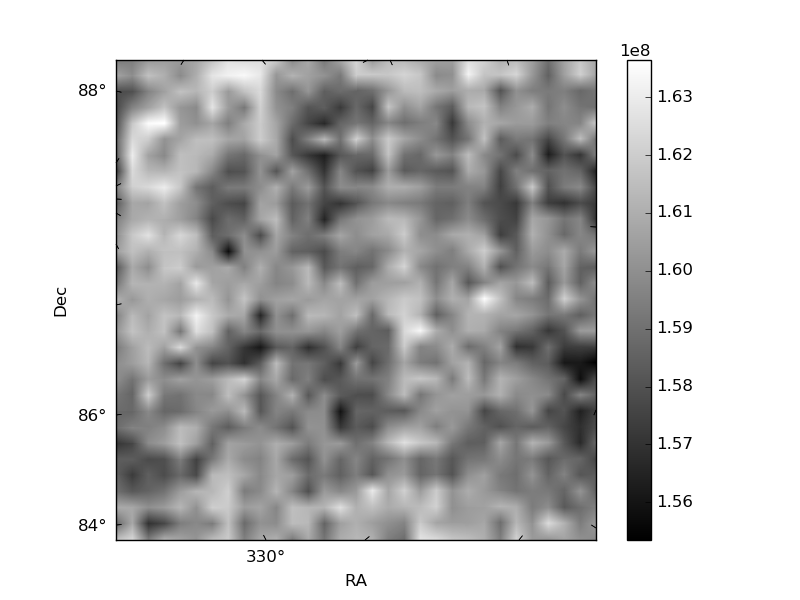
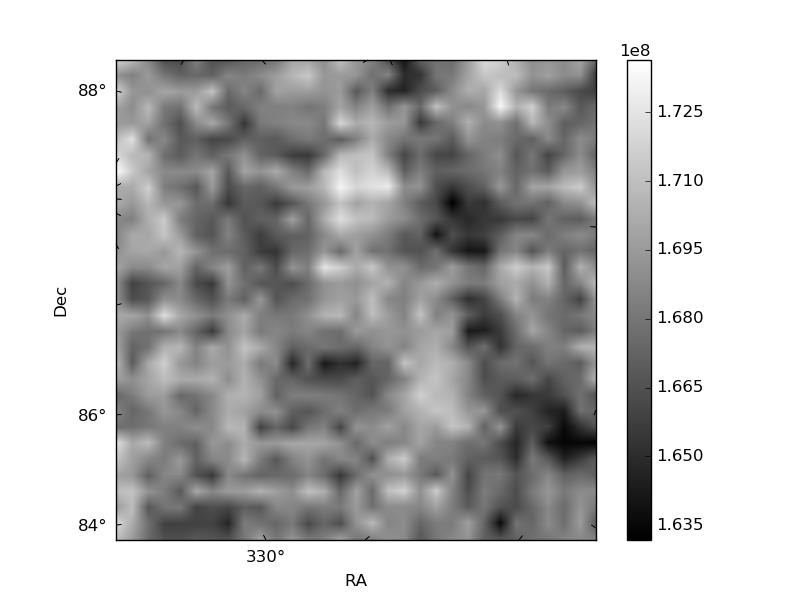
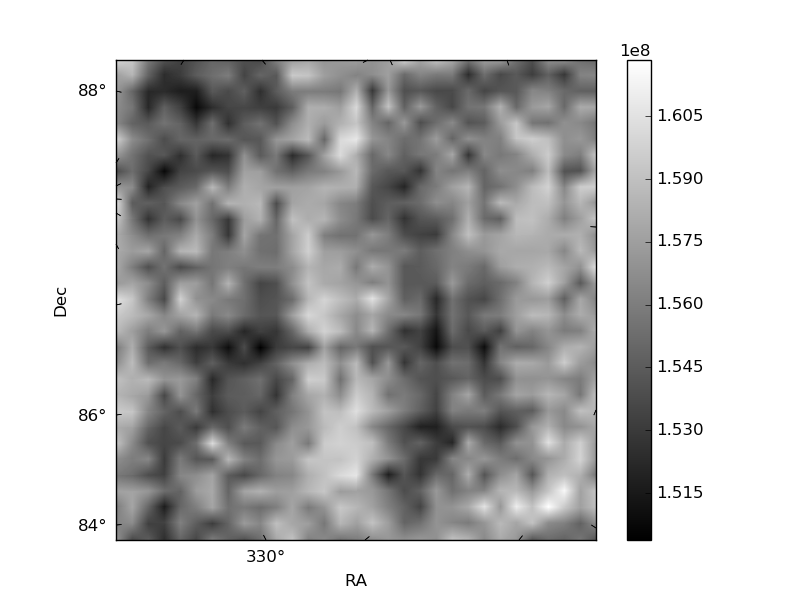
Histogram calculated using DETX and DETY for each event in the final _common_clean file
| Quadrant A | 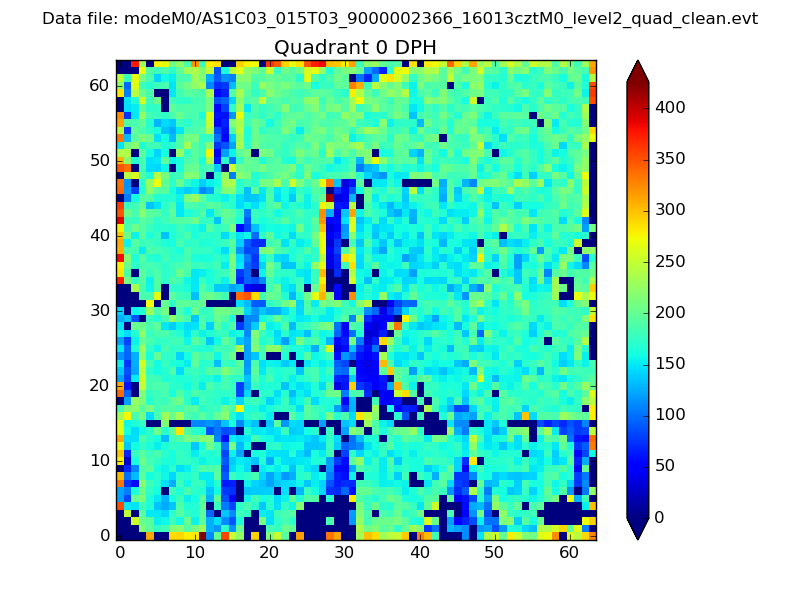 |
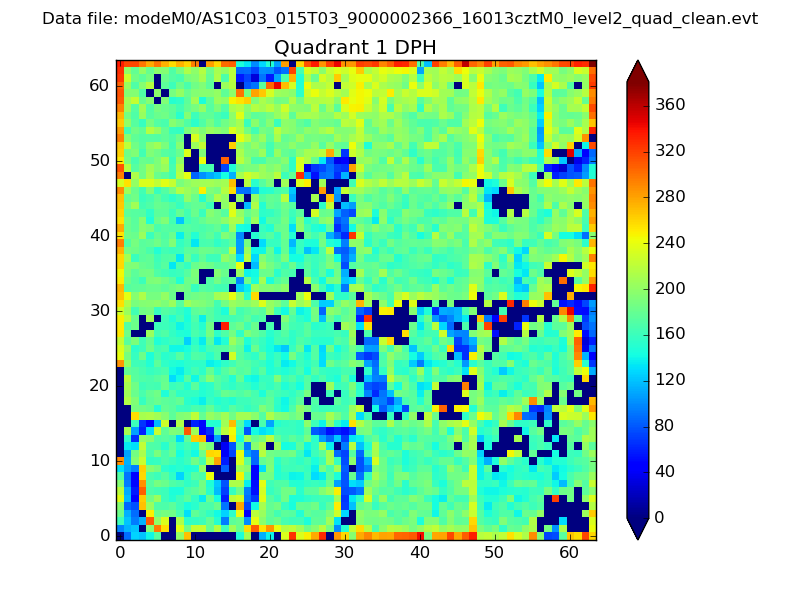 |
Quadrant B |
|---|---|---|---|
| Quadrant D | 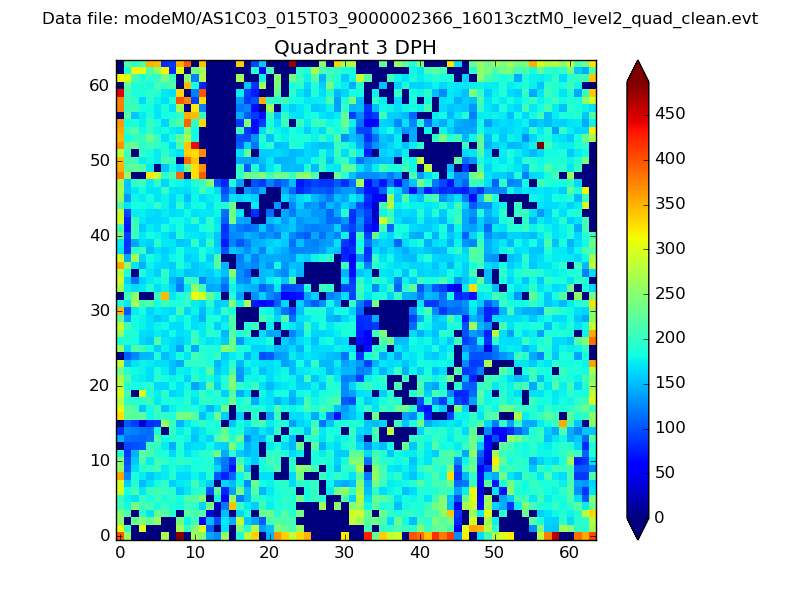 |
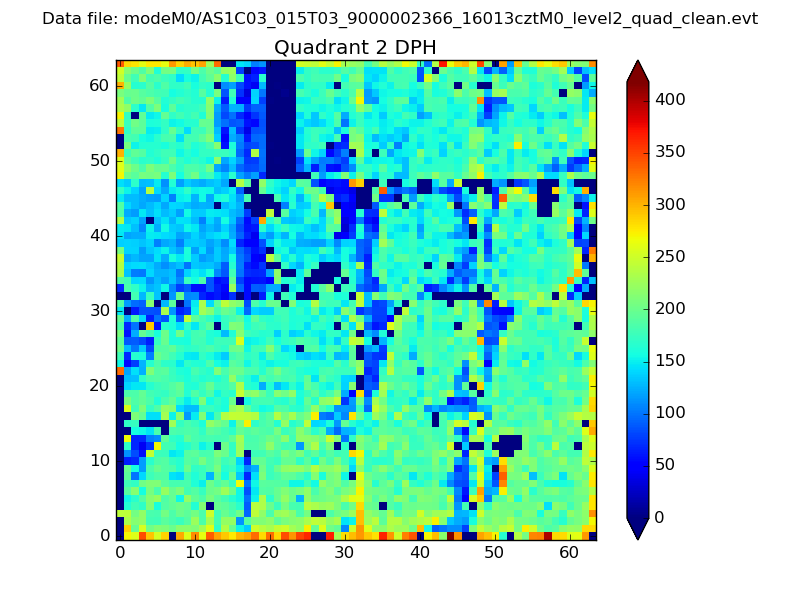 |
Quadrant C |
| Plot type | Count rate plots | Images |
|---|---|---|
| Comparison with Poisson distribution Blue bars denote a histogram of data divided into 1 sec bins. Red curve is a Poisson curve with rate = median count rate of data. |
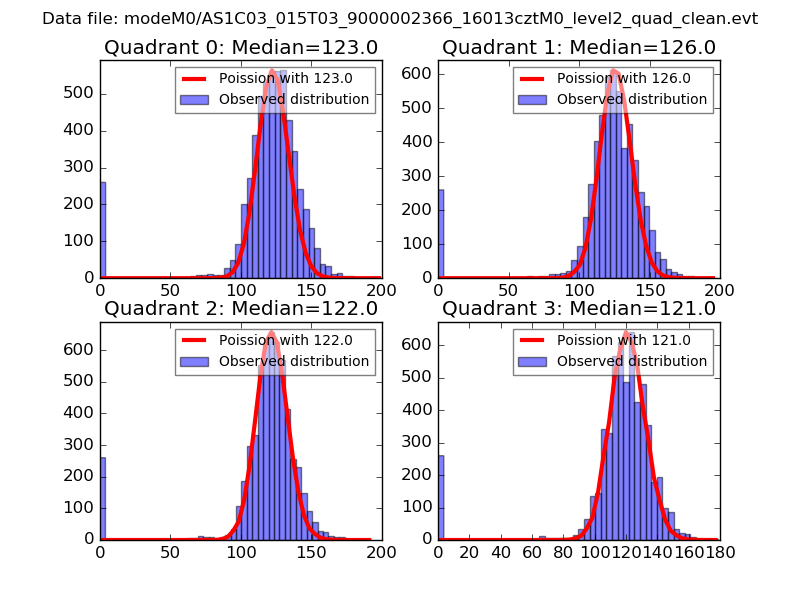 |
 |
| Quadrant-wise count rates Data is divided into 100 sec bins |
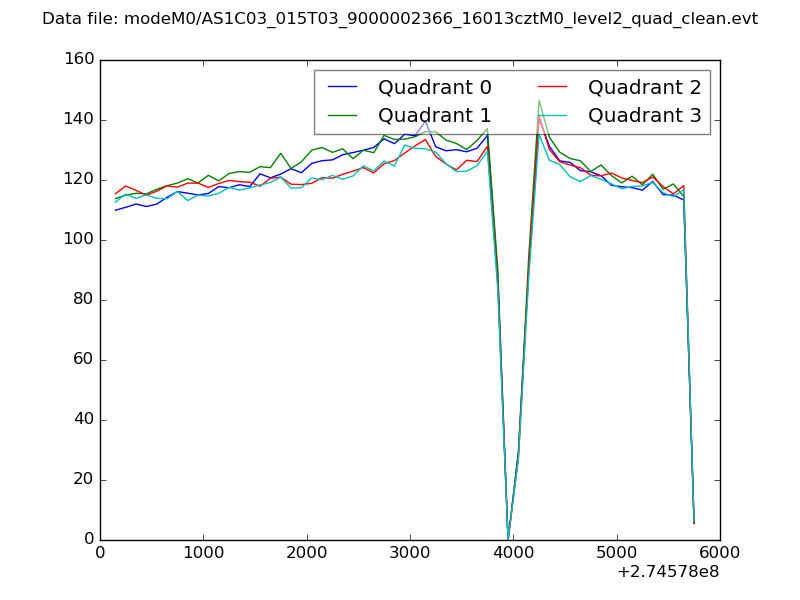 |
|
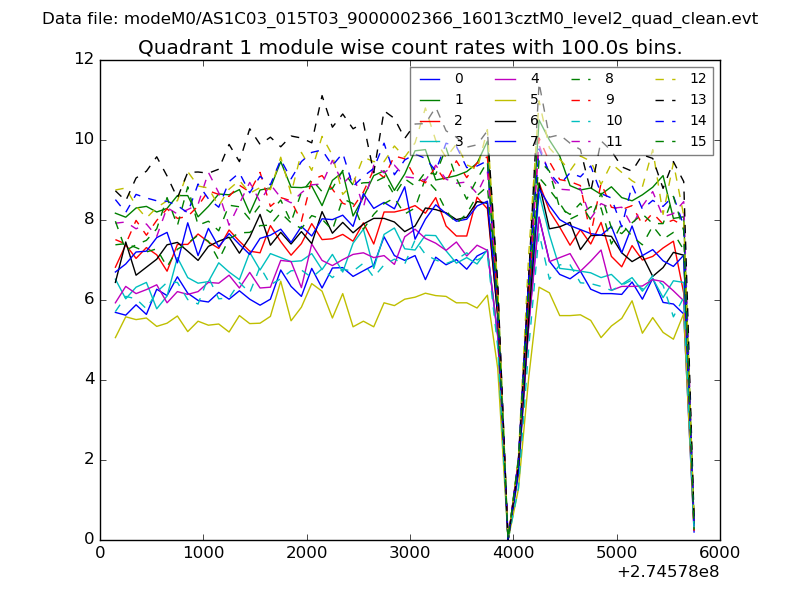
| Module-wise count rates for Quadrant A Data is divided into 100 sec bins |
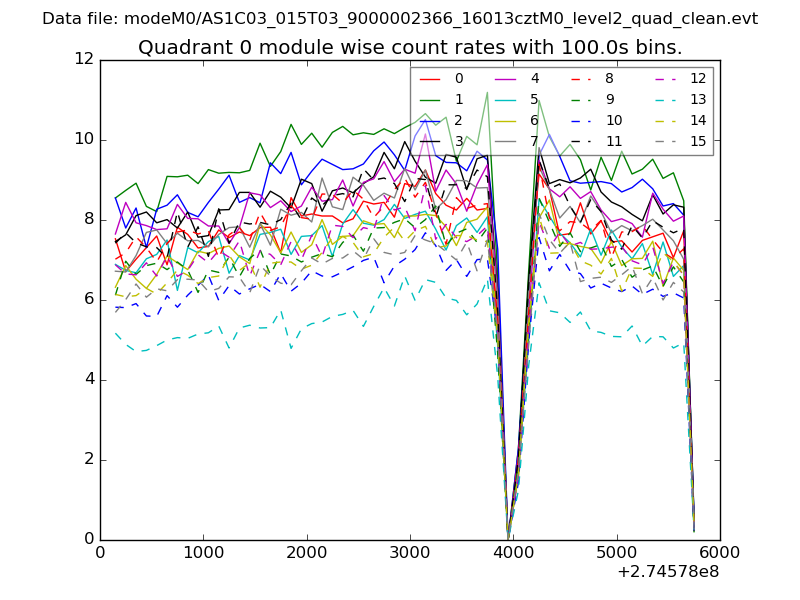 |
 |
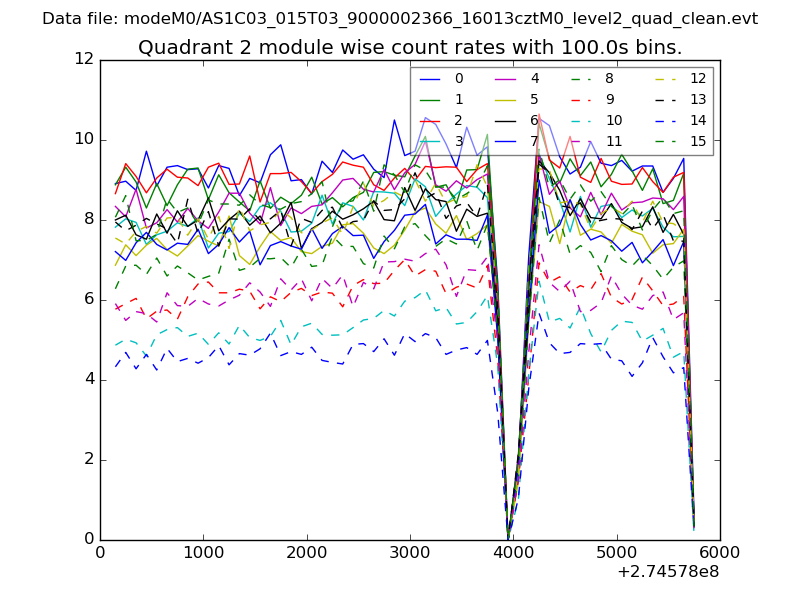
| Module-wise count rates for Quadrant B Data is divided into 100 sec bins |
 |
 |
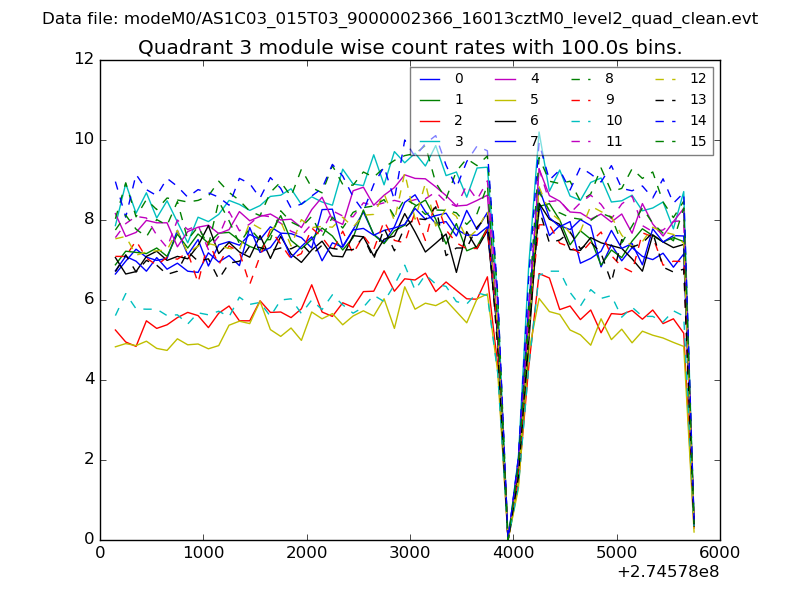
| Module-wise count rates for Quadrant C Data is divided into 100 sec bins |
 |
 |
| Module-wise count rates for Quadrant D Data is divided into 100 sec bins |
 |
 |
| Parameter | Plot |
|---|---|
| CZT HV Monitor | 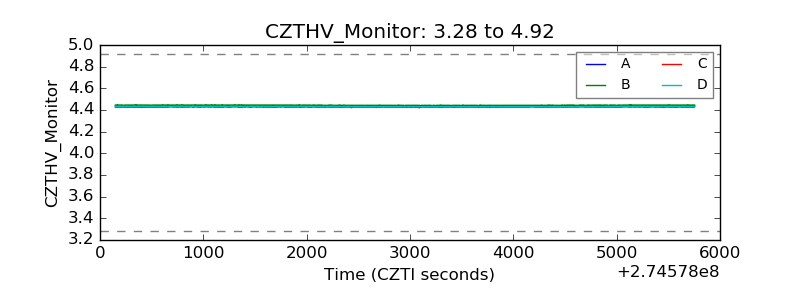 |
| D_VDD | 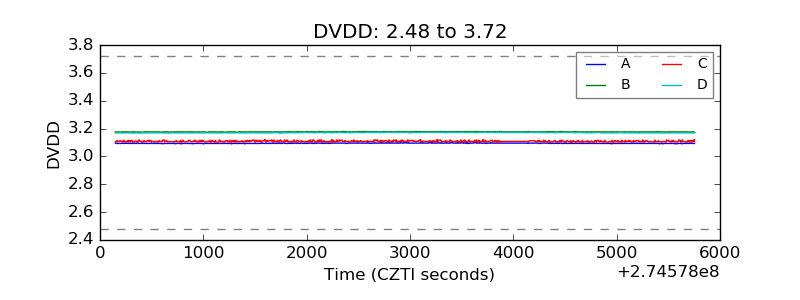 |
| Temperature 1 | 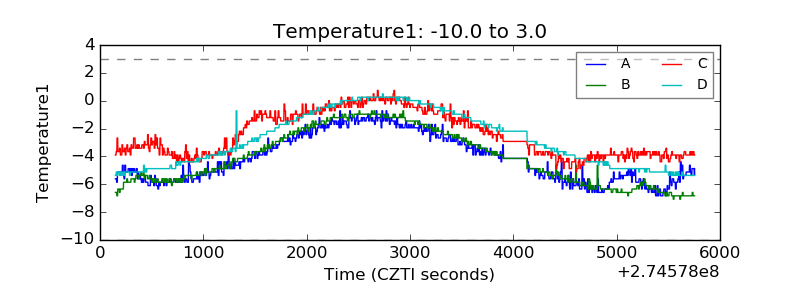 |
| Veto HV Monitor |  |
| Veto LLD | 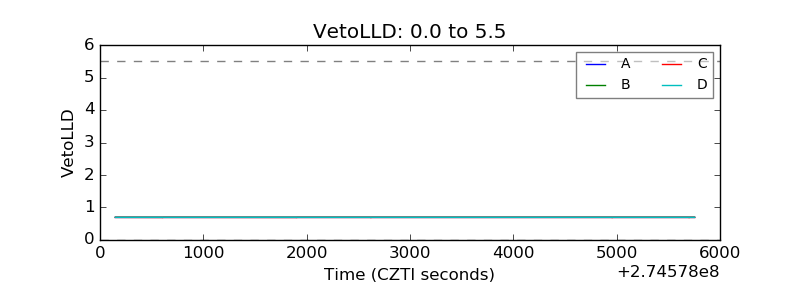 |
| Alpha Counter | 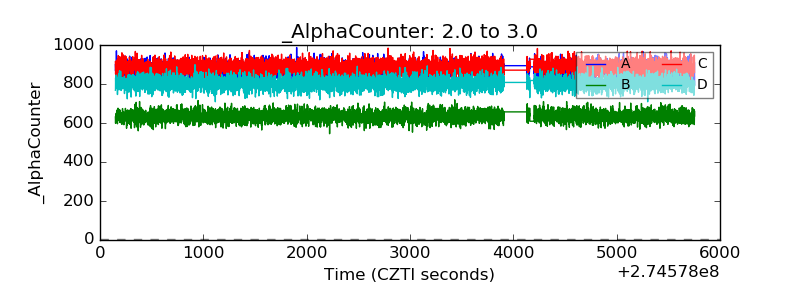 |
| _CPM_Rate | 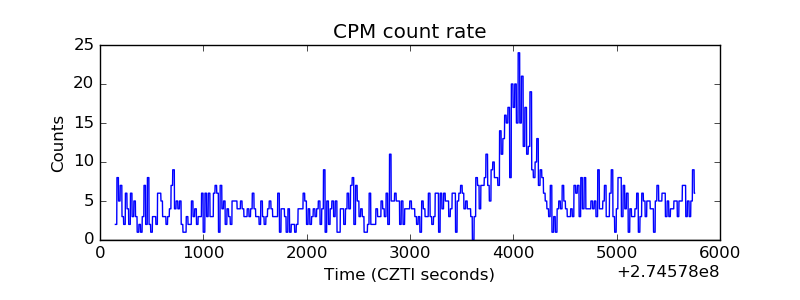 |
| CZT Counter | 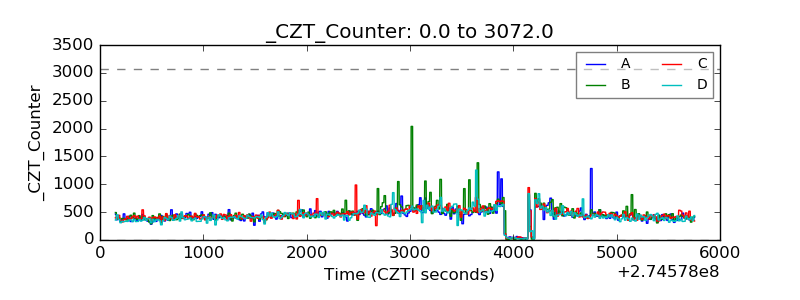 |
| +2.5 Volts monitor |  |
| +5 Volts monitor |  |
| _ROLL_ROT | 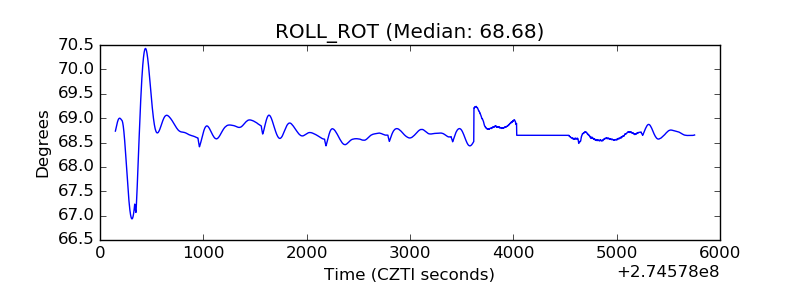 |
| _Roll_DEC | 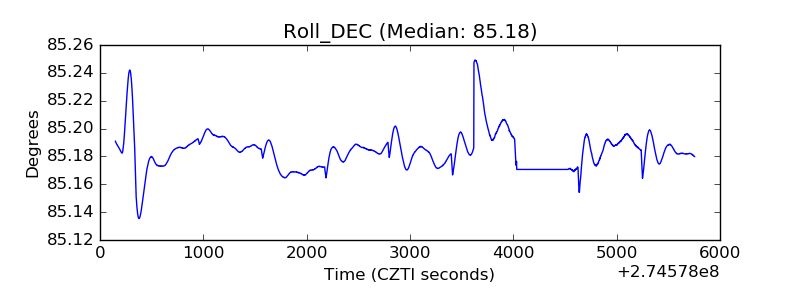 |
| _Roll_RA | 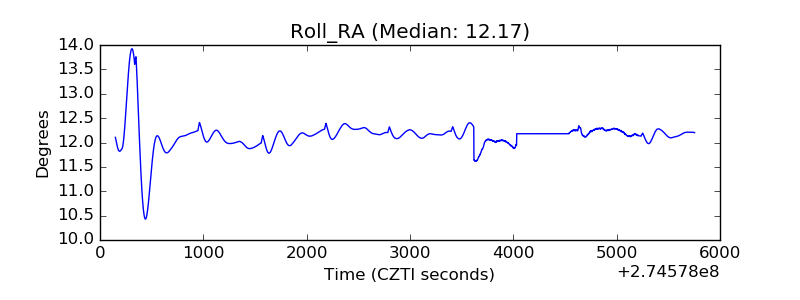 |
| Veto Counter | 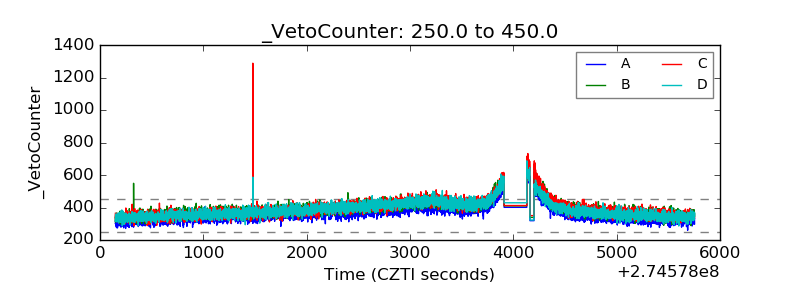 |