| Param | Original file | Final file |
|---|---|---|
| Filename | modeM0/AS1C03_015T03_9000002366_16014cztM0_level2.evt | modeM0/AS1C03_015T03_9000002366_16014cztM0_level2_quad_clean.evt |
| Size (bytes) | 532,399,680 | 150,376,320 |
| Size | 507.7 MB | 143.4 MB |
| Events in quadrant A | 3,843,577 | 997,739 |
| Events in quadrant B | 4,156,695 | 1,015,908 |
| Events in quadrant C | 3,837,670 | 993,803 |
| Events in quadrant D | 3,729,537 | 978,238 |
| Mode M9 | |||
|---|---|---|---|
| Quadrant | BADHDUFLAG | Total packets | Discarded packets |
| A | 0 | 5 | 0 |
| B | 0 | 5 | 0 |
| C | 0 | 5 | 0 |
| D | 0 | 5 | 0 |
| Mode SS | |||
|---|---|---|---|
| Quadrant | BADHDUFLAG | Total packets | Discarded packets |
| A | 0 | 172 | 0 |
| B | 0 | 172 | 0 |
| C | 0 | 172 | 0 |
| D | 0 | 172 | 0 |
| Mode M0 | |||
|---|---|---|---|
| Quadrant | BADHDUFLAG | Total packets | Discarded packets |
| A | 0 | 17206 | 4 |
| B | 0 | 18018 | 3 |
| C | 0 | 16968 | 3 |
| D | 0 | 17188 | 3 |
| Quadrant | Total seconds | Saturated seconds | Saturation percentage |
|---|---|---|---|
| A | 8184 | 40 | 0.488759% |
| B | 8184 | 165 | 2.016129% |
| C | 8184 | 80 | 0.977517% |
| D | 8184 | 29 | 0.354350% |
Noise dominated data is calculated using 1-second bins in cleaned event files. If a bin has >2000 counts, and if more than 50% of those come from <1% of pixels, then it is considered to be noise-dominated and hence unusable.
| Quadrant | # 1 sec bins | Bins with >0 counts | Bins with >2000 counts | High rate bins dominated by noise | Noise dominated (total time) | Noise dominated (detector-on time) | Marked lightcurve |
|---|---|---|---|---|---|---|---|
| A | 8756 | 8189 | 4 | 4 | 0.05% | 0.05% | 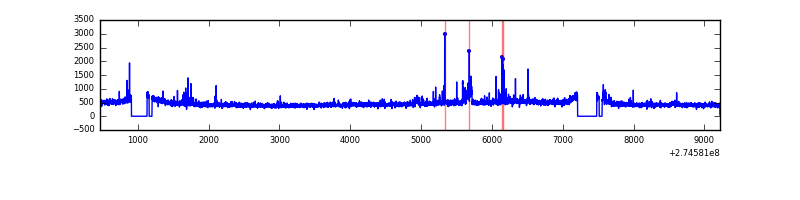 |
| B | 8756 | 8189 | 79 | 79 | 0.90% | 0.96% | 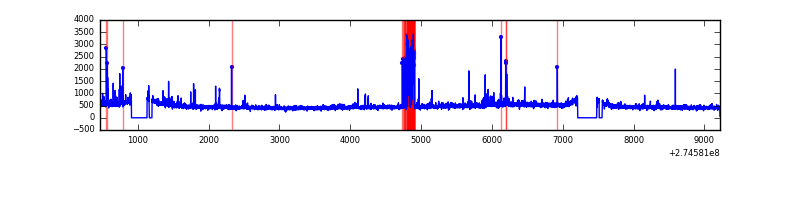 |
| C | 8756 | 8189 | 0 | 0 | 0.00% | 0.00% |  |
| D | 8756 | 8189 | 6 | 6 | 0.07% | 0.07% | 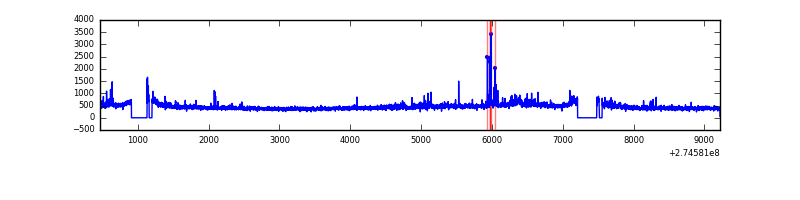 |
Top three noisy pixels from each quadrant. If the there are fewer than three noisy pixels in the level2.evt file, extra rows are filled as -1
| Pixel properties | Quadrant properties | ||||||
|---|---|---|---|---|---|---|---|
| Quadrant | DetID | PixID | Counts | Sigma | Mean | Median | Sigma |
| A | 15 | 157 | 72611 | 372.48 | 951 | 928 | 192.4 |
| A | 14 | 239 | 36136 | 182.95 | 951 | 928 | 192.4 |
| A | 12 | 96 | 21397 | 106.36 | 951 | 928 | 192.4 |
| B | 0 | 245 | 227060 | 1242.12 | 957 | 931 | 182.1 |
| B | 7 | 220 | 70746 | 383.49 | 957 | 931 | 182.1 |
| B | 0 | 189 | 48757 | 262.71 | 957 | 931 | 182.1 |
| C | 14 | 238 | 143402 | 661.23 | 925 | 932 | 215.5 |
| C | 3 | 233 | 67346 | 308.24 | 925 | 932 | 215.5 |
| C | 8 | 128 | 10445 | 44.15 | 925 | 932 | 215.5 |
| D | 2 | 152 | 101678 | 444.39 | 930 | 902 | 226.8 |
| D | 2 | 16 | 45150 | 195.12 | 930 | 902 | 226.8 |
| D | 10 | 70 | 44295 | 191.35 | 930 | 902 | 226.8 |
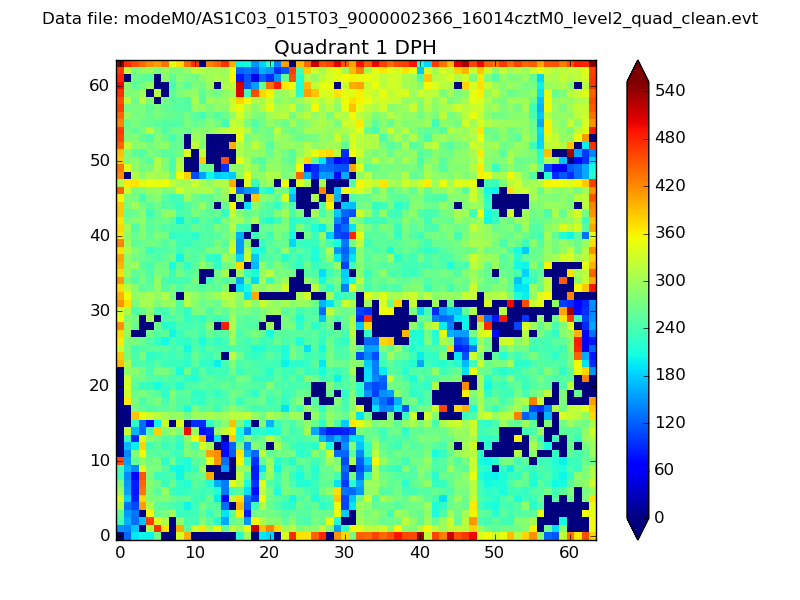
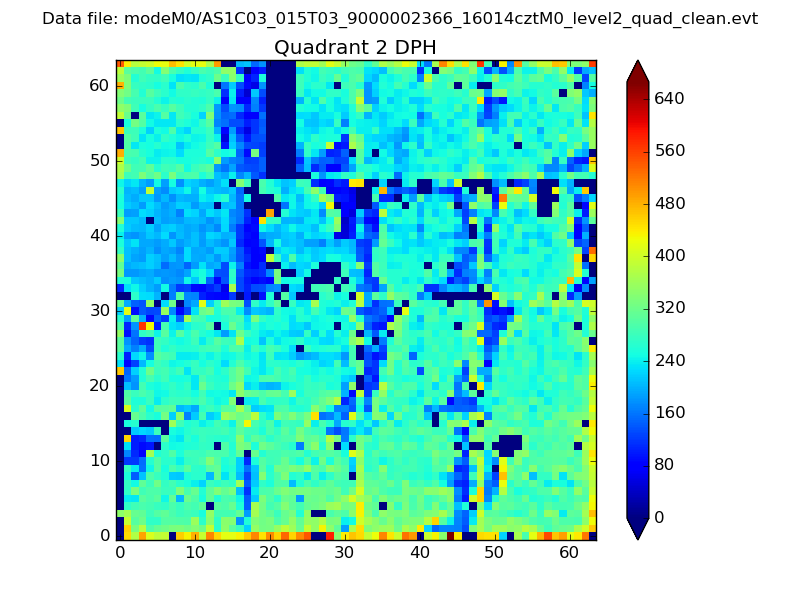
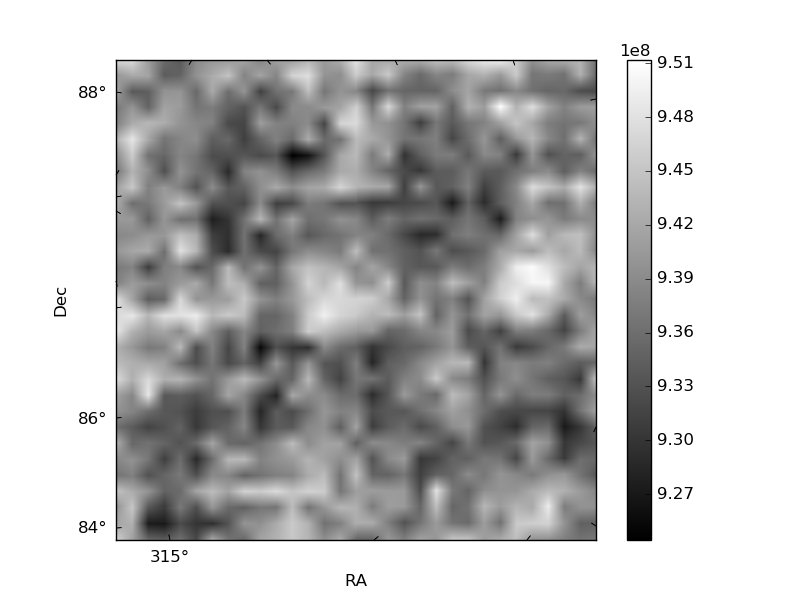
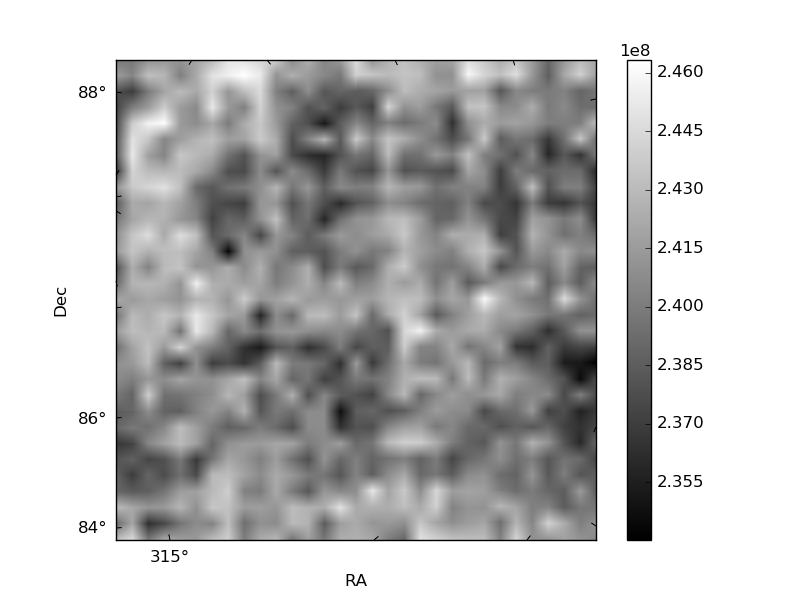
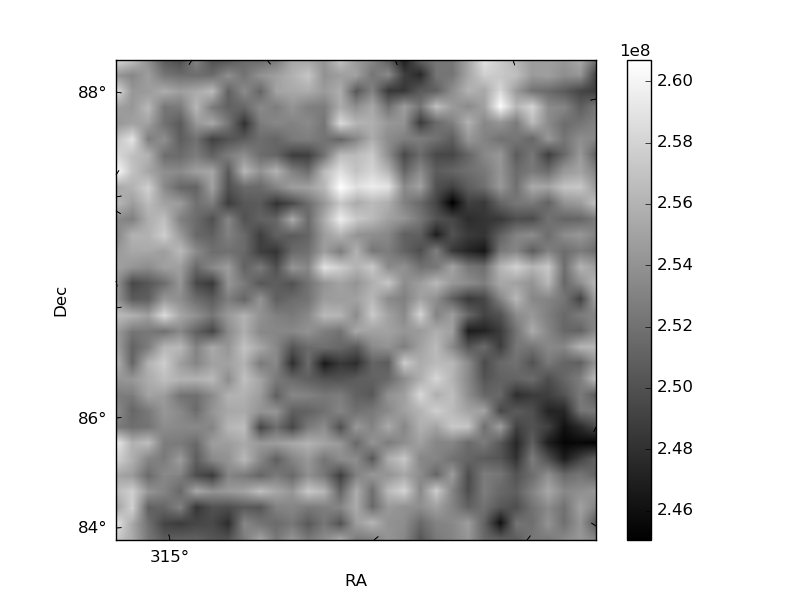
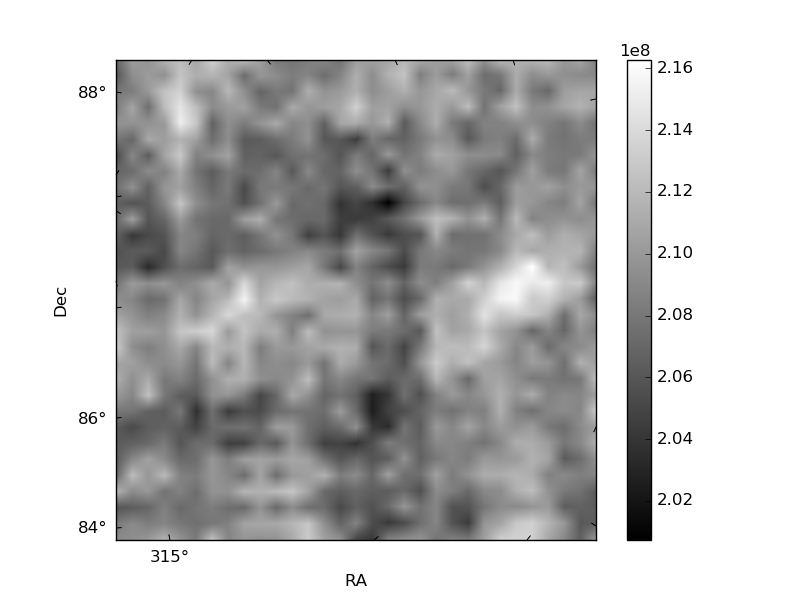
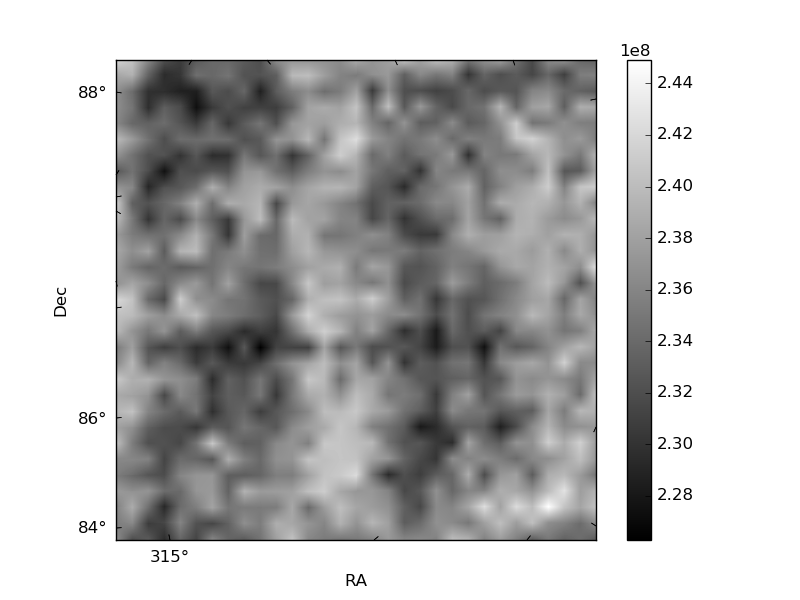
Histogram calculated using DETX and DETY for each event in the final _common_clean file
| Quadrant A | 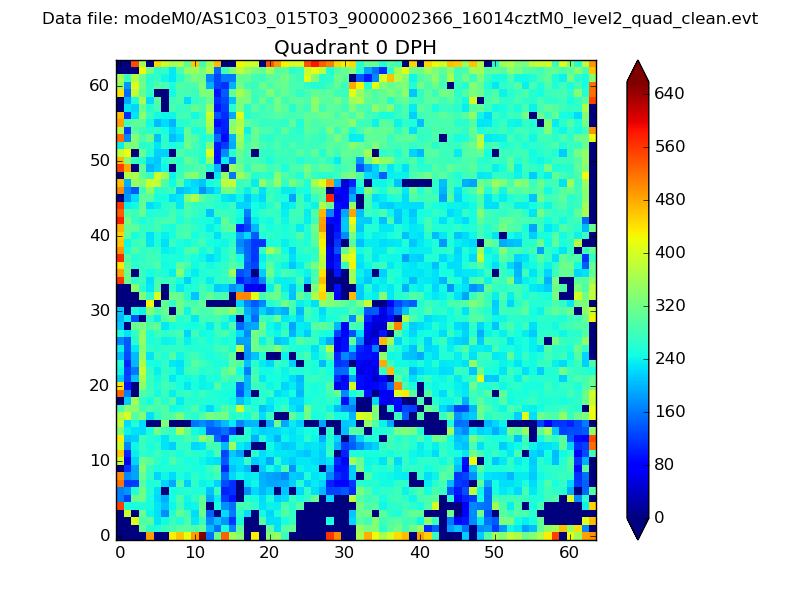 |
 |
Quadrant B |
|---|---|---|---|
| Quadrant D | 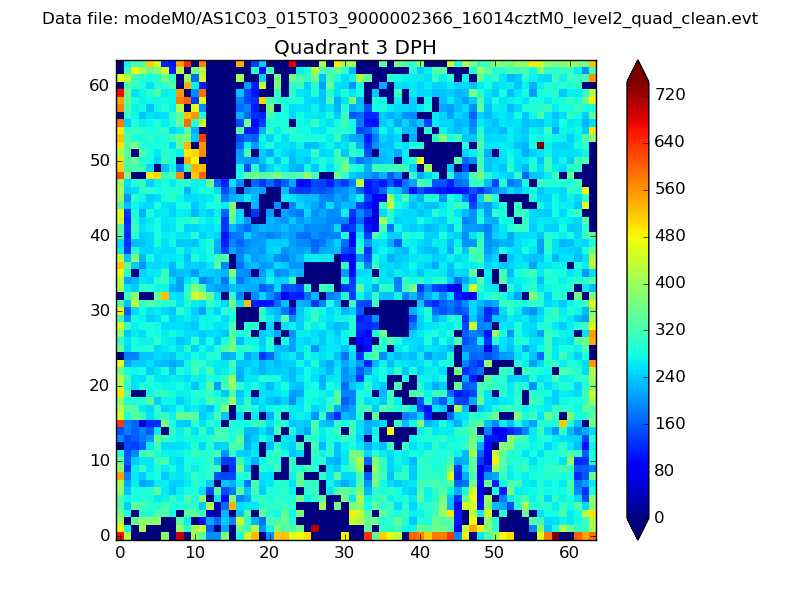 |
 |
Quadrant C |
| Plot type | Count rate plots | Images |
|---|---|---|
| Comparison with Poisson distribution Blue bars denote a histogram of data divided into 1 sec bins. Red curve is a Poisson curve with rate = median count rate of data. |
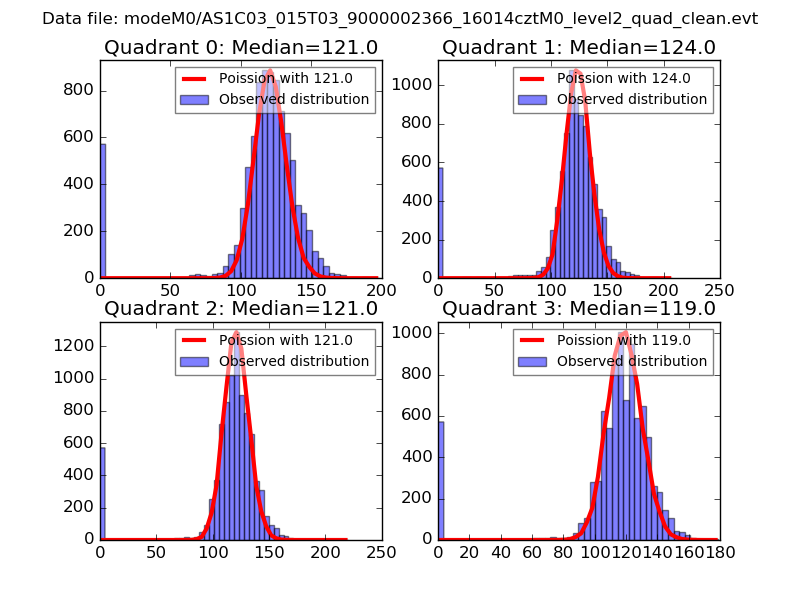 |
 |
| Quadrant-wise count rates Data is divided into 100 sec bins |
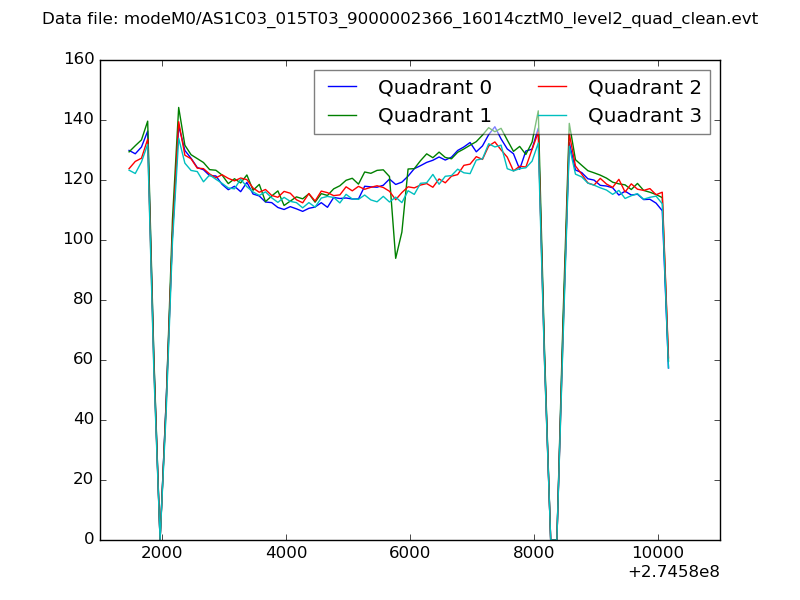 |
|
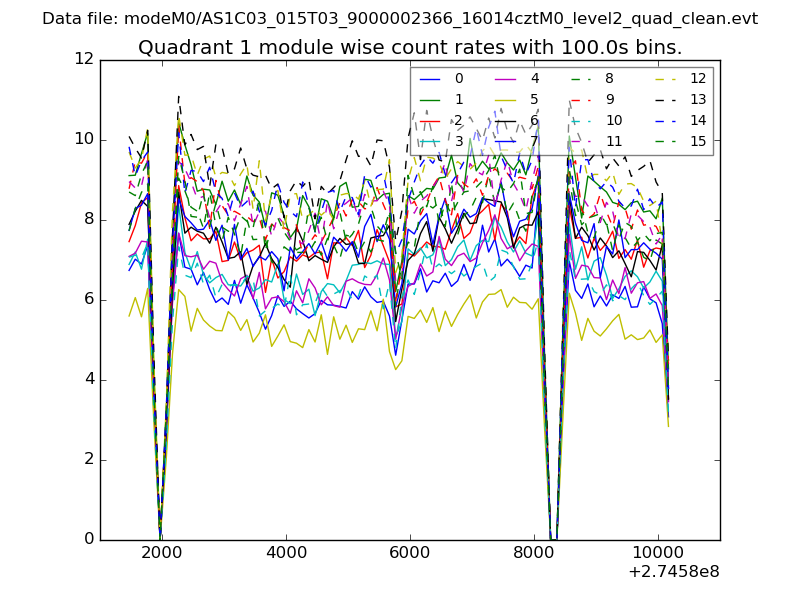
| Module-wise count rates for Quadrant A Data is divided into 100 sec bins |
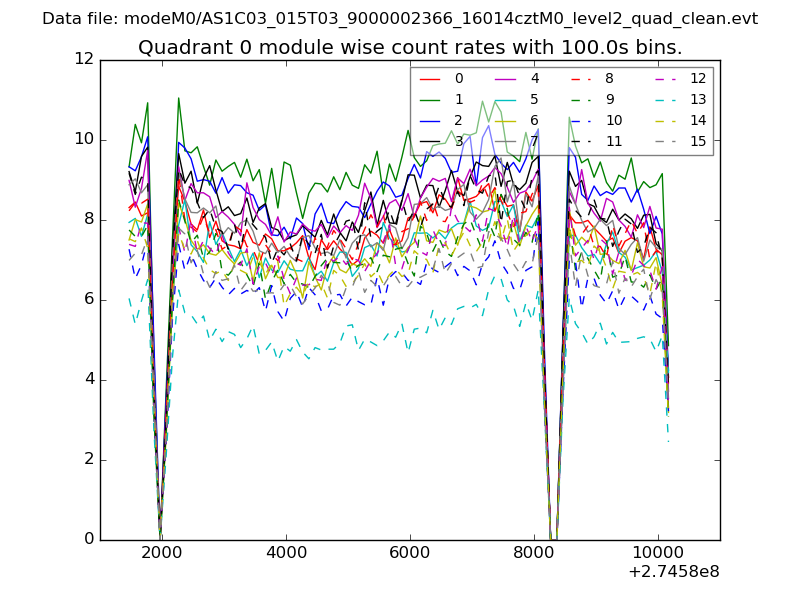 |
 |
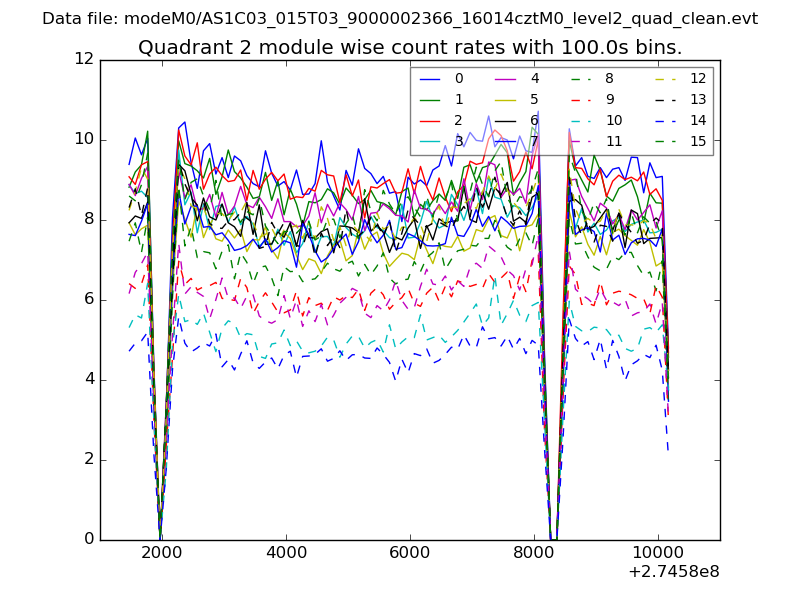
| Module-wise count rates for Quadrant B Data is divided into 100 sec bins |
 |
 |
| Module-wise count rates for Quadrant C Data is divided into 100 sec bins |
 |
 |
| Module-wise count rates for Quadrant D Data is divided into 100 sec bins |
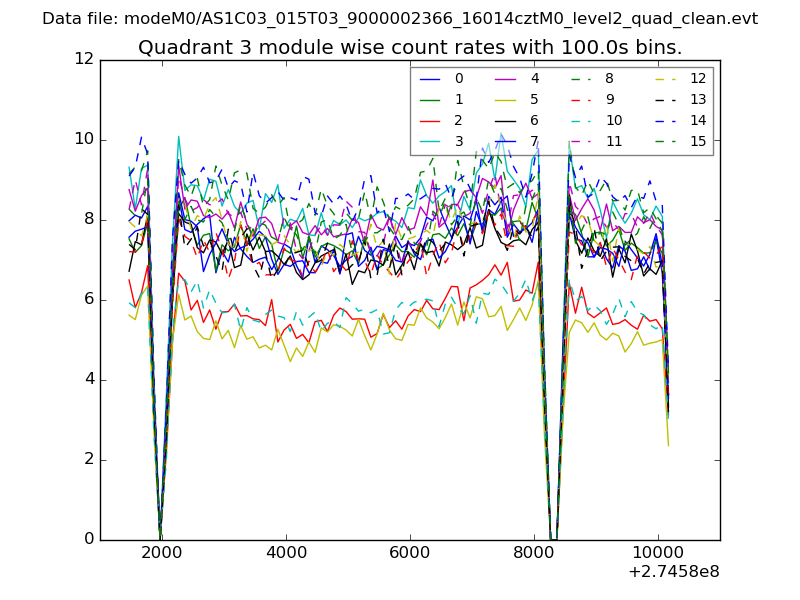 |
 |
| Parameter | Plot |
|---|---|
| CZT HV Monitor | 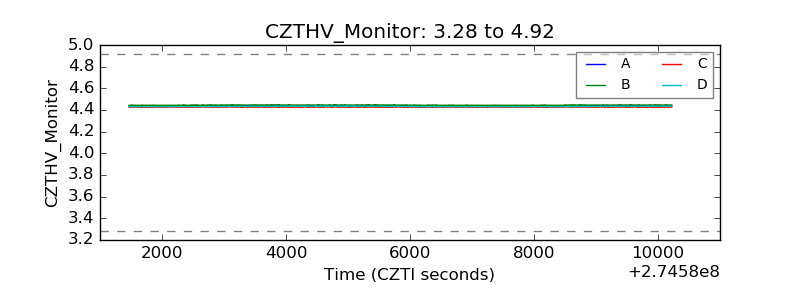 |
| D_VDD | 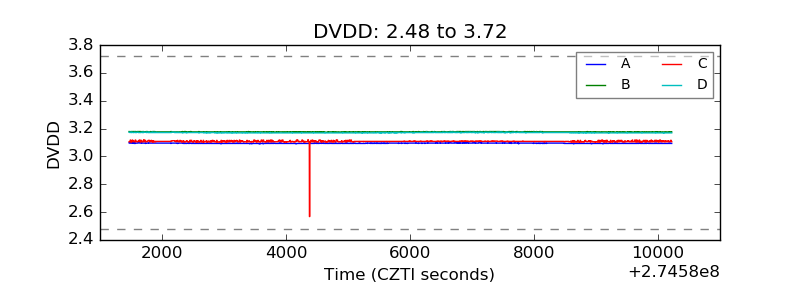 |
| Temperature 1 | 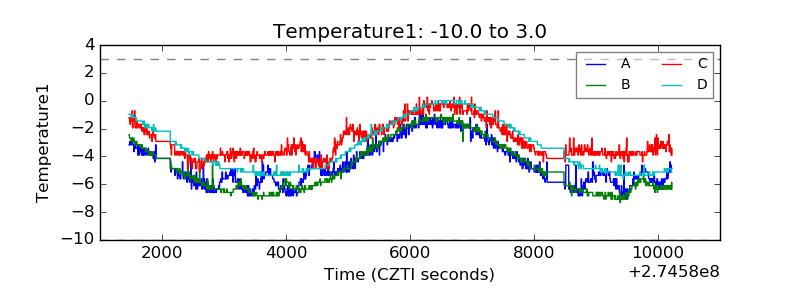 |
| Veto HV Monitor |  |
| Veto LLD | 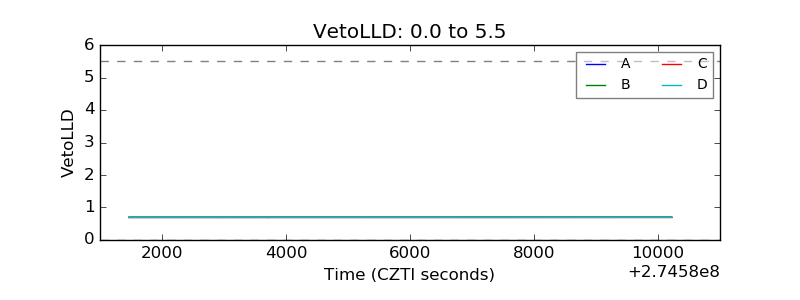 |
| Alpha Counter | 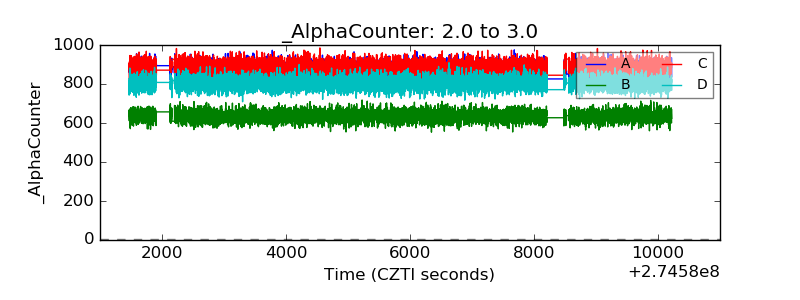 |
| _CPM_Rate | 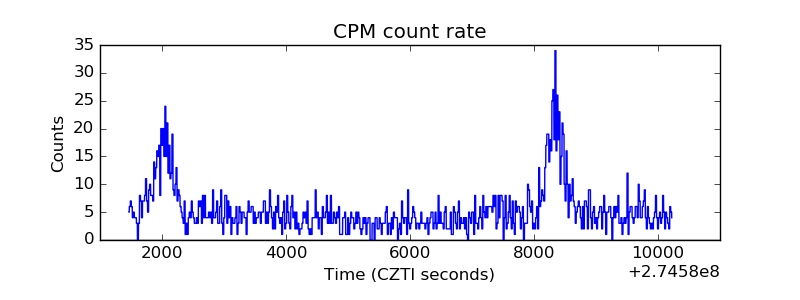 |
| CZT Counter | 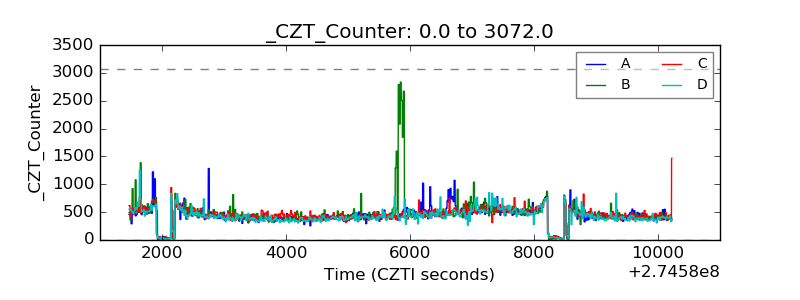 |
| +2.5 Volts monitor |  |
| +5 Volts monitor |  |
| _ROLL_ROT | 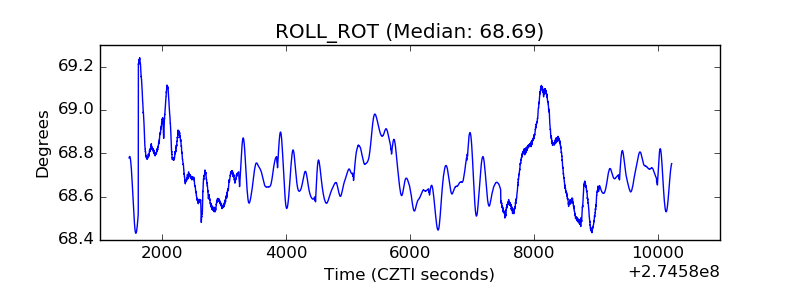 |
| _Roll_DEC | 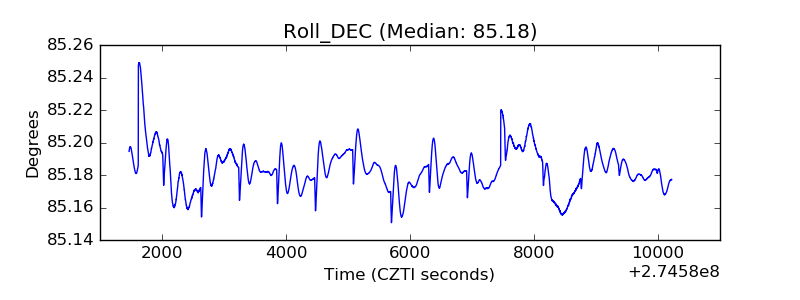 |
| _Roll_RA | 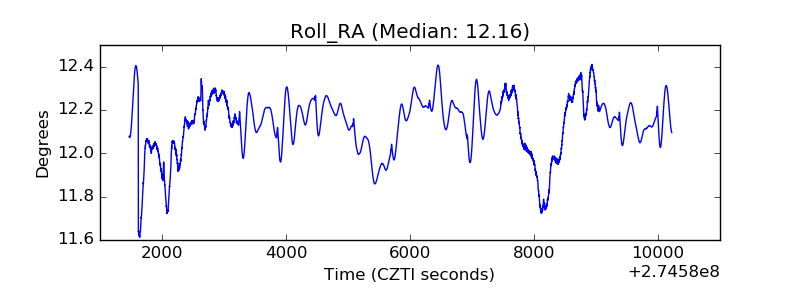 |
| Veto Counter | 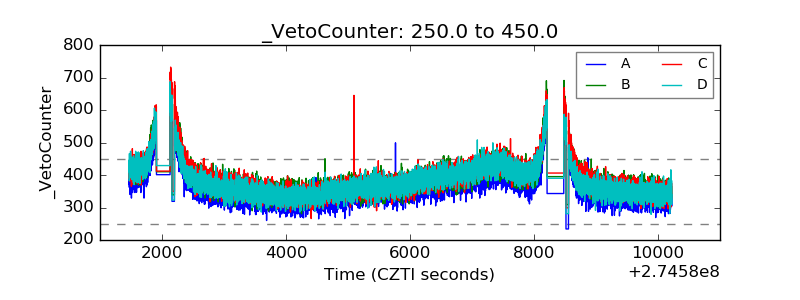 |