| Param | Original file | Final file |
|---|---|---|
| Filename | modeM0/AS1C03_015T03_9000002366_16016cztM0_level2.evt | modeM0/AS1C03_015T03_9000002366_16016cztM0_level2_quad_clean.evt |
| Size (bytes) | 335,833,920 | 96,238,080 |
| Size | 320.3 MB | 91.8 MB |
| Events in quadrant A | 2,397,277 | 638,403 |
| Events in quadrant B | 2,495,658 | 656,063 |
| Events in quadrant C | 2,428,016 | 629,771 |
| Events in quadrant D | 2,487,052 | 617,831 |
| Mode M9 | |||
|---|---|---|---|
| Quadrant | BADHDUFLAG | Total packets | Discarded packets |
| A | 0 | 2 | 0 |
| B | 0 | 2 | 0 |
| C | 0 | 2 | 0 |
| D | 0 | 2 | 0 |
| Mode SS | |||
|---|---|---|---|
| Quadrant | BADHDUFLAG | Total packets | Discarded packets |
| A | 0 | 110 | 0 |
| B | 0 | 110 | 0 |
| C | 0 | 110 | 0 |
| D | 0 | 110 | 0 |
| Mode M0 | |||
|---|---|---|---|
| Quadrant | BADHDUFLAG | Total packets | Discarded packets |
| A | 0 | 10845 | 4 |
| B | 0 | 11065 | 2 |
| C | 0 | 10832 | 2 |
| D | 0 | 11302 | 2 |
| Quadrant | Total seconds | Saturated seconds | Saturation percentage |
|---|---|---|---|
| A | 5312 | 19 | 0.357681% |
| B | 5313 | 44 | 0.828157% |
| C | 5313 | 39 | 0.734049% |
| D | 5313 | 26 | 0.489366% |
Noise dominated data is calculated using 1-second bins in cleaned event files. If a bin has >2000 counts, and if more than 50% of those come from <1% of pixels, then it is considered to be noise-dominated and hence unusable.
| Quadrant | # 1 sec bins | Bins with >0 counts | Bins with >2000 counts | High rate bins dominated by noise | Noise dominated (total time) | Noise dominated (detector-on time) | Marked lightcurve |
|---|---|---|---|---|---|---|---|
| A | 5625 | 5316 | 0 | 0 | 0.00% | 0.00% | 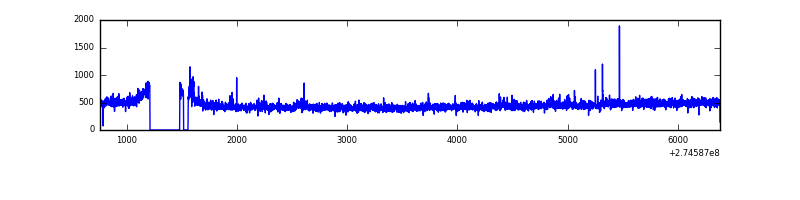 |
| B | 5625 | 5316 | 7 | 7 | 0.12% | 0.13% | 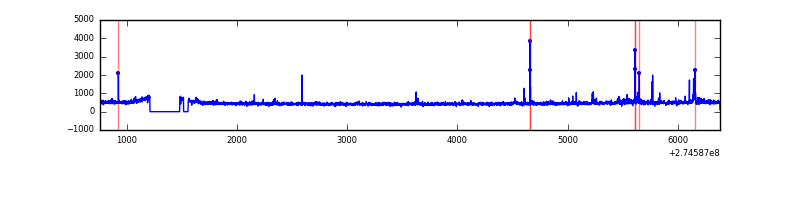 |
| C | 5625 | 5316 | 0 | 0 | 0.00% | 0.00% | 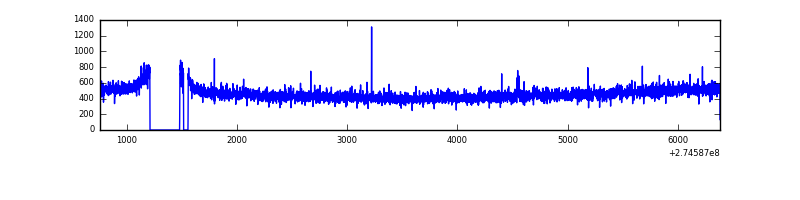 |
| D | 5625 | 5316 | 19 | 19 | 0.34% | 0.36% | 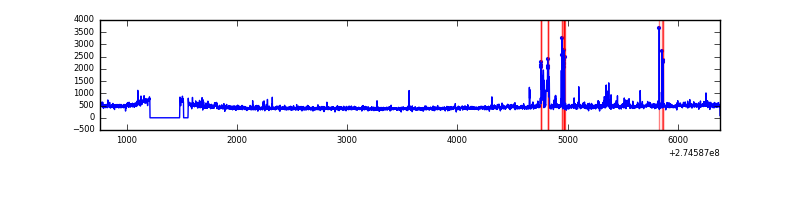 |
Top three noisy pixels from each quadrant. If the there are fewer than three noisy pixels in the level2.evt file, extra rows are filled as -1
| Pixel properties | Quadrant properties | ||||||
|---|---|---|---|---|---|---|---|
| Quadrant | DetID | PixID | Counts | Sigma | Mean | Median | Sigma |
| A | 13 | 210 | 17935 | 137.42 | 608 | 596 | 126.2 |
| A | 15 | 157 | 12957 | 97.97 | 608 | 596 | 126.2 |
| A | 12 | 96 | 11385 | 85.51 | 608 | 596 | 126.2 |
| B | 4 | 173 | 35949 | 303.55 | 610 | 594 | 116.5 |
| B | 0 | 190 | 23463 | 196.34 | 610 | 594 | 116.5 |
| B | 0 | 245 | 16653 | 137.88 | 610 | 594 | 116.5 |
| C | 14 | 238 | 89239 | 647.69 | 583 | 585 | 136.9 |
| C | 3 | 233 | 44503 | 320.86 | 583 | 585 | 136.9 |
| C | 8 | 128 | 9340 | 63.96 | 583 | 585 | 136.9 |
| D | 10 | 70 | 104621 | 720.84 | 590 | 574 | 144.3 |
| D | 2 | 152 | 89754 | 617.84 | 590 | 574 | 144.3 |
| D | 2 | 16 | 24105 | 163.02 | 590 | 574 | 144.3 |
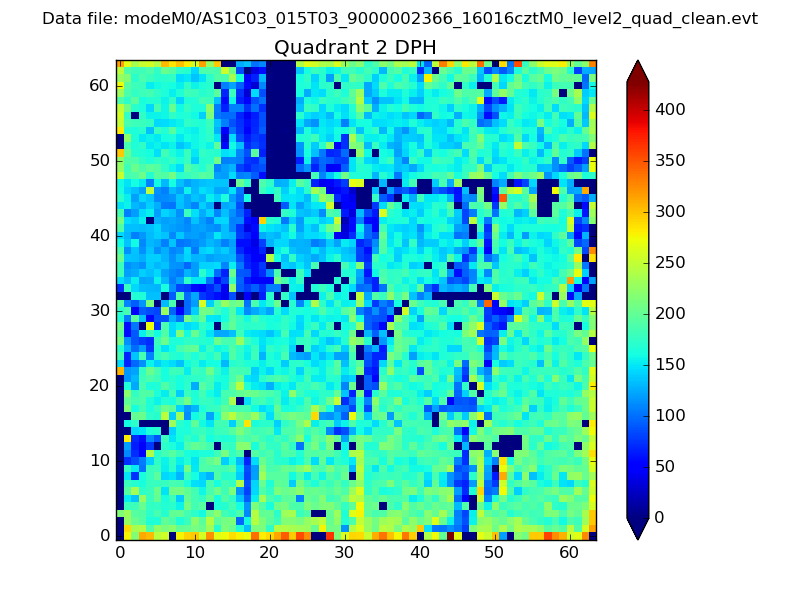
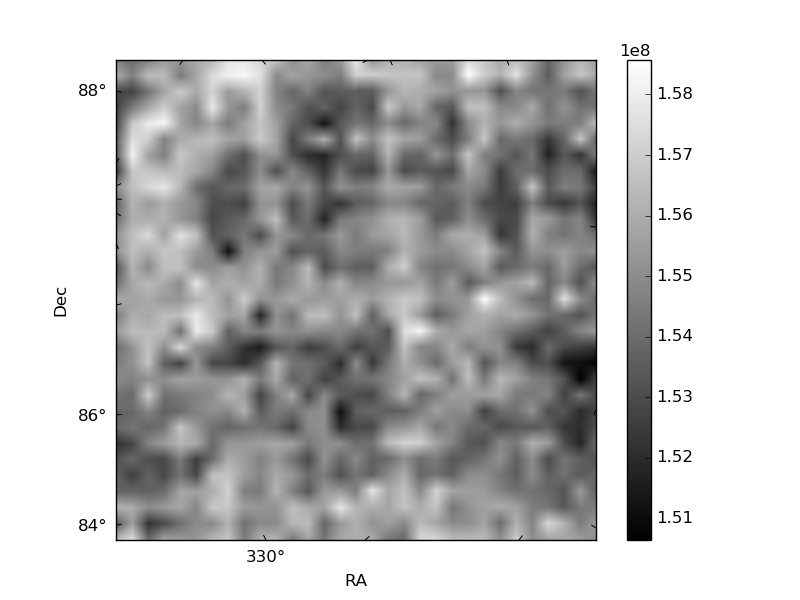
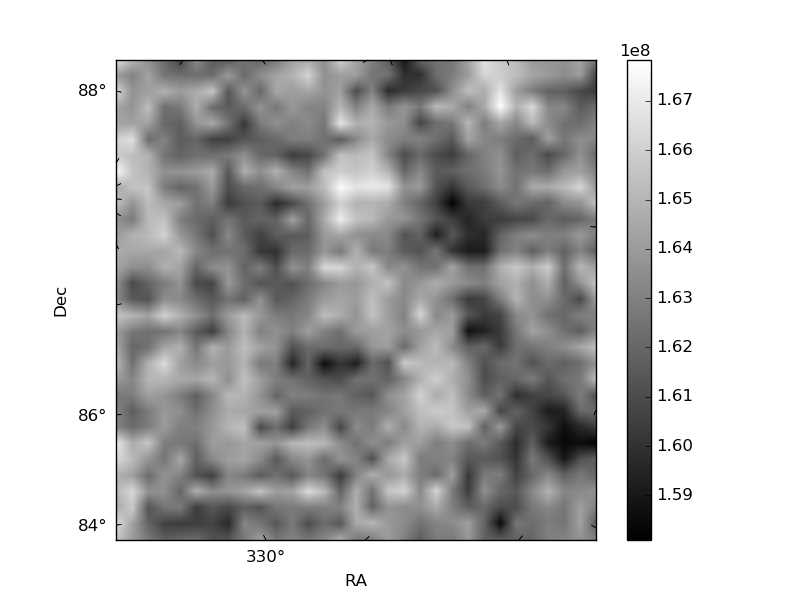
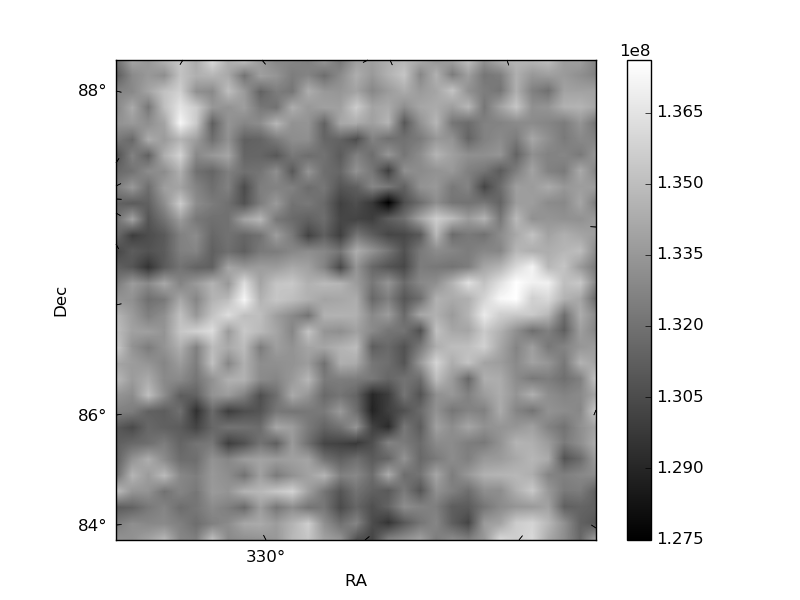
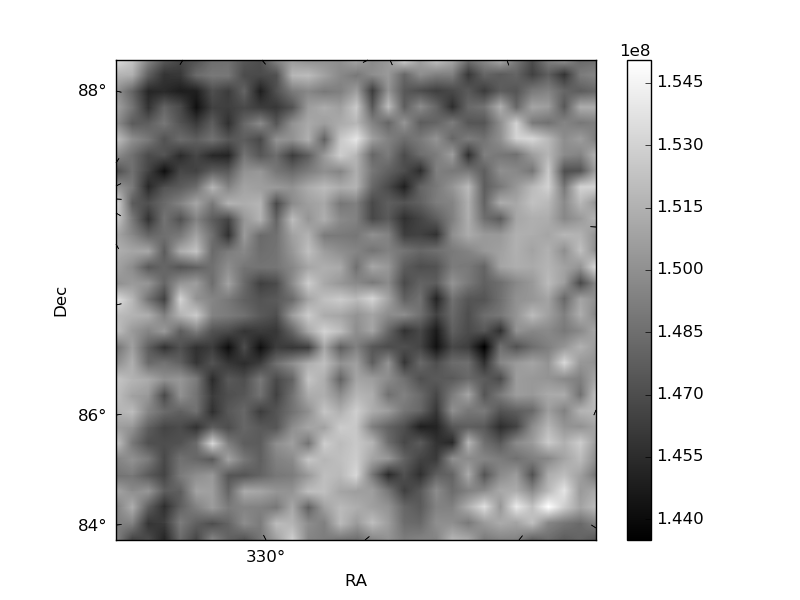
Histogram calculated using DETX and DETY for each event in the final _common_clean file
| Quadrant A | 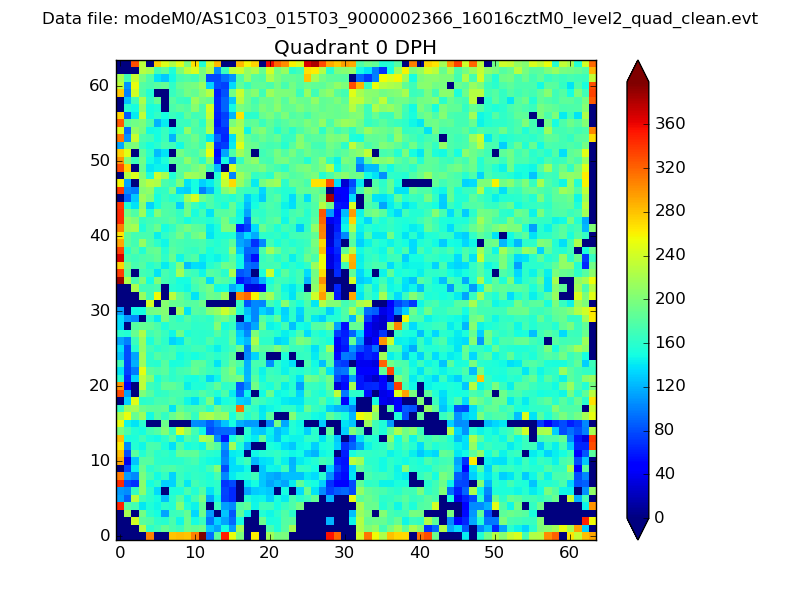 |
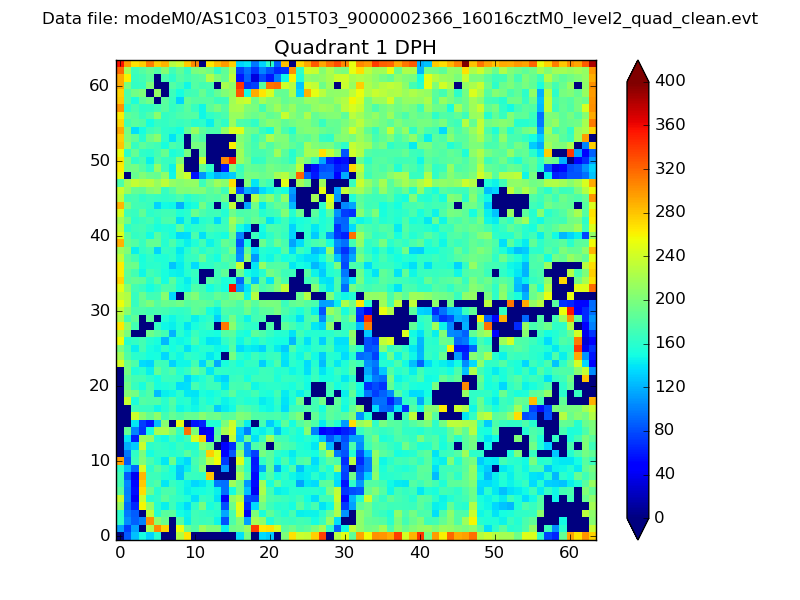 |
Quadrant B |
|---|---|---|---|
| Quadrant D | 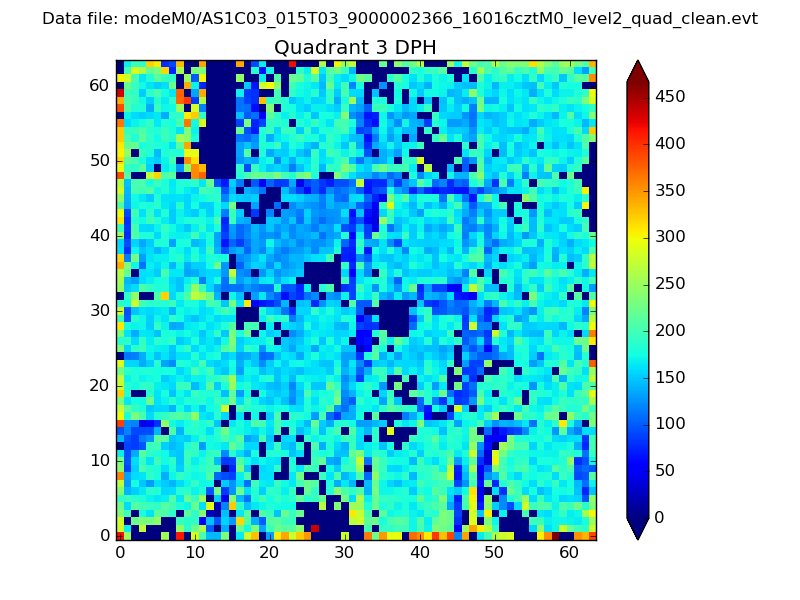 |
 |
Quadrant C |
| Plot type | Count rate plots | Images |
|---|---|---|
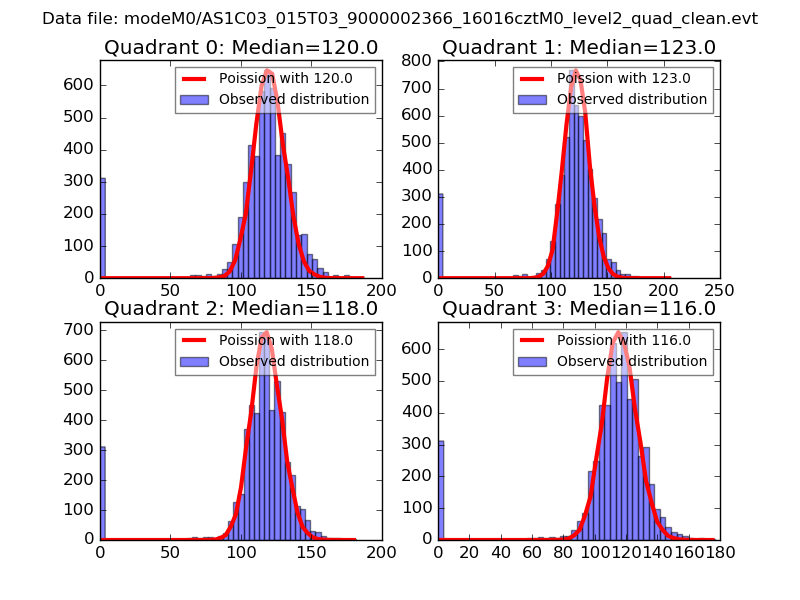
| Comparison with Poisson distribution Blue bars denote a histogram of data divided into 1 sec bins. Red curve is a Poisson curve with rate = median count rate of data. |
 |
 |
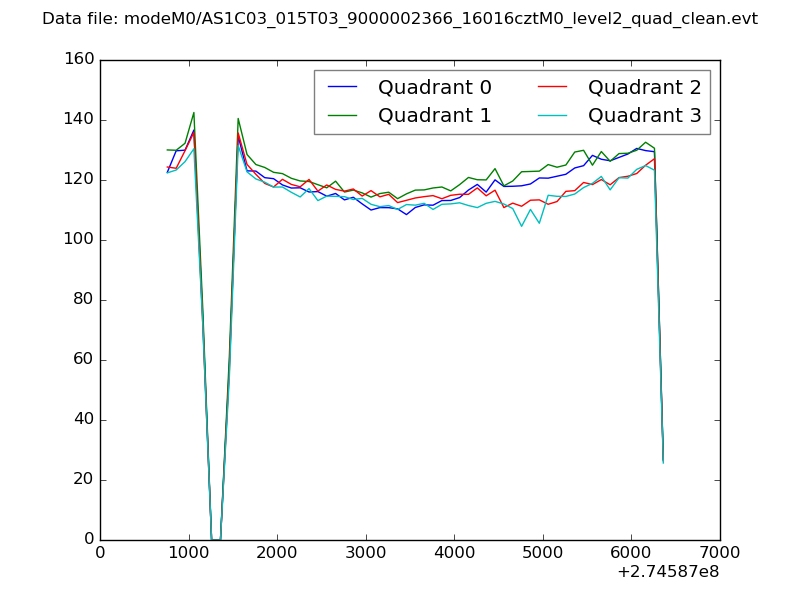
| Quadrant-wise count rates Data is divided into 100 sec bins |
 |
|
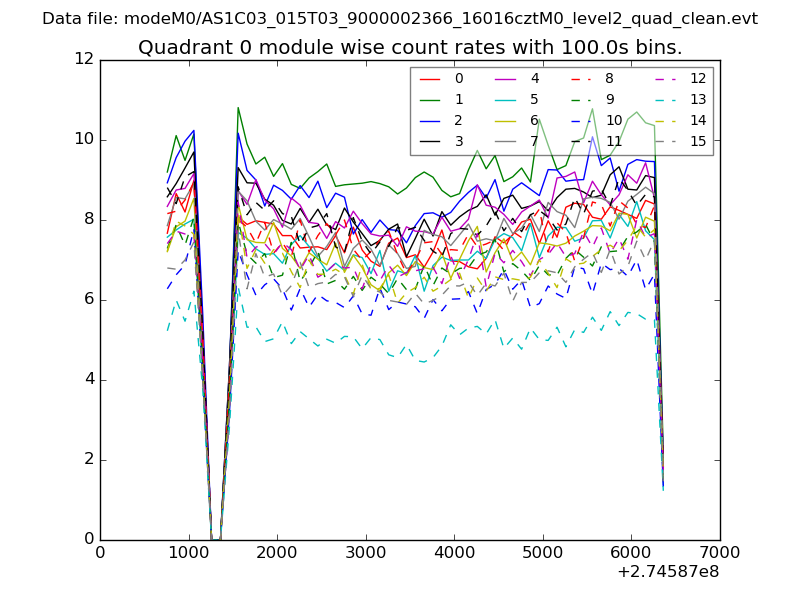
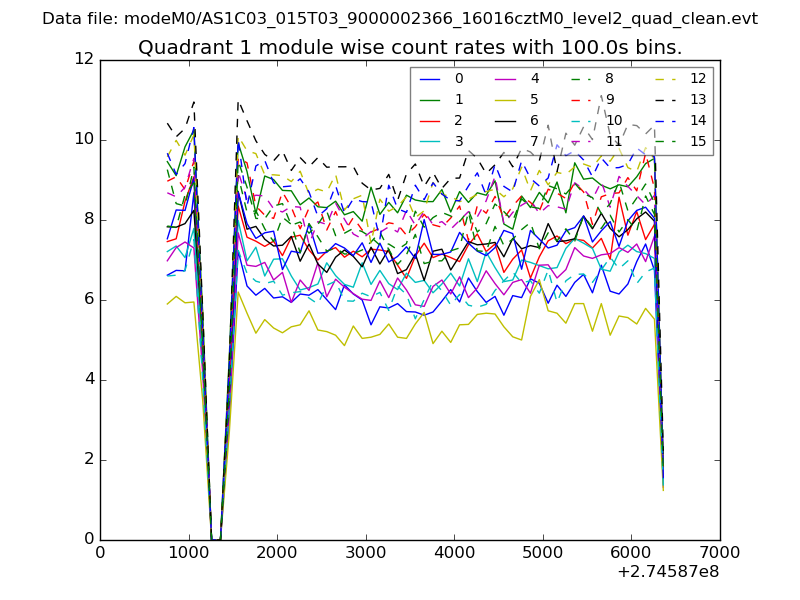
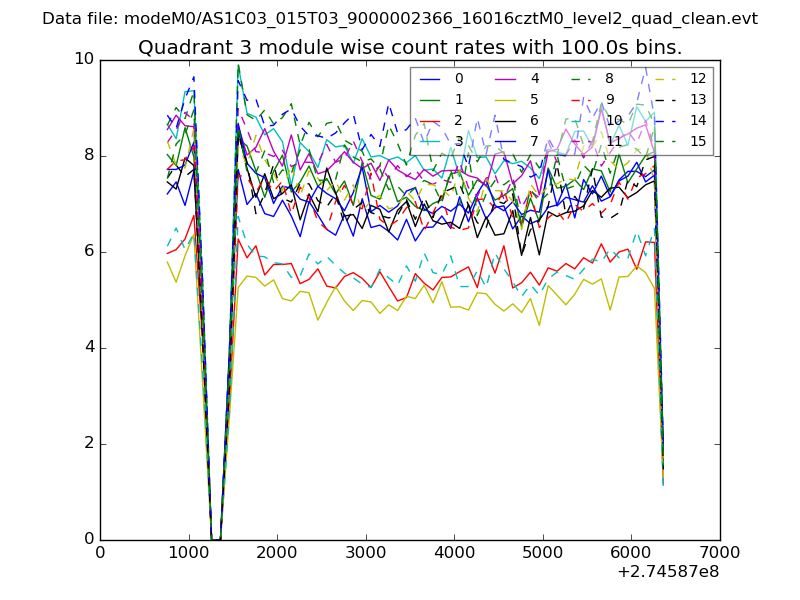
| Module-wise count rates for Quadrant A Data is divided into 100 sec bins |
 |
 |
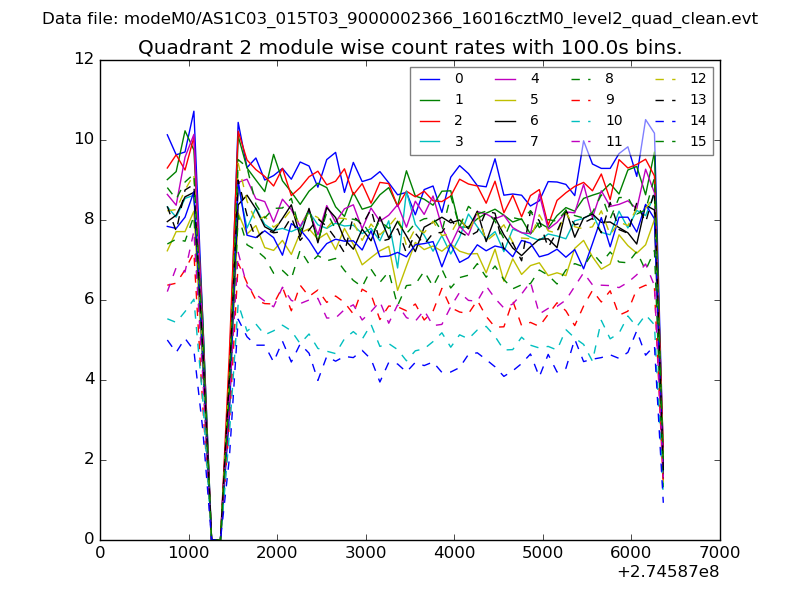
| Module-wise count rates for Quadrant B Data is divided into 100 sec bins |
 |
 |
| Module-wise count rates for Quadrant C Data is divided into 100 sec bins |
 |
 |
| Module-wise count rates for Quadrant D Data is divided into 100 sec bins |
 |
 |
| Parameter | Plot |
|---|---|
| CZT HV Monitor | 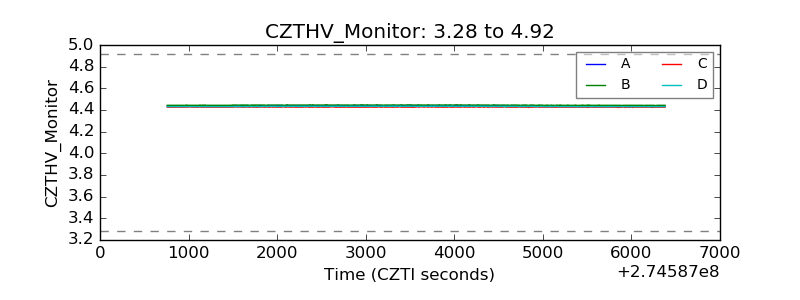 |
| D_VDD | 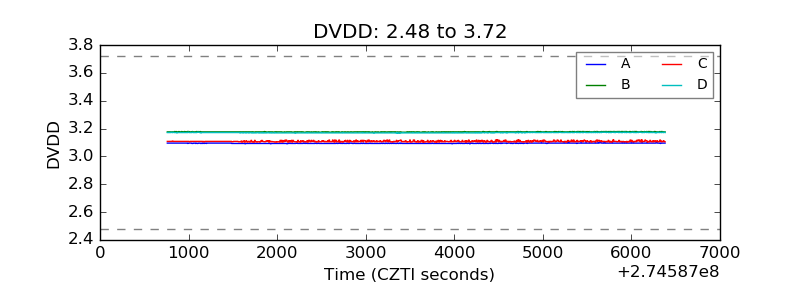 |
| Temperature 1 | 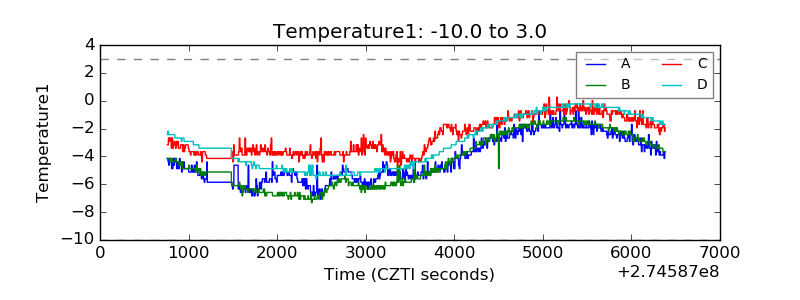 |
| Veto HV Monitor | 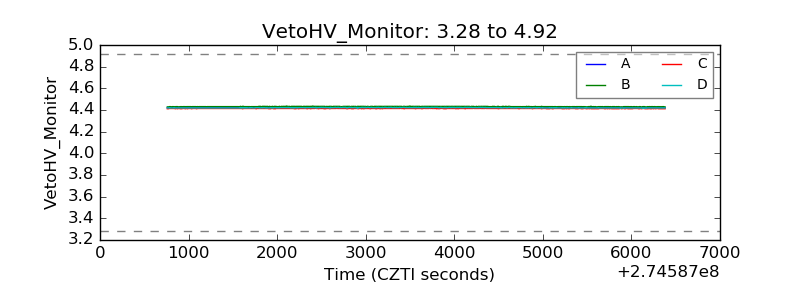 |
| Veto LLD | 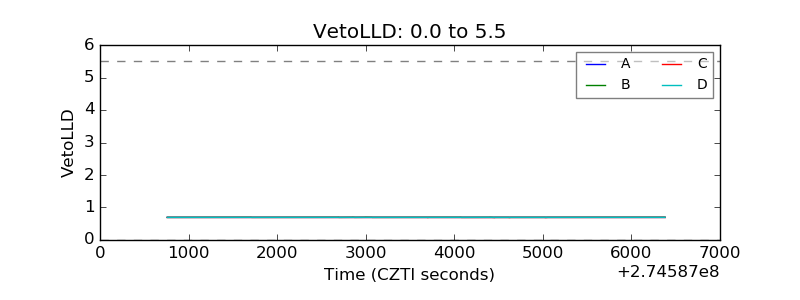 |
| Alpha Counter | 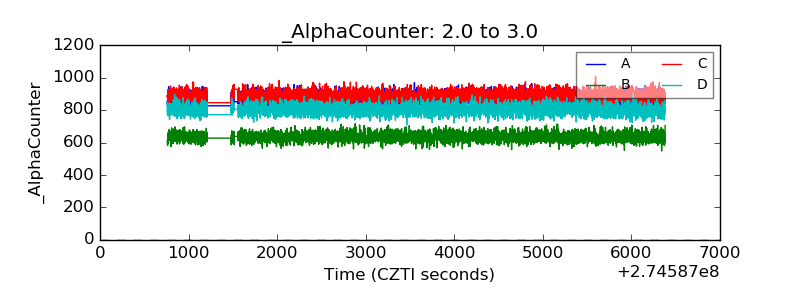 |
| _CPM_Rate | 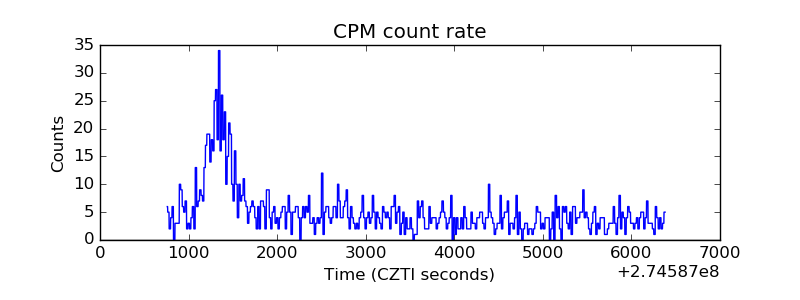 |
| CZT Counter | 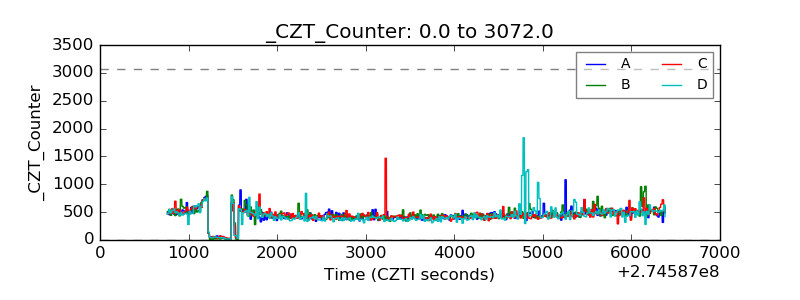 |
| +2.5 Volts monitor |  |
| +5 Volts monitor |  |
| _ROLL_ROT | 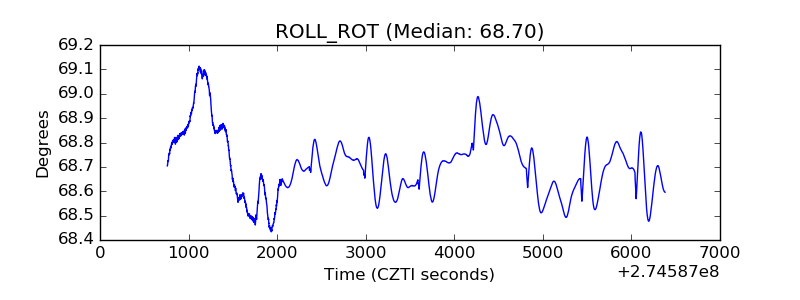 |
| _Roll_DEC | 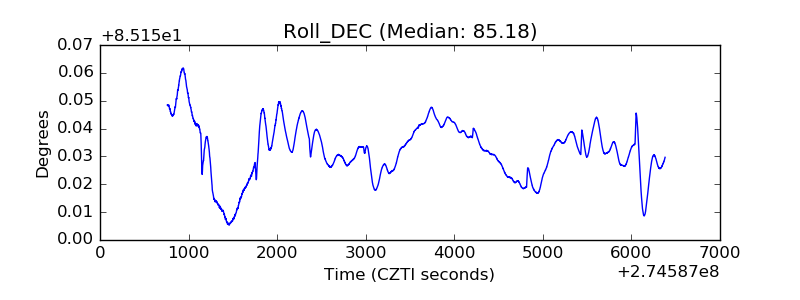 |
| _Roll_RA | 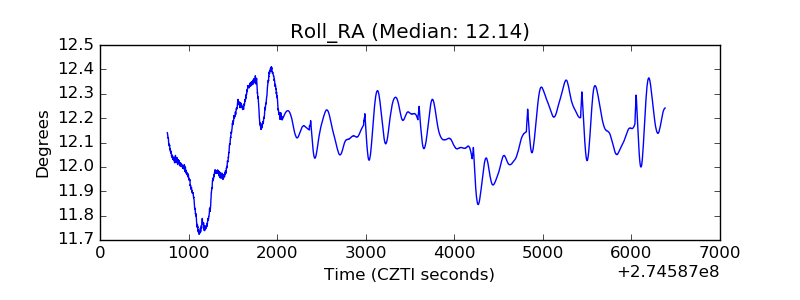 |
| Veto Counter | 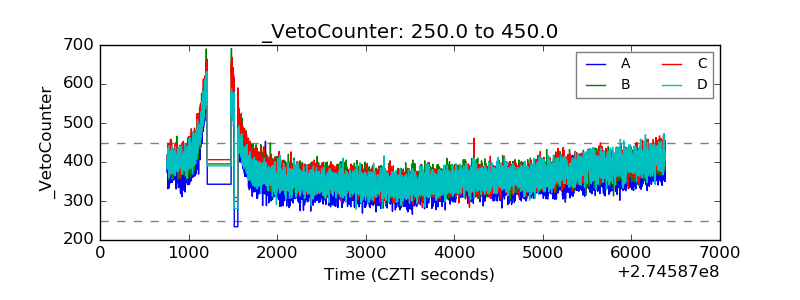 |