| Param | Original file | Final file |
|---|---|---|
| Filename | modeM0/AS1G08_046T09_9000002362cztM0_level2.fits | modeM0/AS1G08_046T09_9000002362cztM0_level2_quad_clean.evt |
| Size (bytes) | 242,870,400 | 270,544,320 |
| Size | 231.6 MB | 258.0 MB |
| Events in quadrant A | 1,438,742 | 1,635,347 |
| Events in quadrant B | 1,402,890 | 1,679,173 |
| Events in quadrant C | 1,434,398 | 1,596,935 |
| Events in quadrant D | 1,240,932 | 1,444,103 |
| Mode M9 | |||
|---|---|---|---|
| Quadrant | BADHDUFLAG | Total packets | Discarded packets |
| A | 0 | 22 | 0 |
| B | 0 | 22 | 0 |
| C | 0 | 22 | 0 |
| D | 0 | 22 | 0 |
| Mode M0 | |||
|---|---|---|---|
| Quadrant | BADHDUFLAG | Total packets | Discarded packets |
| A | 0 | 64647 | 0 |
| B | 0 | 57000 | 0 |
| C | 0 | 54954 | 0 |
| D | 0 | 72668 | 0 |
| Mode SS | |||
|---|---|---|---|
| Quadrant | BADHDUFLAG | Total packets | Discarded packets |
| A | 0 | 544 | 0 |
| B | 0 | 544 | 0 |
| C | 0 | 544 | 0 |
| D | 0 | 544 | 0 |
| Quadrant | Total seconds | Saturated seconds | Saturation percentage |
|---|---|---|---|
| A | 26722 | 959 | 3.588803% |
| B | 26722 | 448 | 1.676521% |
| C | 26722 | 424 | 1.586708% |
| D | 26722 | 1287 | 4.816256% |
Noise dominated data is calculated using 1-second bins in cleaned event files. If a bin has >2000 counts, and if more than 50% of those come from <1% of pixels, then it is considered to be noise-dominated and hence unusable.
| Quadrant | # 1 sec bins | Bins with >0 counts | Bins with >2000 counts | High rate bins dominated by noise | Noise dominated (total time) | Noise dominated (detector-on time) | Marked lightcurve |
|---|---|---|---|---|---|---|---|
| A | 28917 | 26718 | 0 | 0 | 0.00% | 0.00% |  |
| B | 28917 | 26717 | 0 | 0 | 0.00% | 0.00% | 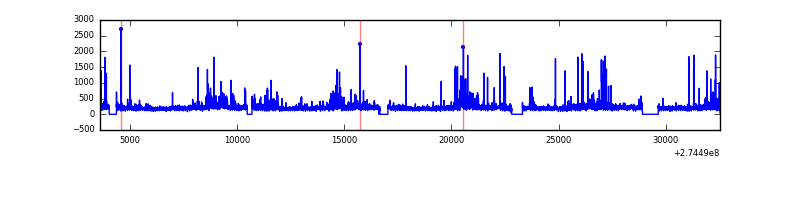 |
| C | 28917 | 26716 | 0 | 0 | 0.00% | 0.00% |  |
| D | 28917 | 26715 | 0 | 0 | 0.00% | 0.00% |  |
Top three noisy pixels from each quadrant. If the there are fewer than three noisy pixels in the level2.evt file, extra rows are filled as -1
| Pixel properties | Quadrant properties | ||||||
|---|---|---|---|---|---|---|---|
| Quadrant | DetID | PixID | Counts | Sigma | Mean | Median | Sigma |
| A | 0 | 29 | 1418 | 11.12 | 374 | 349 | 96.1 |
| A | 7 | 110 | 1130 | 8.13 | 374 | 349 | 96.1 |
| A | 15 | 236 | 1118 | 8.0 | 374 | 349 | 96.1 |
| B | 2 | 9 | 1161 | 10.92 | 370 | 354 | 73.9 |
| B | 2 | 8 | 1031 | 9.16 | 370 | 354 | 73.9 |
| B | 5 | 225 | 949 | 8.05 | 370 | 354 | 73.9 |
| C | 12 | 241 | 1053 | 7.06 | 379 | 353 | 99.1 |
| C | 3 | 158 | 1008 | 6.61 | 379 | 353 | 99.1 |
| C | 3 | 126 | 954 | 6.06 | 379 | 353 | 99.1 |
| D | 6 | 231 | 932 | 6.42 | 353 | 320 | 95.3 |
| D | 3 | 14 | 896 | 6.04 | 353 | 320 | 95.3 |
| D | 10 | 189 | 886 | 5.93 | 353 | 320 | 95.3 |
Histogram calculated using DETX and DETY for each event in the final _common_clean file
| Quadrant A | 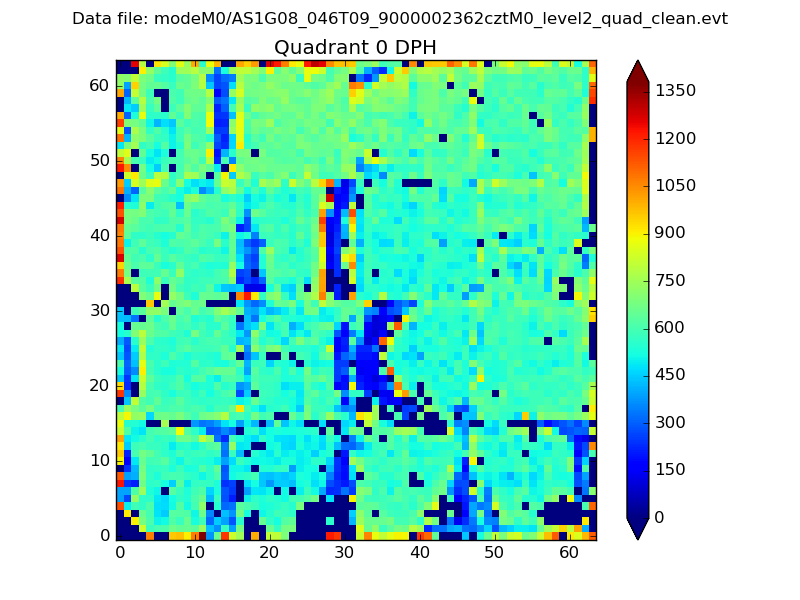 |
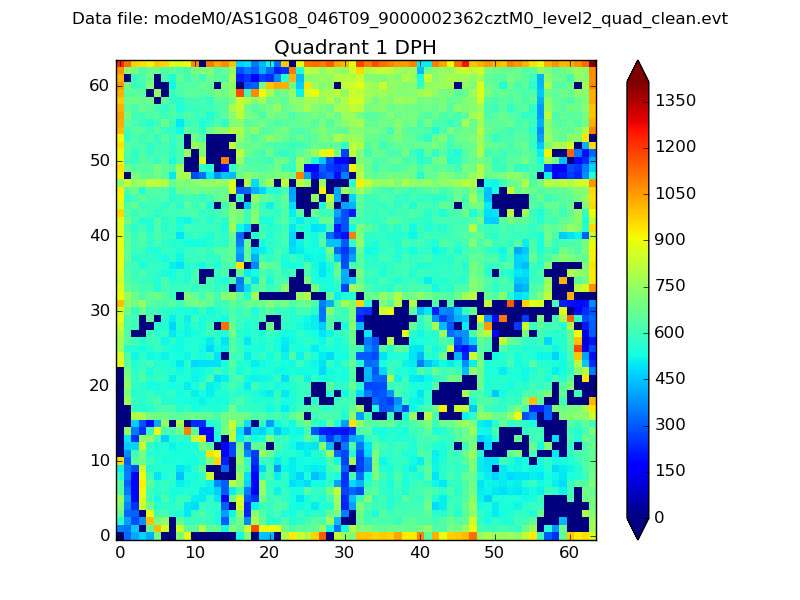 |
Quadrant B |
|---|---|---|---|
| Quadrant D | 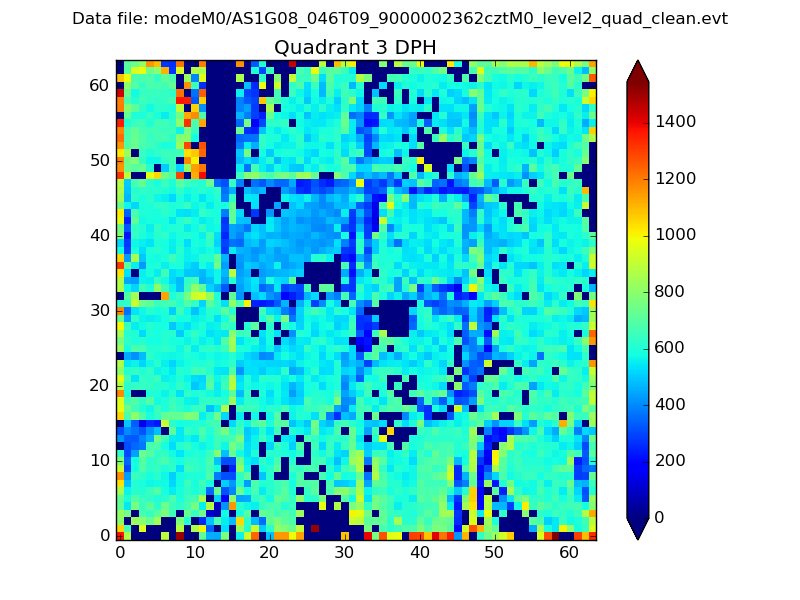 |
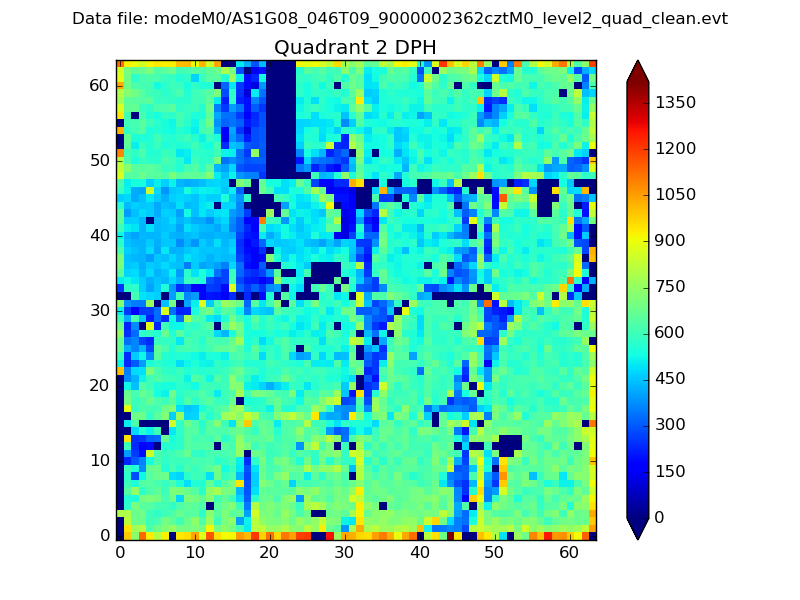 |
Quadrant C |
| Plot type | Count rate plots | Images |
|---|---|---|
| Comparison with Poisson distribution Blue bars denote a histogram of data divided into 1 sec bins. Red curve is a Poisson curve with rate = median count rate of data. |
 |
 |
| Quadrant-wise count rates Data is divided into 100 sec bins |
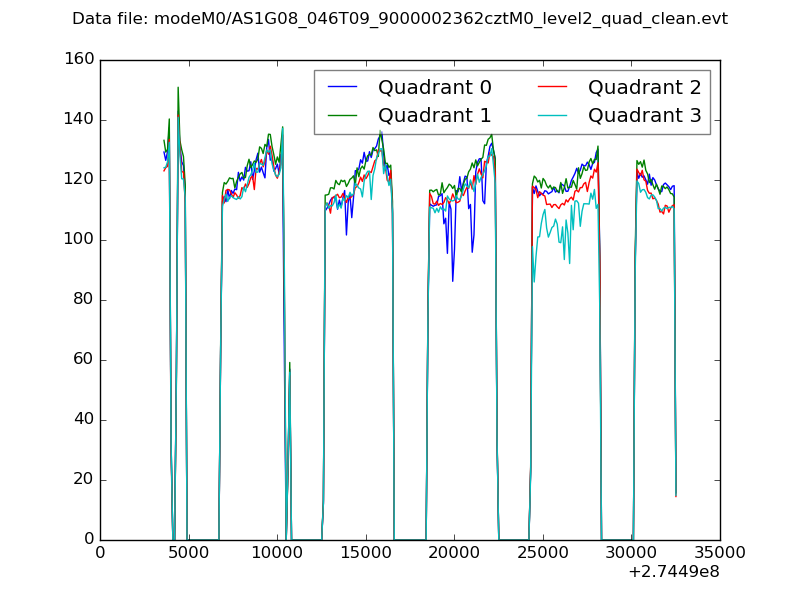 |
|
| Module-wise count rates for Quadrant A Data is divided into 100 sec bins |
 |
 |
| Module-wise count rates for Quadrant B Data is divided into 100 sec bins |
 |
 |
| Module-wise count rates for Quadrant C Data is divided into 100 sec bins |
 |
 |
| Module-wise count rates for Quadrant D Data is divided into 100 sec bins |
 |
 |
| Parameter | Plot |
|---|---|
| CZT HV Monitor |  |
| D_VDD |  |
| Temperature 1 |  |
| Veto HV Monitor |  |
| Veto LLD | 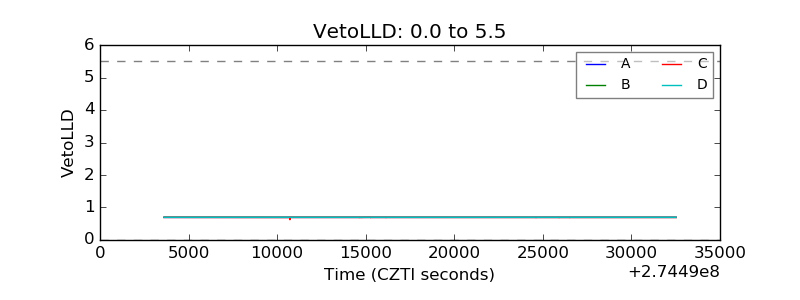 |
| Alpha Counter | 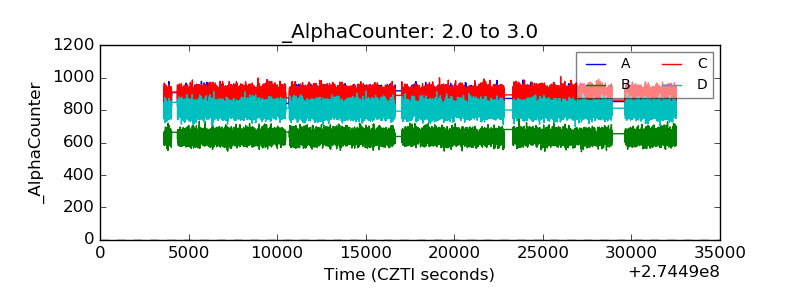 |
| _CPM_Rate |  |
| CZT Counter |  |
| +2.5 Volts monitor |  |
| +5 Volts monitor |  |
| _ROLL_ROT | 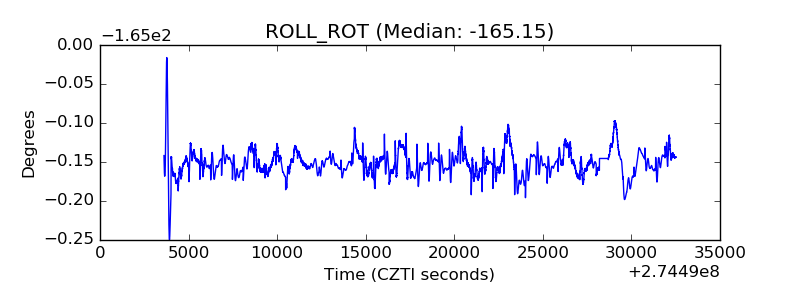 |
| _Roll_DEC | 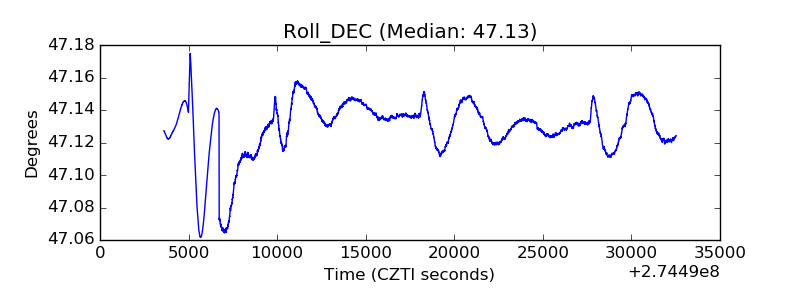 |
| _Roll_RA | 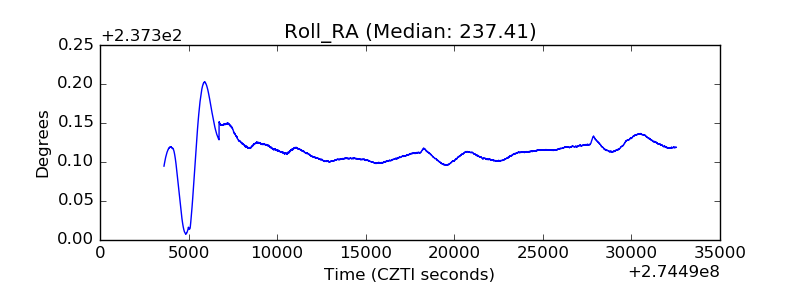 |
| Veto Counter |  |