| Param | Original file | Final file |
|---|---|---|
| Filename | modeM0/AS1G08_046T09_9000002362_15998cztM0_level2.evt | modeM0/AS1G08_046T09_9000002362_15998cztM0_level2_quad_clean.evt |
| Size (bytes) | 142,061,760 | 21,441,600 |
| Size | 135.5 MB | 20.4 MB |
| Events in quadrant A | 998,839 | 125,830 |
| Events in quadrant B | 1,079,802 | 128,640 |
| Events in quadrant C | 1,053,209 | 122,183 |
| Events in quadrant D | 1,027,919 | 122,643 |
| Mode M9 | |||
|---|---|---|---|
| Quadrant | BADHDUFLAG | Total packets | Discarded packets |
| A | 0 | 3 | 0 |
| B | 0 | 3 | 0 |
| C | 0 | 3 | 0 |
| D | 0 | 3 | 0 |
| Mode M0 | |||
|---|---|---|---|
| Quadrant | BADHDUFLAG | Total packets | Discarded packets |
| A | 0 | 4365 | 2 |
| B | 0 | 4538 | 1 |
| C | 0 | 4475 | 1 |
| D | 0 | 4507 | 1 |
| Mode SS | |||
|---|---|---|---|
| Quadrant | BADHDUFLAG | Total packets | Discarded packets |
| A | 0 | 44 | 0 |
| B | 0 | 44 | 0 |
| C | 0 | 44 | 0 |
| D | 0 | 44 | 0 |
| Quadrant | Total seconds | Saturated seconds | Saturation percentage |
|---|---|---|---|
| A | 2054 | 29 | 1.411879% |
| B | 2054 | 71 | 3.456670% |
| C | 2054 | 59 | 2.872444% |
| D | 2054 | 12 | 0.584226% |
Noise dominated data is calculated using 1-second bins in cleaned event files. If a bin has >2000 counts, and if more than 50% of those come from <1% of pixels, then it is considered to be noise-dominated and hence unusable.
| Quadrant | # 1 sec bins | Bins with >0 counts | Bins with >2000 counts | High rate bins dominated by noise | Noise dominated (total time) | Noise dominated (detector-on time) | Marked lightcurve |
|---|---|---|---|---|---|---|---|
| A | 2395 | 2056 | 0 | 0 | 0.00% | 0.00% | 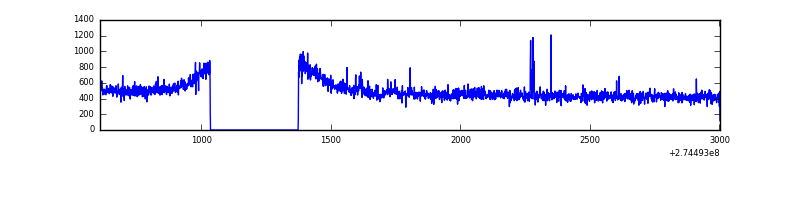 |
| B | 2395 | 2056 | 4 | 4 | 0.17% | 0.19% | 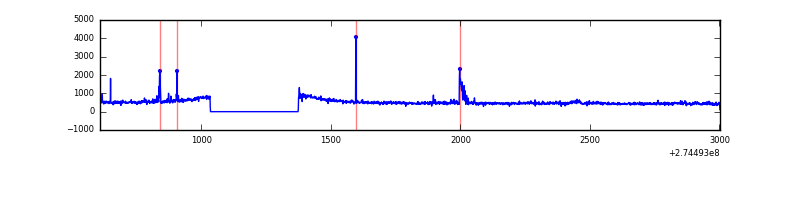 |
| C | 2395 | 2055 | 2 | 2 | 0.08% | 0.10% | 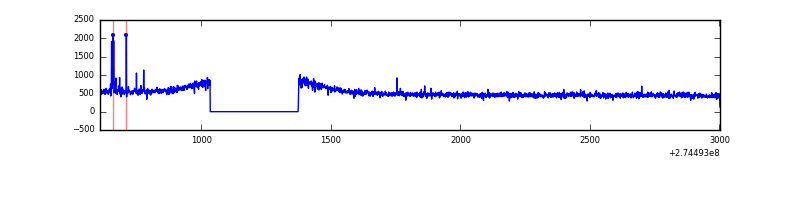 |
| D | 2395 | 2056 | 5 | 5 | 0.21% | 0.24% | 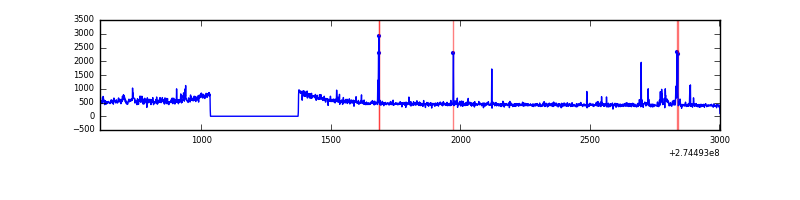 |
Top three noisy pixels from each quadrant. If the there are fewer than three noisy pixels in the level2.evt file, extra rows are filled as -1
| Pixel properties | Quadrant properties | ||||||
|---|---|---|---|---|---|---|---|
| Quadrant | DetID | PixID | Counts | Sigma | Mean | Median | Sigma |
| A | 13 | 210 | 7318 | 130.73 | 254 | 247 | 54.1 |
| A | 15 | 239 | 6834 | 121.79 | 254 | 247 | 54.1 |
| A | 12 | 96 | 5254 | 92.57 | 254 | 247 | 54.1 |
| B | 15 | 222 | 22972 | 444.66 | 257 | 249 | 51.1 |
| B | 10 | 245 | 9789 | 186.69 | 257 | 249 | 51.1 |
| B | 5 | 65 | 9382 | 178.72 | 257 | 249 | 51.1 |
| C | 14 | 238 | 37625 | 617.23 | 250 | 250 | 60.6 |
| C | 3 | 233 | 25055 | 409.64 | 250 | 250 | 60.6 |
| C | 0 | 207 | 13705 | 222.2 | 250 | 250 | 60.6 |
| D | 2 | 152 | 29564 | 465.89 | 250 | 241 | 62.9 |
| D | 4 | 239 | 23041 | 362.25 | 250 | 241 | 62.9 |
| D | 9 | 85 | 19336 | 303.38 | 250 | 241 | 62.9 |
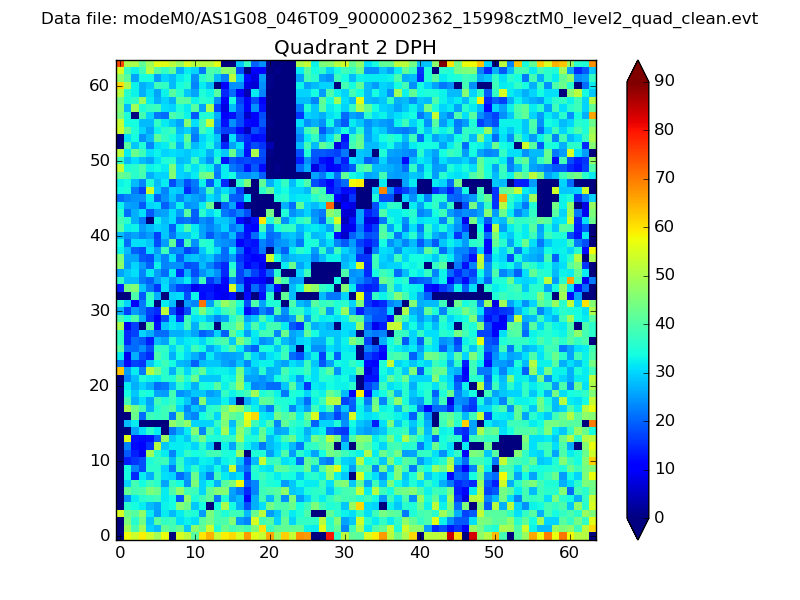
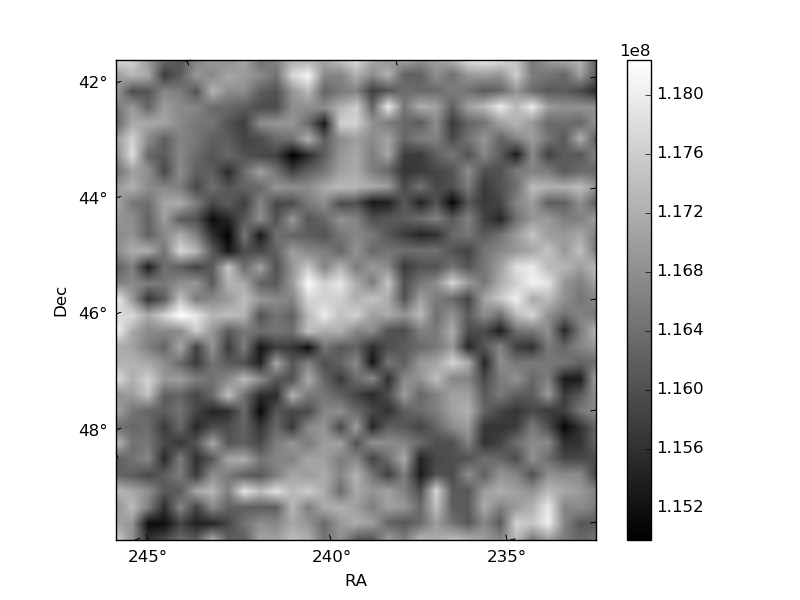
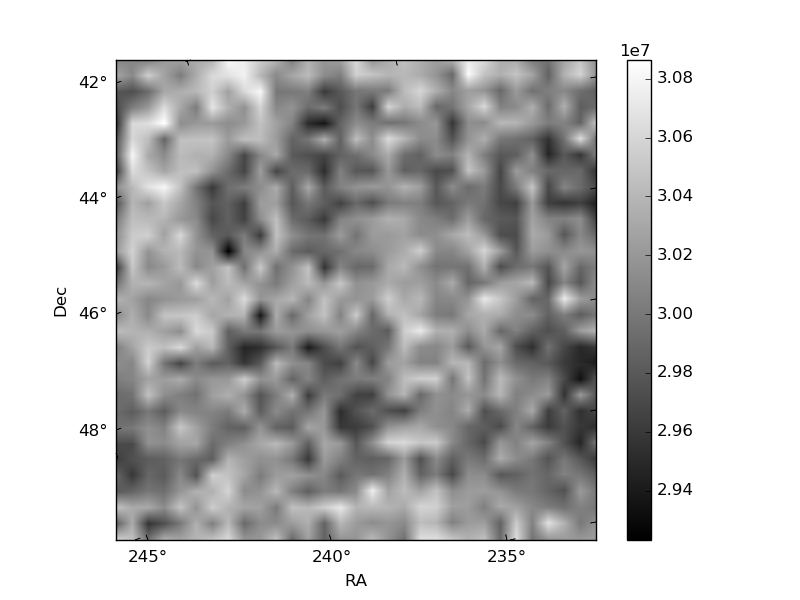
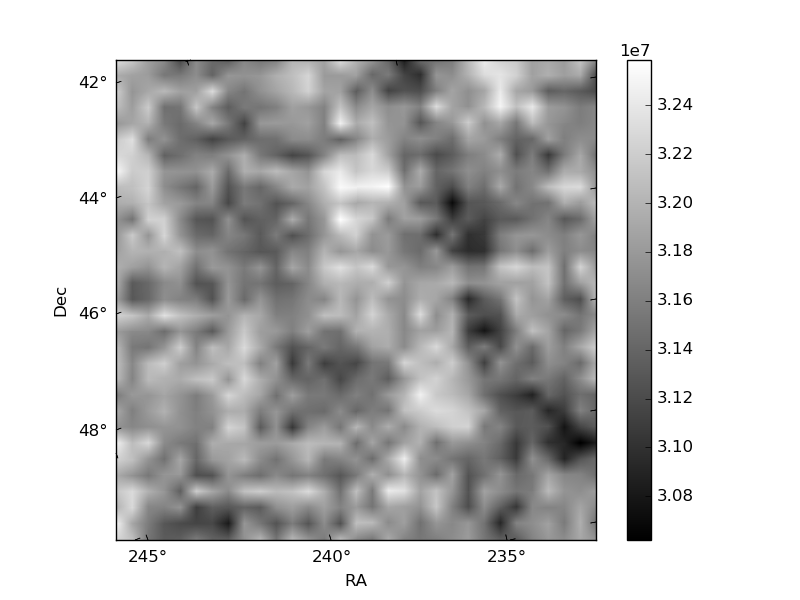
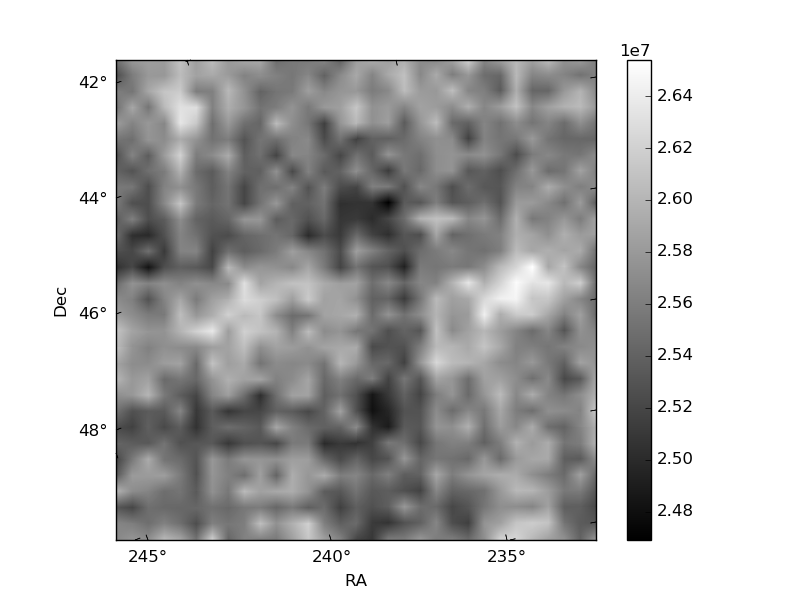
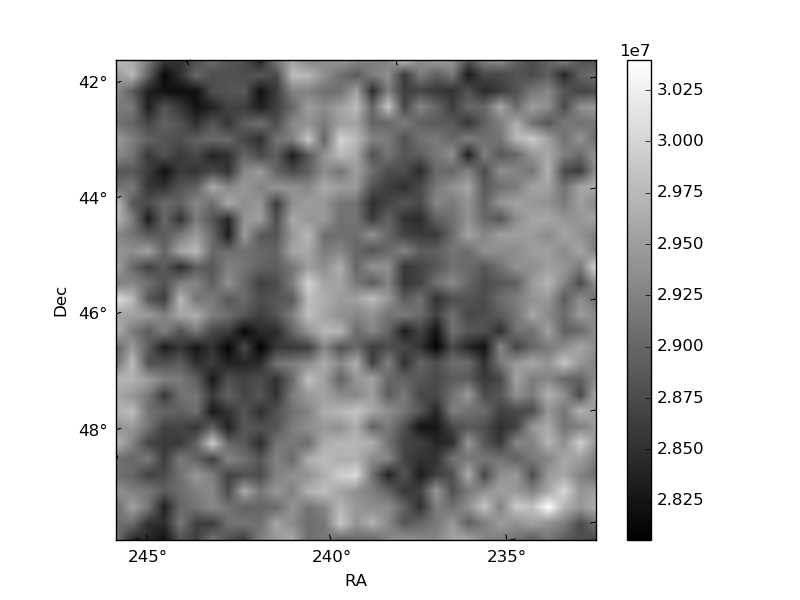
Histogram calculated using DETX and DETY for each event in the final _common_clean file
| Quadrant A | 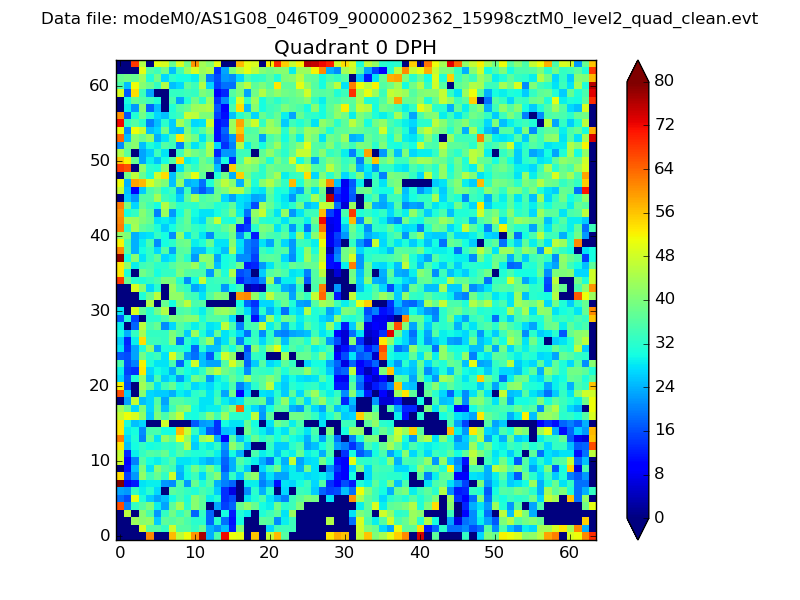 |
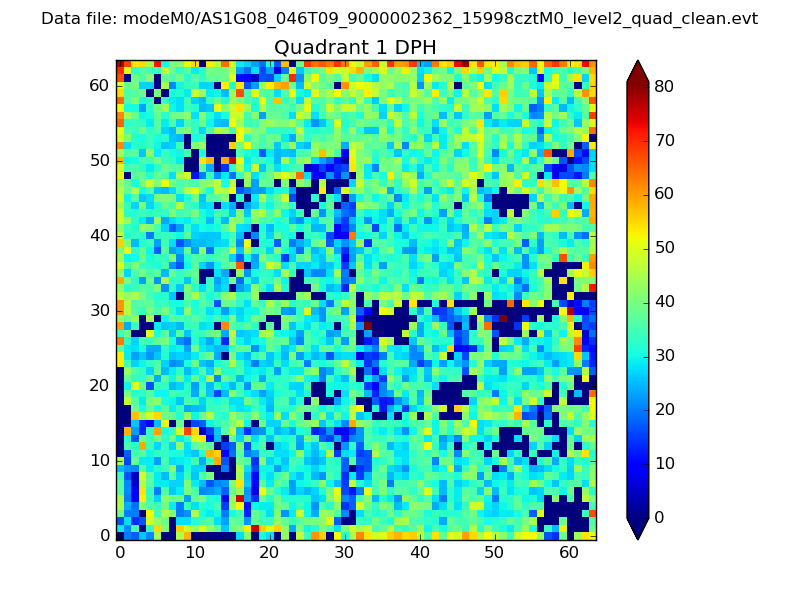 |
Quadrant B |
|---|---|---|---|
| Quadrant D | 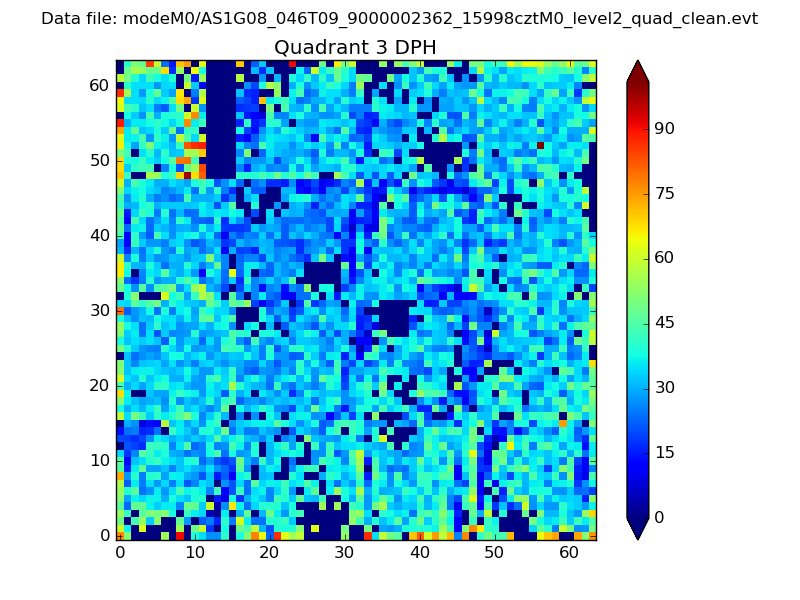 |
 |
Quadrant C |
| Plot type | Count rate plots | Images |
|---|---|---|
| Comparison with Poisson distribution Blue bars denote a histogram of data divided into 1 sec bins. Red curve is a Poisson curve with rate = median count rate of data. |
 |
 |
| Quadrant-wise count rates Data is divided into 100 sec bins |
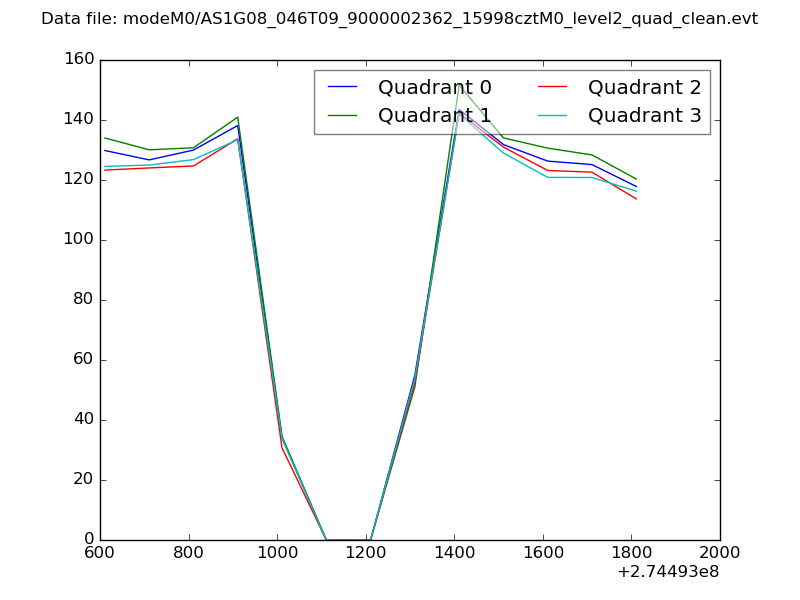 |
|
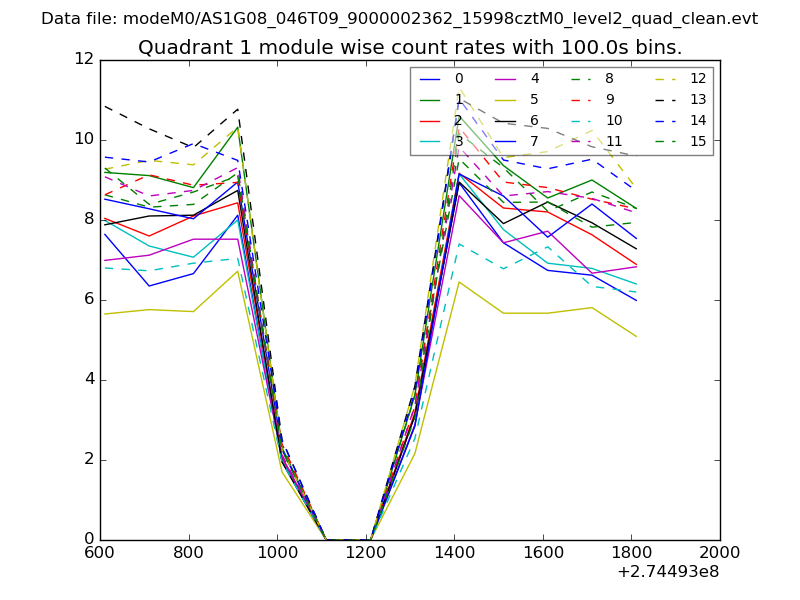
| Module-wise count rates for Quadrant A Data is divided into 100 sec bins |
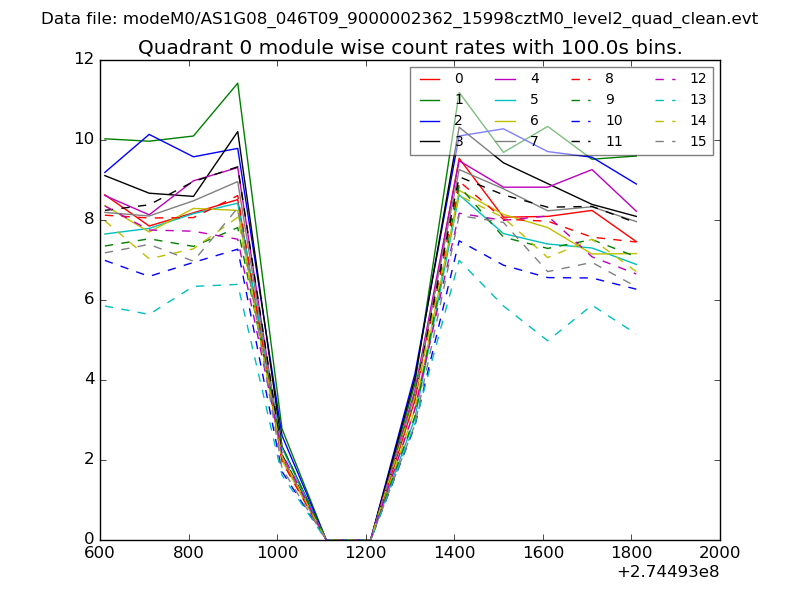 |
 |
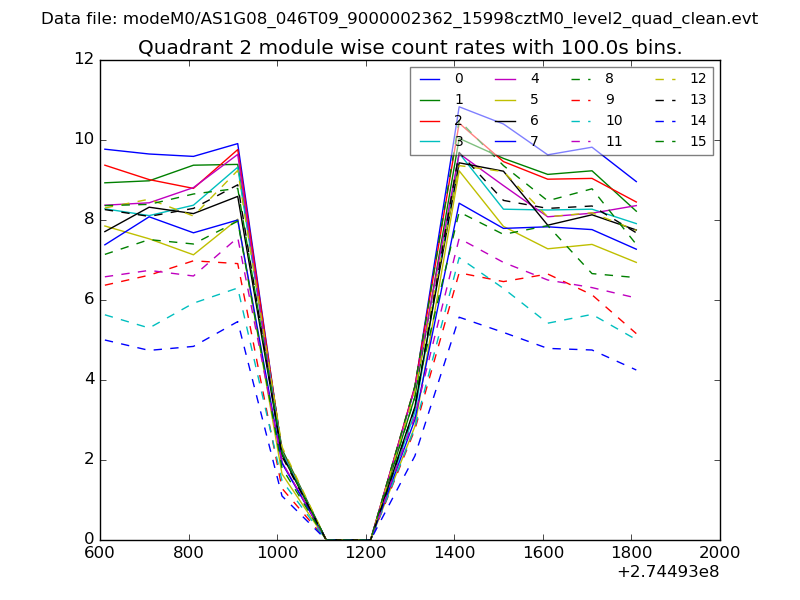
| Module-wise count rates for Quadrant B Data is divided into 100 sec bins |
 |
 |
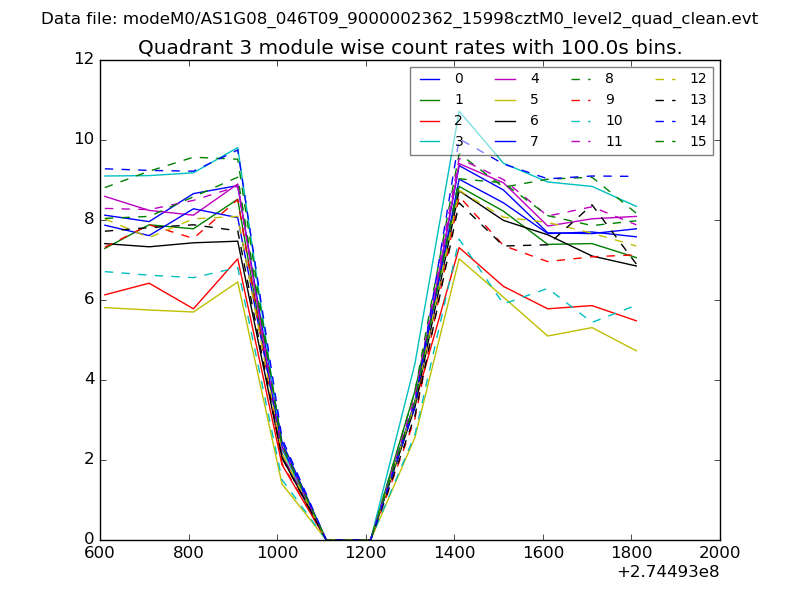
| Module-wise count rates for Quadrant C Data is divided into 100 sec bins |
 |
 |
| Module-wise count rates for Quadrant D Data is divided into 100 sec bins |
 |
 |
| Parameter | Plot |
|---|---|
| CZT HV Monitor | 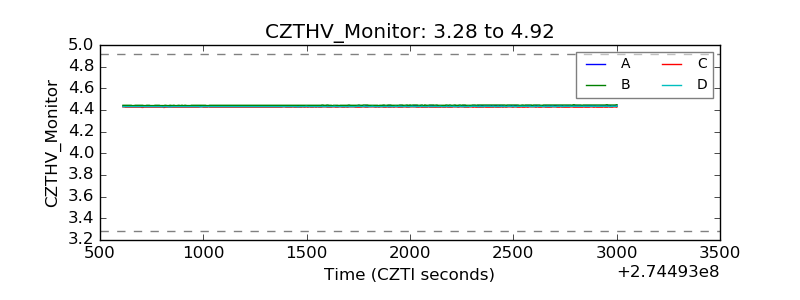 |
| D_VDD | 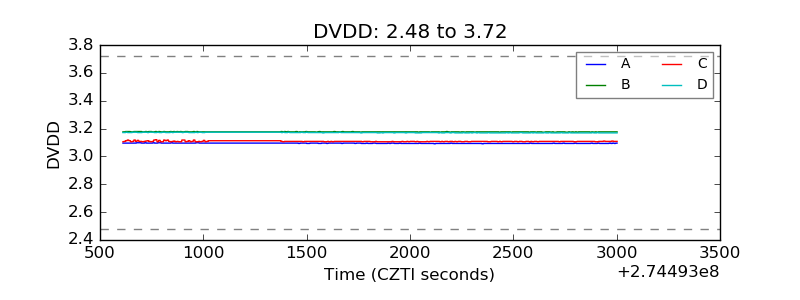 |
| Temperature 1 | 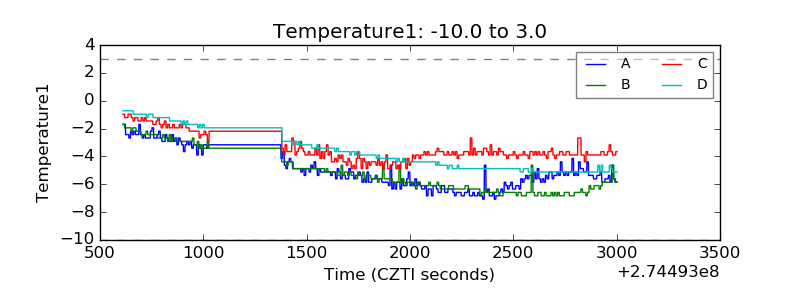 |
| Veto HV Monitor | 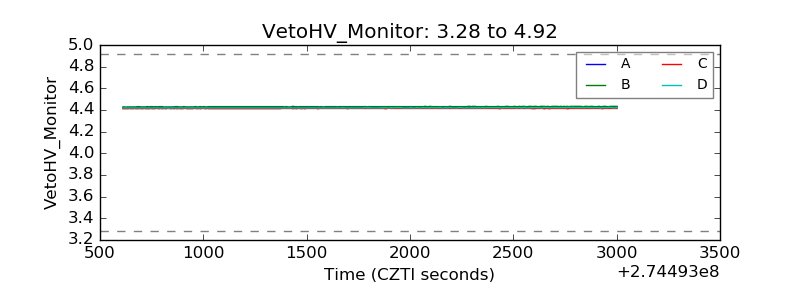 |
| Veto LLD | 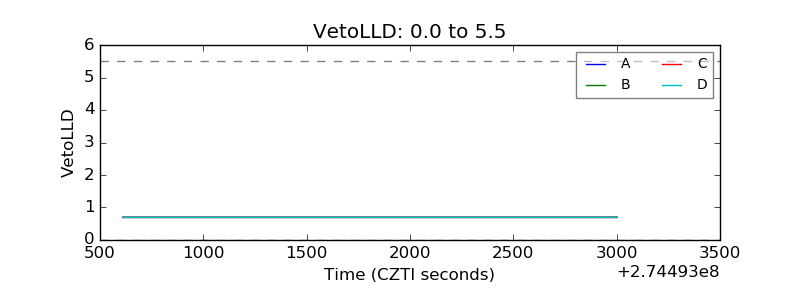 |
| Alpha Counter | 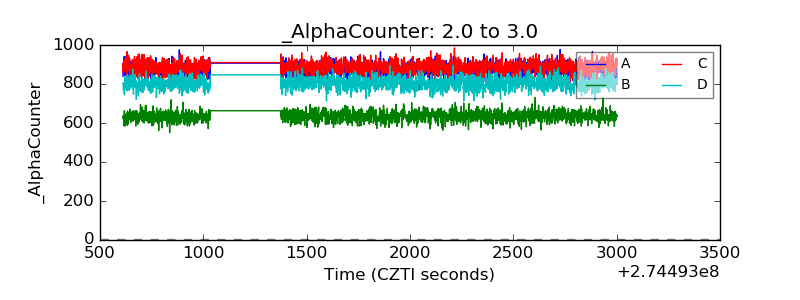 |
| _CPM_Rate | 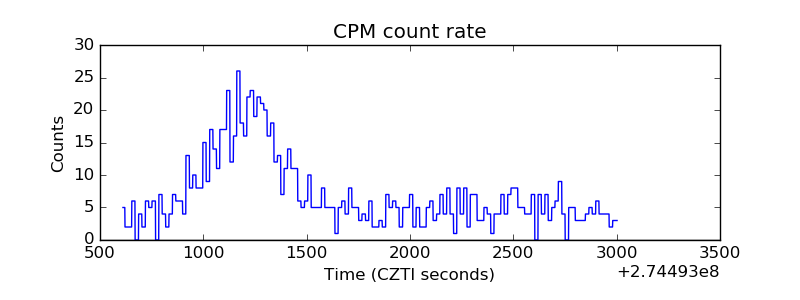 |
| CZT Counter | 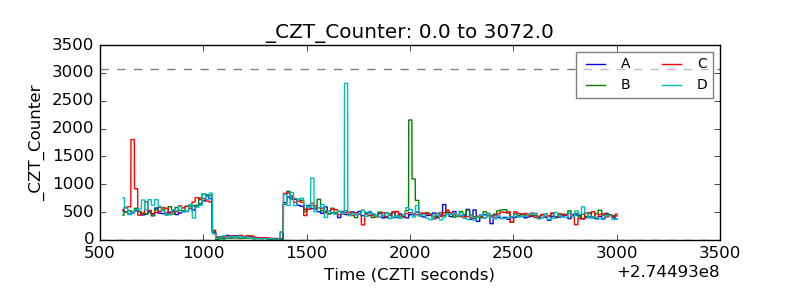 |
| +2.5 Volts monitor |  |
| +5 Volts monitor | 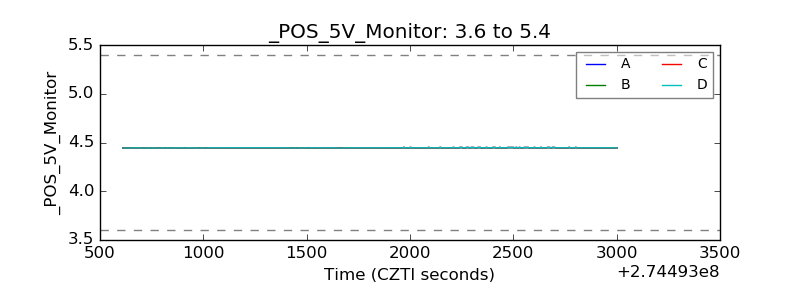 |
| _ROLL_ROT |  |
| _Roll_DEC | 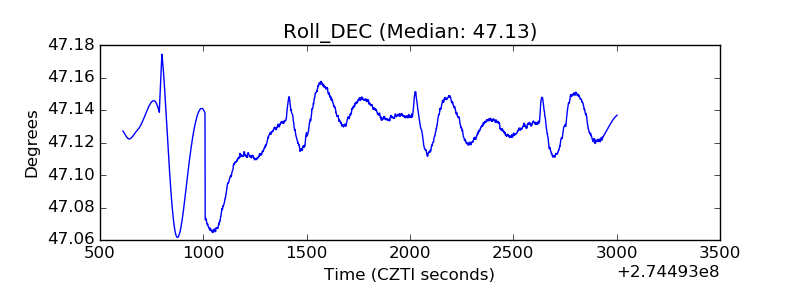 |
| _Roll_RA | 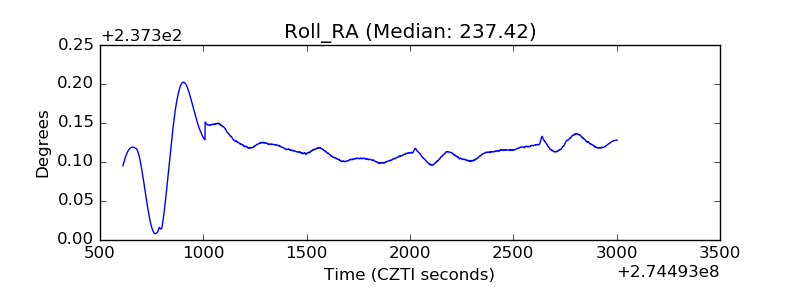 |
| Veto Counter | 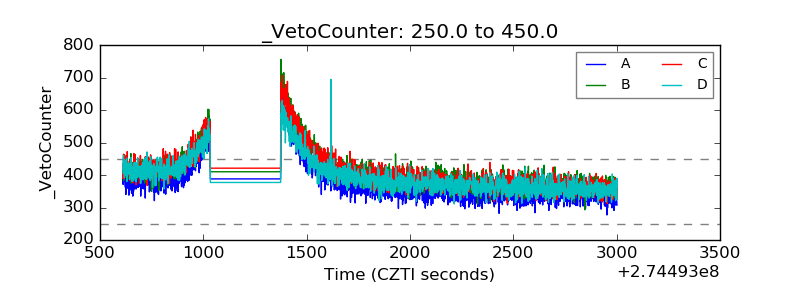 |