| Param | Original file | Final file |
|---|---|---|
| Filename | modeM0/AS1G08_046T09_9000002362_15999cztM0_level2.evt | modeM0/AS1G08_046T09_9000002362_15999cztM0_level2_quad_clean.evt |
| Size (bytes) | 511,312,320 | 82,108,800 |
| Size | 487.6 MB | 78.3 MB |
| Events in quadrant A | 4,382,234 | 490,379 |
| Events in quadrant B | 3,685,517 | 505,848 |
| Events in quadrant C | 3,477,285 | 488,521 |
| Events in quadrant D | 3,440,100 | 489,129 |
| Mode M9 | |||
|---|---|---|---|
| Quadrant | BADHDUFLAG | Total packets | Discarded packets |
| A | 0 | 3 | 0 |
| B | 0 | 3 | 0 |
| C | 0 | 3 | 0 |
| D | 0 | 3 | 0 |
| Mode M0 | |||
|---|---|---|---|
| Quadrant | BADHDUFLAG | Total packets | Discarded packets |
| A | 0 | 18152 | 2 |
| B | 0 | 15786 | 1 |
| C | 0 | 15118 | 1 |
| D | 0 | 15464 | 1 |
| Mode SS | |||
|---|---|---|---|
| Quadrant | BADHDUFLAG | Total packets | Discarded packets |
| A | 0 | 148 | 0 |
| B | 0 | 148 | 0 |
| C | 0 | 148 | 0 |
| D | 0 | 148 | 0 |
| Quadrant | Total seconds | Saturated seconds | Saturation percentage |
|---|---|---|---|
| A | 7366 | 241 | 3.271789% |
| B | 7366 | 140 | 1.900624% |
| C | 7366 | 135 | 1.832745% |
| D | 7366 | 67 | 0.909585% |
Noise dominated data is calculated using 1-second bins in cleaned event files. If a bin has >2000 counts, and if more than 50% of those come from <1% of pixels, then it is considered to be noise-dominated and hence unusable.
| Quadrant | # 1 sec bins | Bins with >0 counts | Bins with >2000 counts | High rate bins dominated by noise | Noise dominated (total time) | Noise dominated (detector-on time) | Marked lightcurve |
|---|---|---|---|---|---|---|---|
| A | 7587 | 7367 | 101 | 101 | 1.33% | 1.37% | 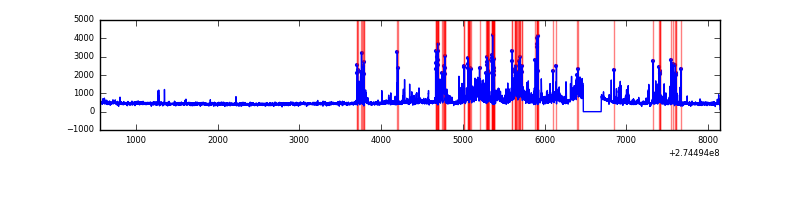 |
| B | 7587 | 7367 | 7 | 7 | 0.09% | 0.10% | 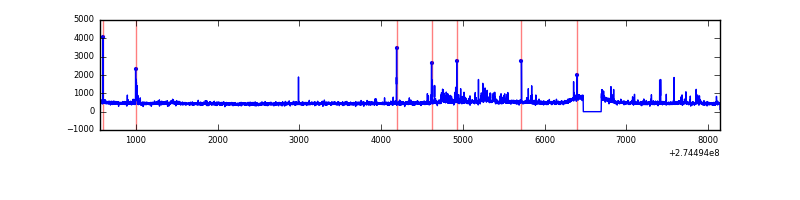 |
| C | 7587 | 7367 | 0 | 0 | 0.00% | 0.00% | 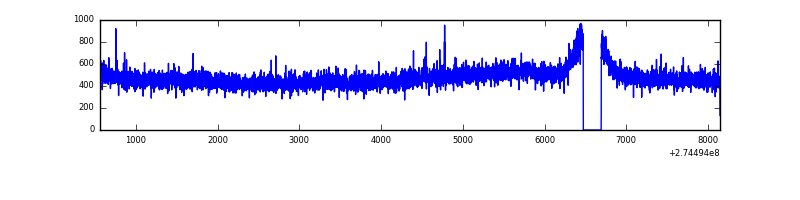 |
| D | 7587 | 7367 | 15 | 15 | 0.20% | 0.20% | 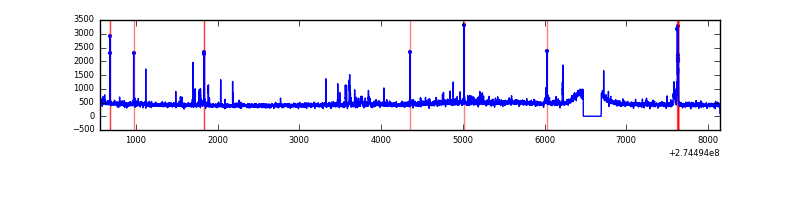 |
Top three noisy pixels from each quadrant. If the there are fewer than three noisy pixels in the level2.evt file, extra rows are filled as -1
| Pixel properties | Quadrant properties | ||||||
|---|---|---|---|---|---|---|---|
| Quadrant | DetID | PixID | Counts | Sigma | Mean | Median | Sigma |
| A | 10 | 253 | 924232 | 5271.36 | 856 | 835 | 175.2 |
| A | 13 | 210 | 84745 | 479.01 | 856 | 835 | 175.2 |
| A | 15 | 157 | 39651 | 221.59 | 856 | 835 | 175.2 |
| B | 7 | 220 | 74994 | 446.16 | 869 | 845 | 166.2 |
| B | 4 | 216 | 49863 | 294.95 | 869 | 845 | 166.2 |
| B | 15 | 222 | 37068 | 217.96 | 869 | 845 | 166.2 |
| C | 14 | 238 | 130734 | 657.68 | 839 | 843 | 197.5 |
| C | 3 | 233 | 67955 | 339.81 | 839 | 843 | 197.5 |
| C | 13 | 61 | 6140 | 26.82 | 839 | 843 | 197.5 |
| D | 9 | 85 | 70620 | 338.33 | 849 | 823 | 206.3 |
| D | 4 | 239 | 55923 | 267.09 | 849 | 823 | 206.3 |
| D | 2 | 152 | 55217 | 263.67 | 849 | 823 | 206.3 |
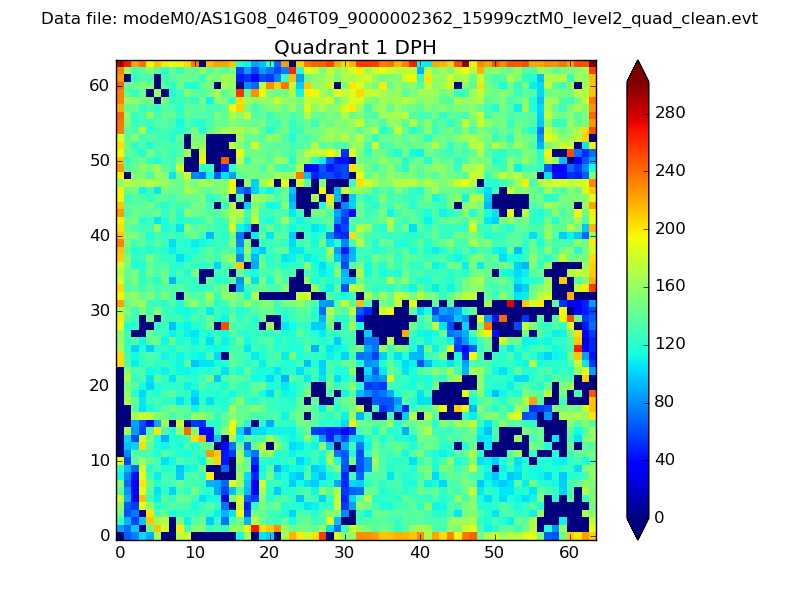
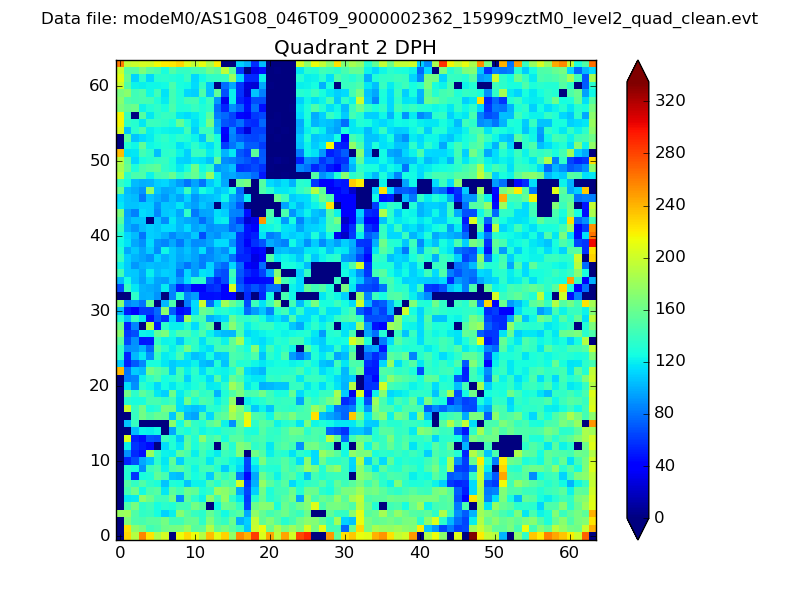
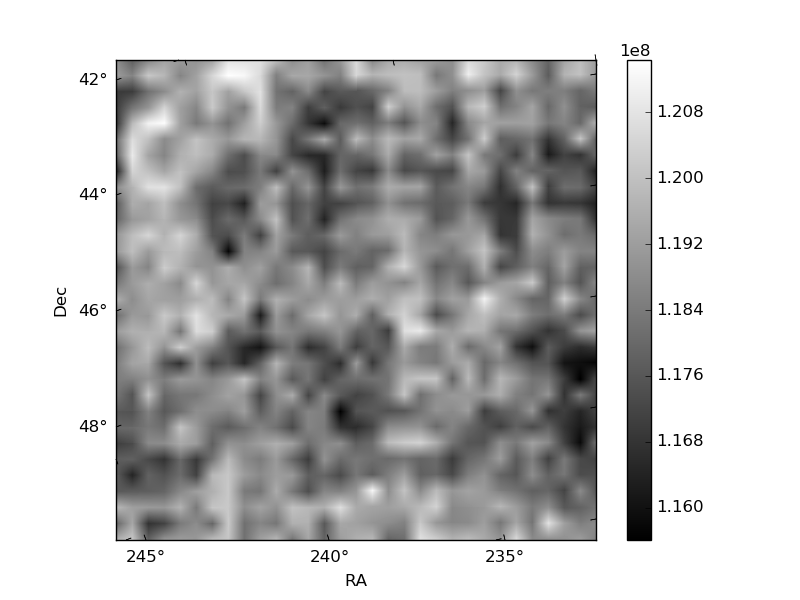
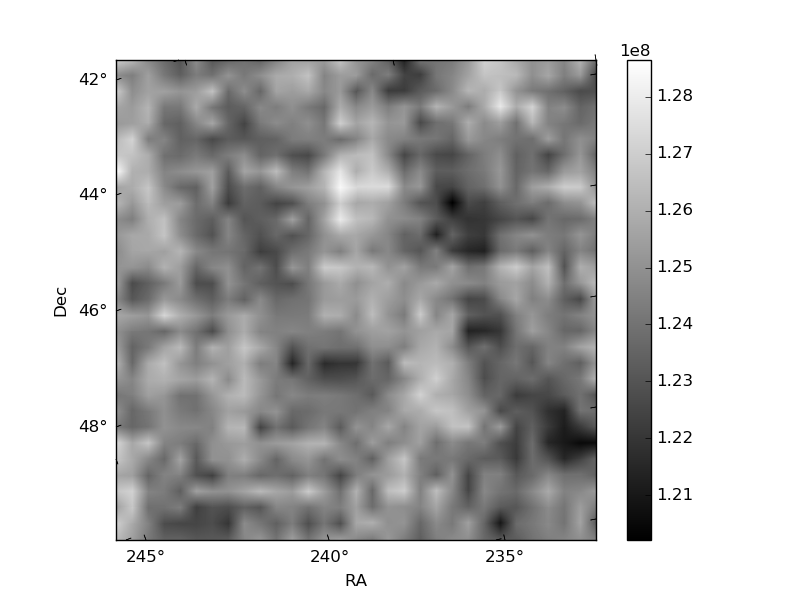
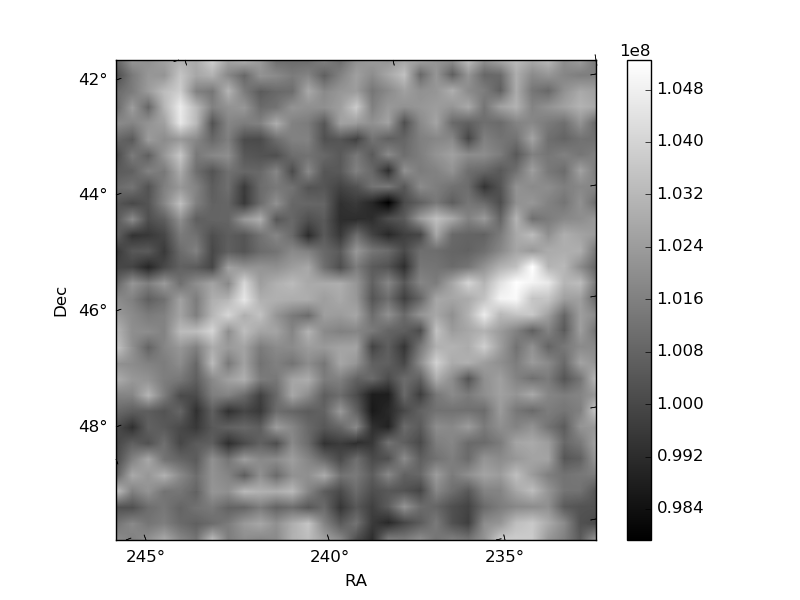
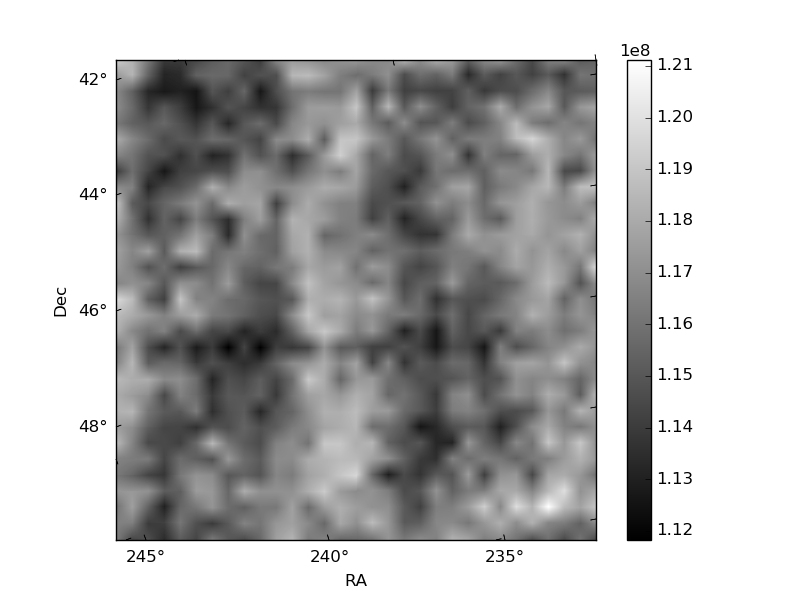
Histogram calculated using DETX and DETY for each event in the final _common_clean file
| Quadrant A |  |
 |
Quadrant B |
|---|---|---|---|
| Quadrant D |  |
 |
Quadrant C |
| Plot type | Count rate plots | Images |
|---|---|---|
| Comparison with Poisson distribution Blue bars denote a histogram of data divided into 1 sec bins. Red curve is a Poisson curve with rate = median count rate of data. |
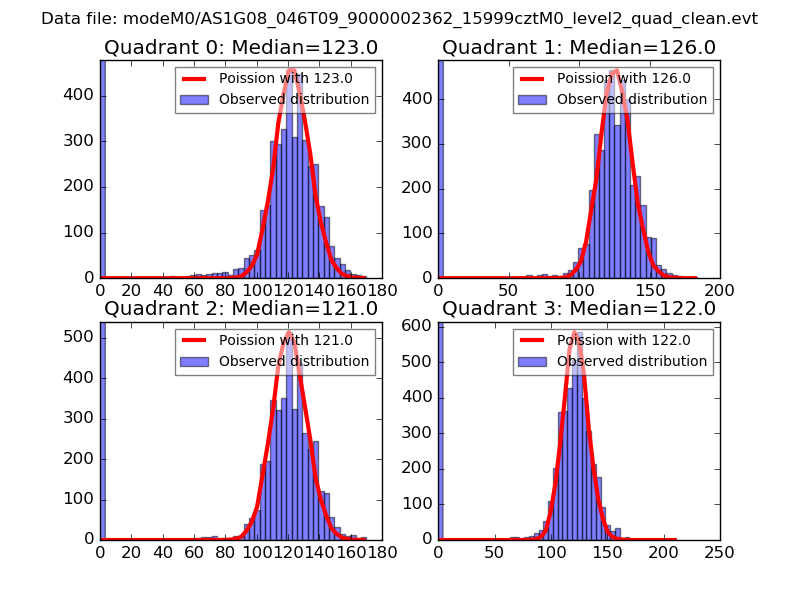 |
 |
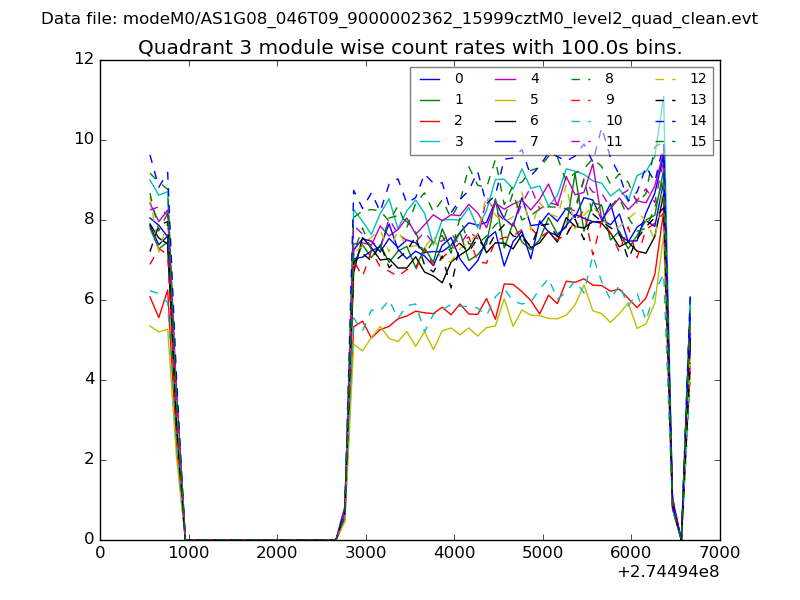
| Quadrant-wise count rates Data is divided into 100 sec bins |
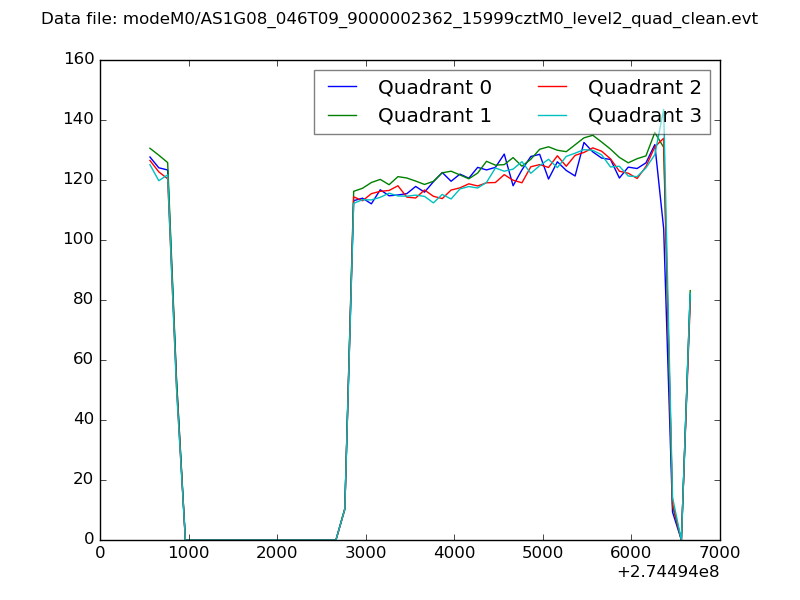 |
|
| Module-wise count rates for Quadrant A Data is divided into 100 sec bins |
 |
 |
| Module-wise count rates for Quadrant B Data is divided into 100 sec bins |
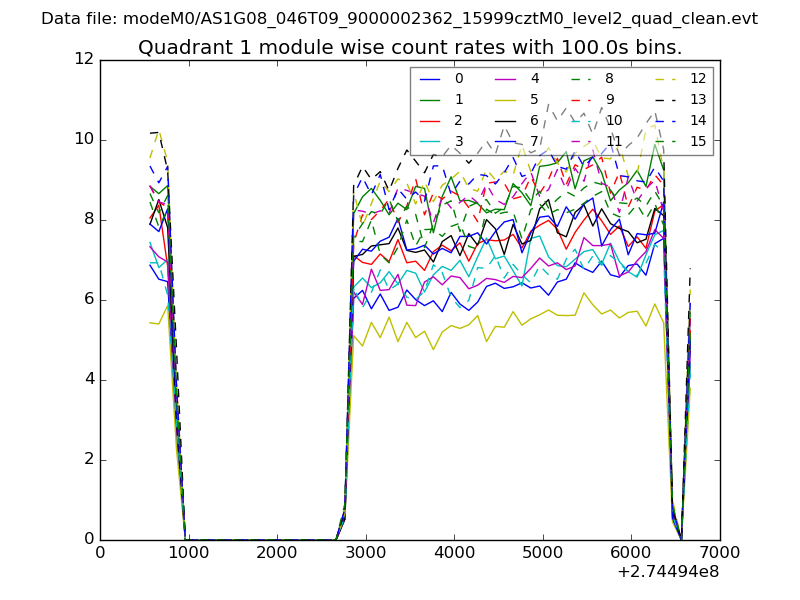 |
 |
| Module-wise count rates for Quadrant C Data is divided into 100 sec bins |
 |
 |
| Module-wise count rates for Quadrant D Data is divided into 100 sec bins |
 |
 |
| Parameter | Plot |
|---|---|
| CZT HV Monitor | 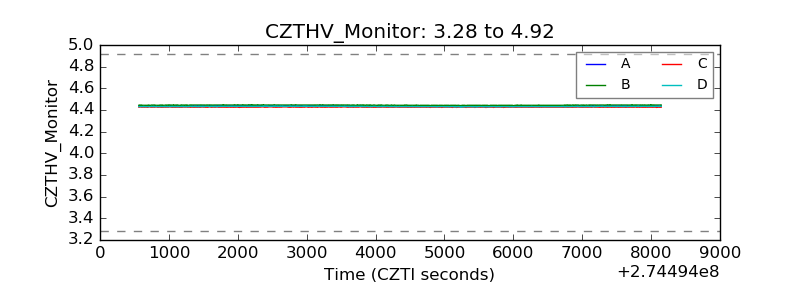 |
| D_VDD | 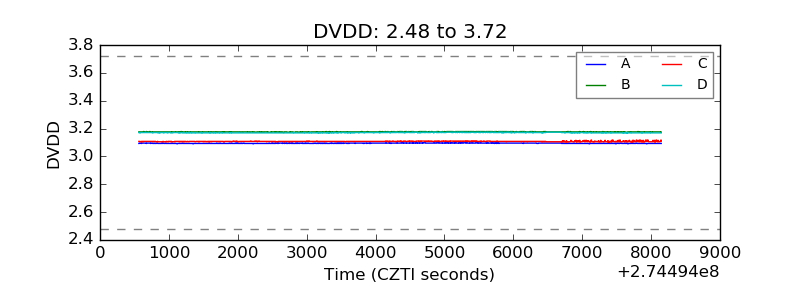 |
| Temperature 1 | 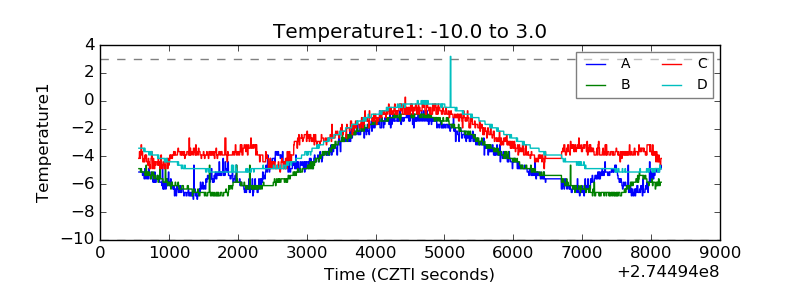 |
| Veto HV Monitor | 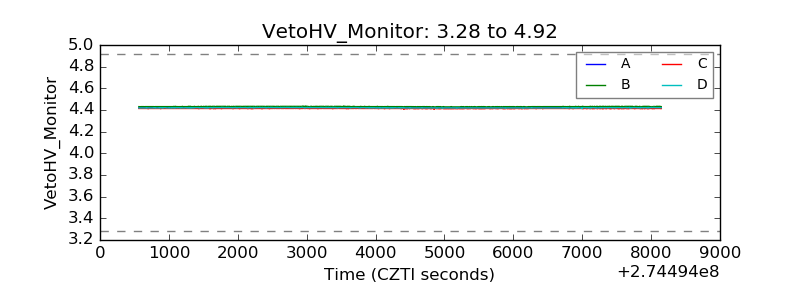 |
| Veto LLD | 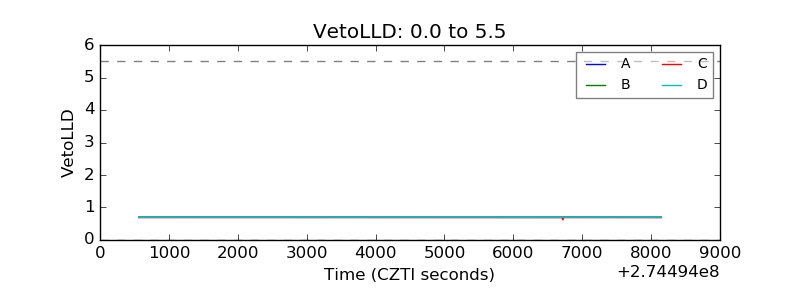 |
| Alpha Counter | 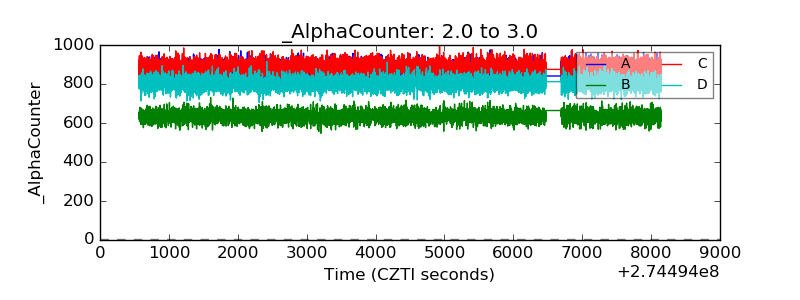 |
| _CPM_Rate | 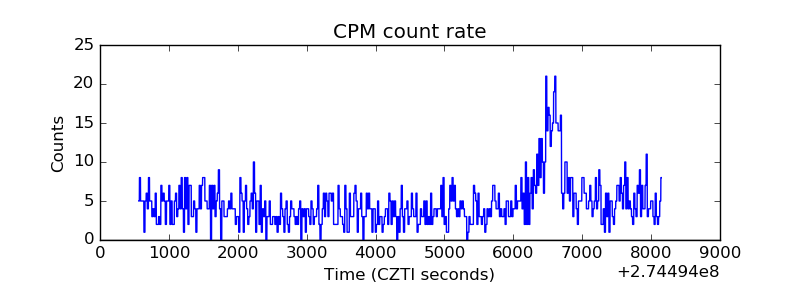 |
| CZT Counter | 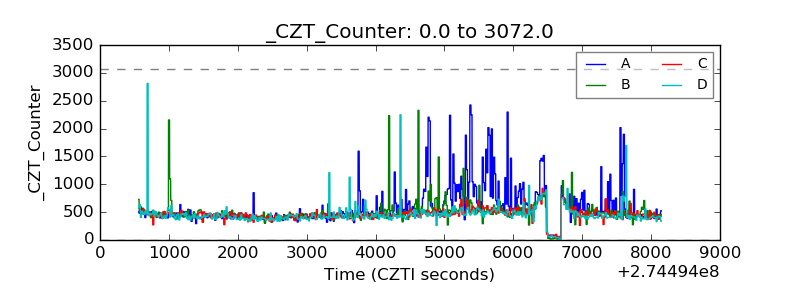 |
| +2.5 Volts monitor |  |
| +5 Volts monitor |  |
| _ROLL_ROT | 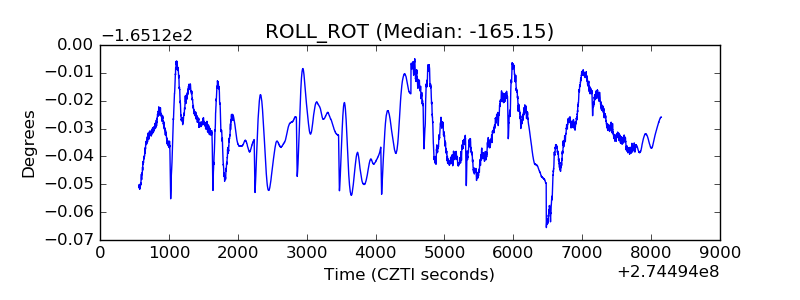 |
| _Roll_DEC | 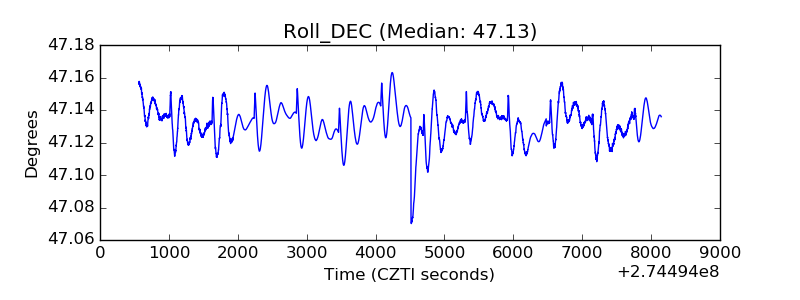 |
| _Roll_RA | 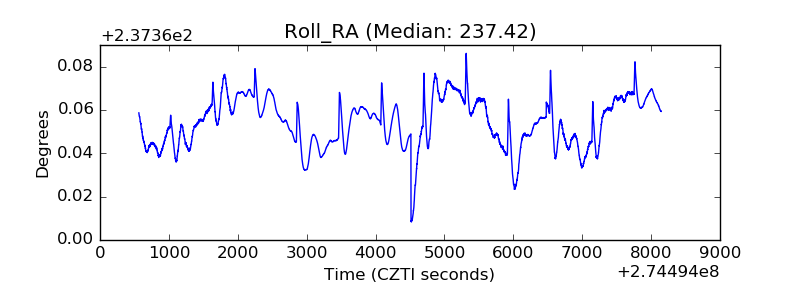 |
| Veto Counter | 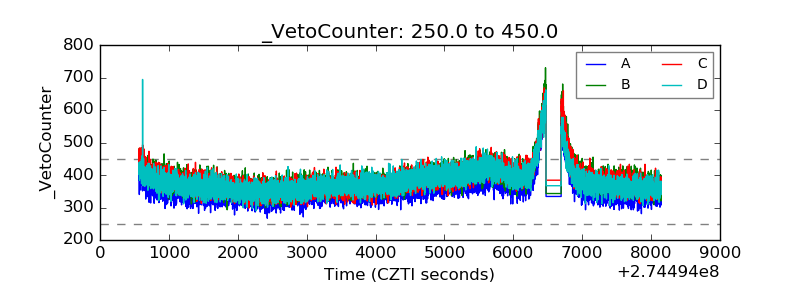 |