| Param | Original file | Final file |
|---|---|---|
| Filename | modeM0/AS1G08_046T09_9000002362_16002cztM0_level2.evt | modeM0/AS1G08_046T09_9000002362_16002cztM0_level2_quad_clean.evt |
| Size (bytes) | 1,127,269,440 | 177,448,320 |
| Size | 1.0 GB | 169.2 MB |
| Events in quadrant A | 8,012,057 | 1,115,074 |
| Events in quadrant B | 6,782,598 | 1,151,021 |
| Events in quadrant C | 6,610,792 | 1,107,445 |
| Events in quadrant D | 11,814,048 | 1,059,535 |
| Mode M9 | |||
|---|---|---|---|
| Quadrant | BADHDUFLAG | Total packets | Discarded packets |
| A | 0 | 16 | 0 |
| B | 0 | 16 | 0 |
| C | 0 | 16 | 0 |
| D | 0 | 16 | 0 |
| Mode M0 | |||
|---|---|---|---|
| Quadrant | BADHDUFLAG | Total packets | Discarded packets |
| A | 0 | 32925 | 4 |
| B | 0 | 28772 | 3 |
| C | 0 | 27917 | 3 |
| D | 0 | 44509 | 3 |
| Mode SS | |||
|---|---|---|---|
| Quadrant | BADHDUFLAG | Total packets | Discarded packets |
| A | 0 | 278 | 0 |
| B | 0 | 278 | 0 |
| C | 0 | 278 | 0 |
| D | 0 | 278 | 0 |
| Quadrant | Total seconds | Saturated seconds | Saturation percentage |
|---|---|---|---|
| A | 13625 | 564 | 4.139450% |
| B | 13625 | 222 | 1.629358% |
| C | 13625 | 221 | 1.622018% |
| D | 13625 | 1177 | 8.638532% |
Noise dominated data is calculated using 1-second bins in cleaned event files. If a bin has >2000 counts, and if more than 50% of those come from <1% of pixels, then it is considered to be noise-dominated and hence unusable.
| Quadrant | # 1 sec bins | Bins with >0 counts | Bins with >2000 counts | High rate bins dominated by noise | Noise dominated (total time) | Noise dominated (detector-on time) | Marked lightcurve |
|---|---|---|---|---|---|---|---|
| A | 15261 | 13628 | 357 | 357 | 2.34% | 2.62% | 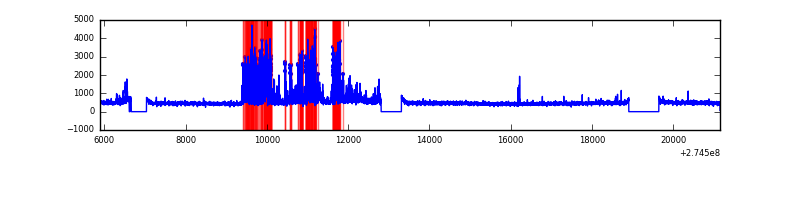 |
| B | 15261 | 13628 | 31 | 31 | 0.20% | 0.23% | 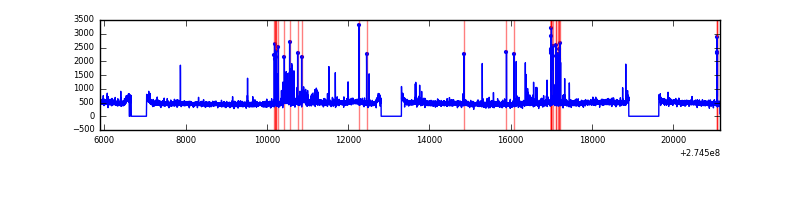 |
| C | 15261 | 13628 | 1 | 1 | 0.01% | 0.01% |  |
| D | 15261 | 13627 | 1011 | 1011 | 6.62% | 7.42% | 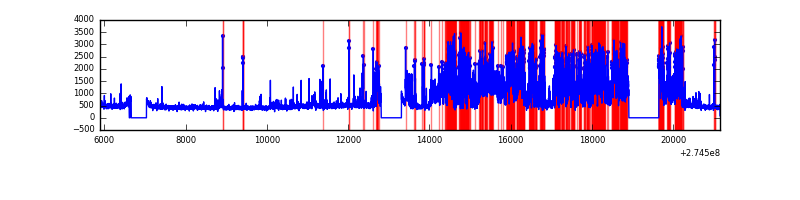 |
Top three noisy pixels from each quadrant. If the there are fewer than three noisy pixels in the level2.evt file, extra rows are filled as -1
| Pixel properties | Quadrant properties | ||||||
|---|---|---|---|---|---|---|---|
| Quadrant | DetID | PixID | Counts | Sigma | Mean | Median | Sigma |
| A | 10 | 253 | 1649739 | 5157.13 | 1599 | 1564 | 319.6 |
| A | 13 | 210 | 183402 | 568.97 | 1599 | 1564 | 319.6 |
| A | 0 | 226 | 14088 | 39.19 | 1599 | 1564 | 319.6 |
| B | 7 | 220 | 193976 | 623.36 | 1614 | 1569 | 308.7 |
| B | 10 | 245 | 54750 | 172.29 | 1614 | 1569 | 308.7 |
| B | 4 | 216 | 44424 | 138.84 | 1614 | 1569 | 308.7 |
| C | 3 | 233 | 300042 | 826.62 | 1550 | 1558 | 361.1 |
| C | 14 | 238 | 238355 | 655.79 | 1550 | 1558 | 361.1 |
| C | 8 | 128 | 11636 | 27.91 | 1550 | 1558 | 361.1 |
| D | 4 | 239 | 5458420 | 14414.59 | 1544 | 1495 | 378.6 |
| D | 12 | 218 | 275753 | 724.46 | 1544 | 1495 | 378.6 |
| D | 2 | 152 | 76828 | 198.99 | 1544 | 1495 | 378.6 |
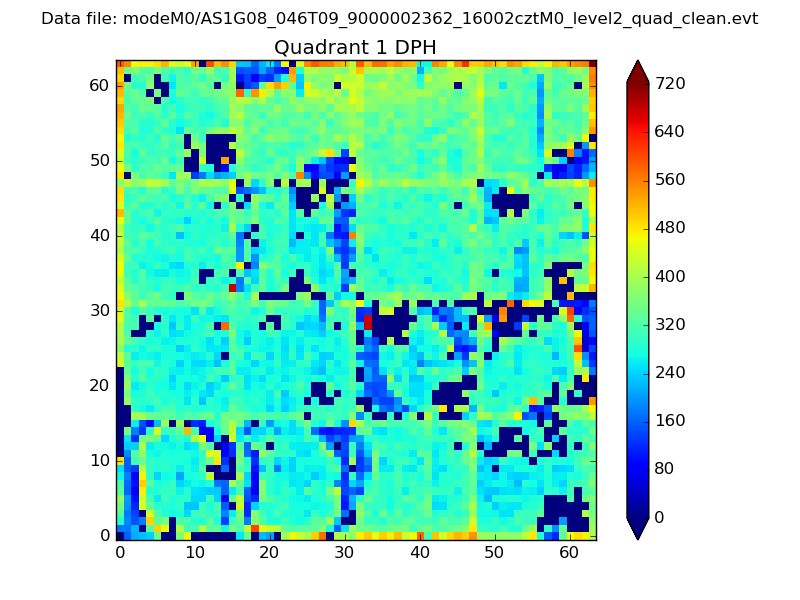
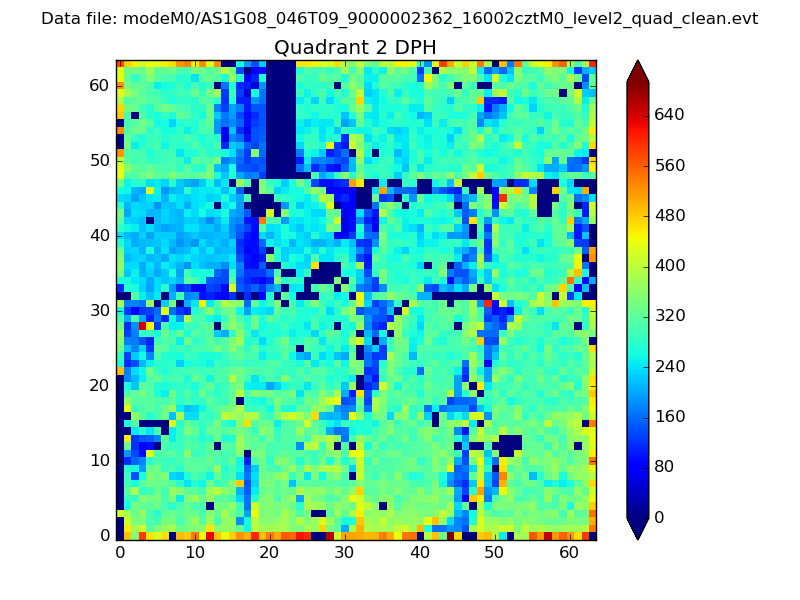
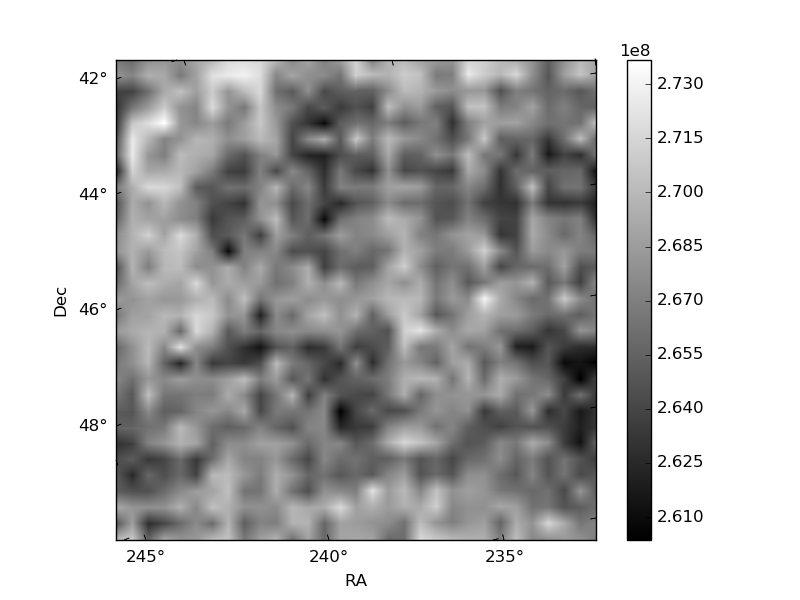
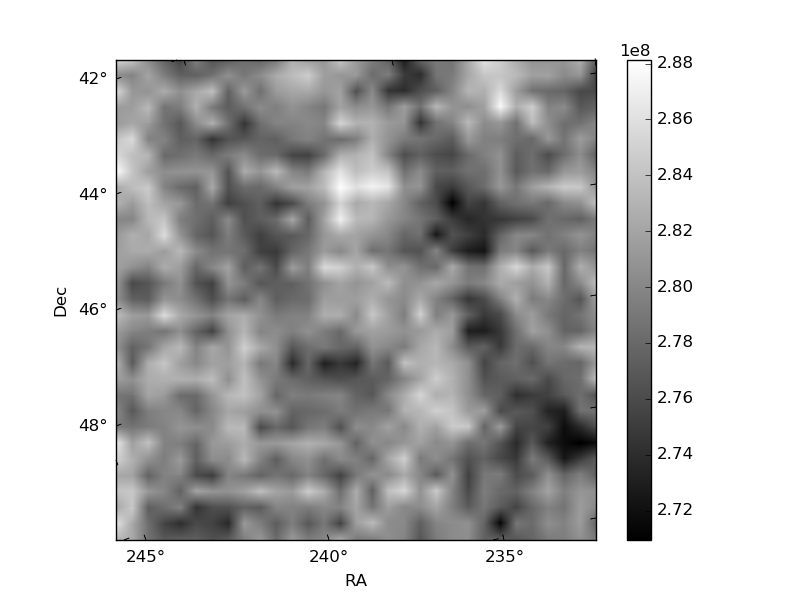
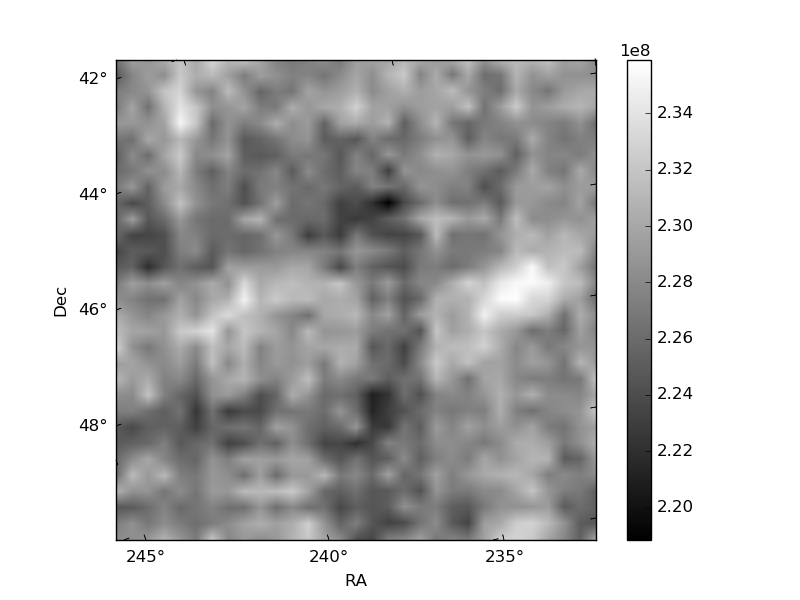
Histogram calculated using DETX and DETY for each event in the final _common_clean file
| Quadrant A |  |
 |
Quadrant B |
|---|---|---|---|
| Quadrant D | 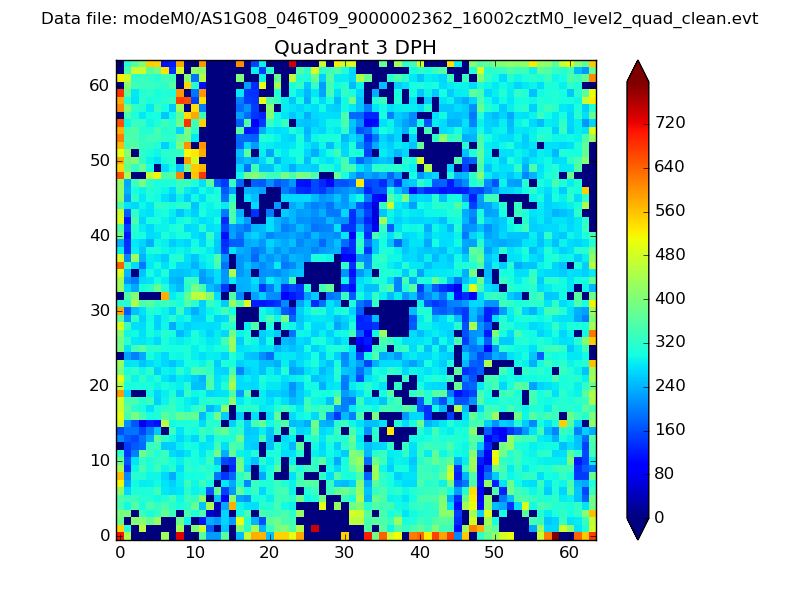 |
 |
Quadrant C |
| Plot type | Count rate plots | Images |
|---|---|---|
| Comparison with Poisson distribution Blue bars denote a histogram of data divided into 1 sec bins. Red curve is a Poisson curve with rate = median count rate of data. |
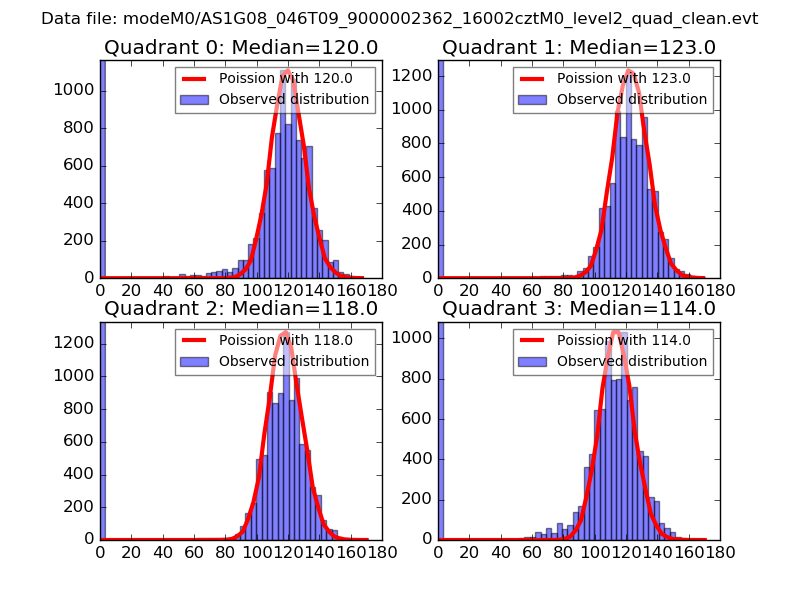 |
 |
| Quadrant-wise count rates Data is divided into 100 sec bins |
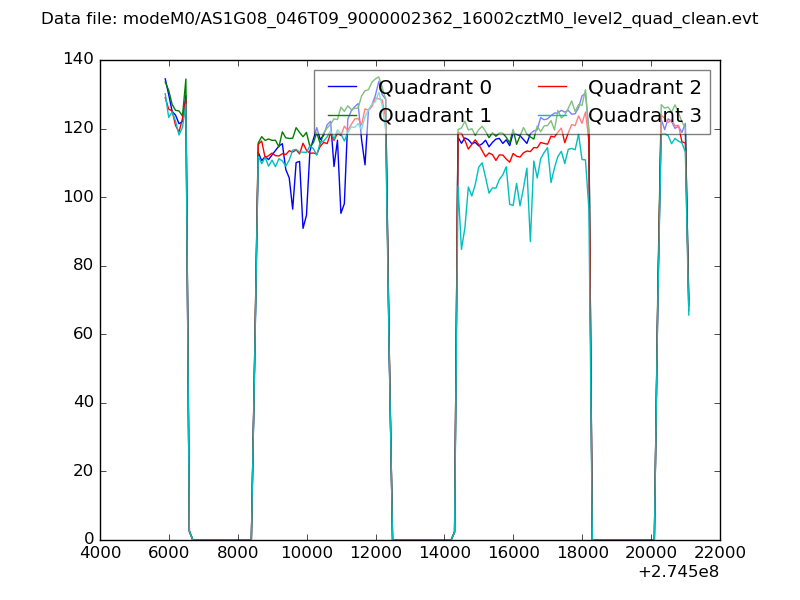 |
|
| Module-wise count rates for Quadrant A Data is divided into 100 sec bins |
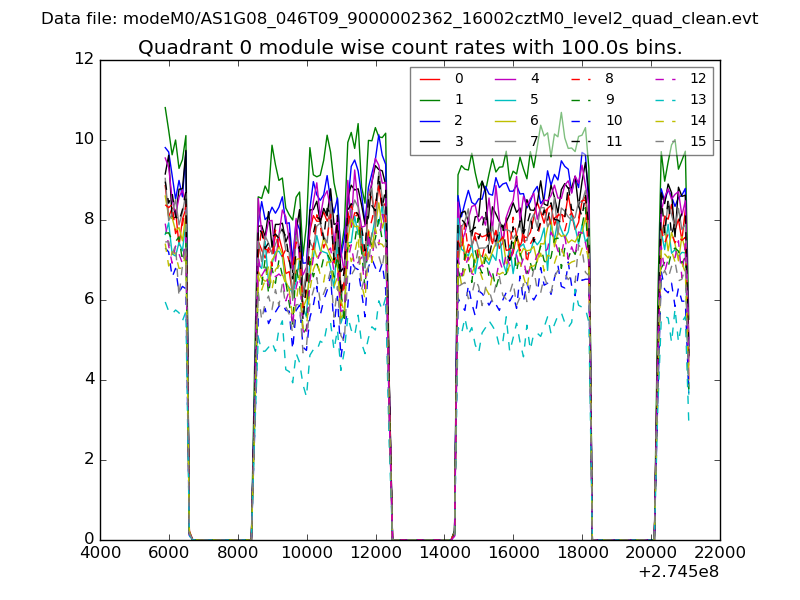 |
 |
| Module-wise count rates for Quadrant B Data is divided into 100 sec bins |
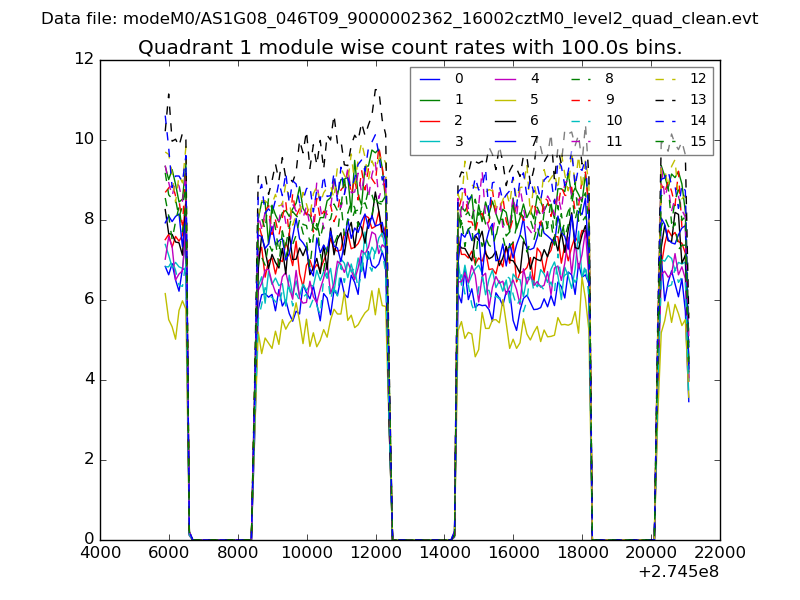 |
 |
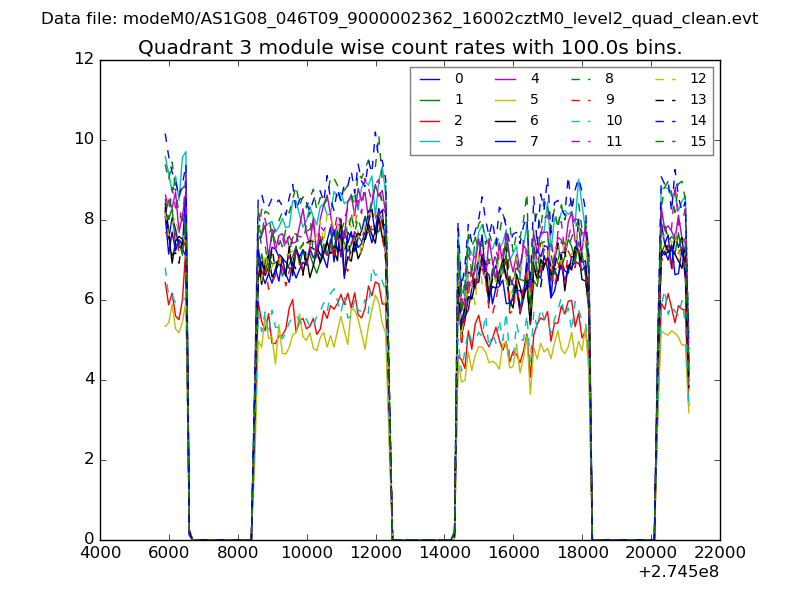
| Module-wise count rates for Quadrant C Data is divided into 100 sec bins |
 |
 |
| Module-wise count rates for Quadrant D Data is divided into 100 sec bins |
 |
 |
| Parameter | Plot |
|---|---|
| CZT HV Monitor | 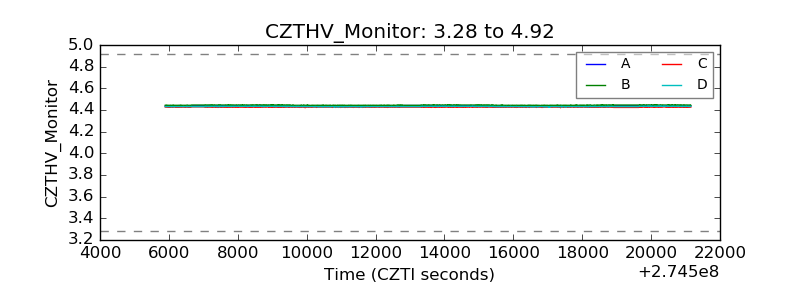 |
| D_VDD | 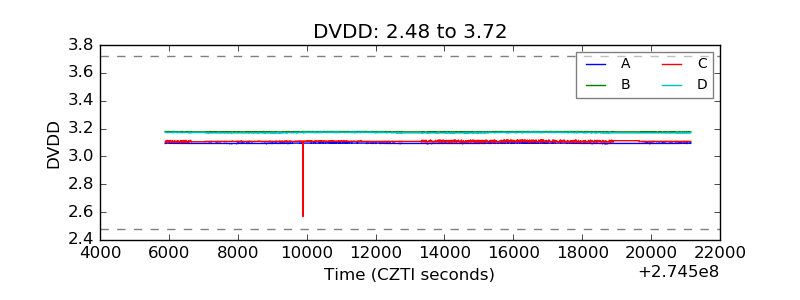 |
| Temperature 1 | 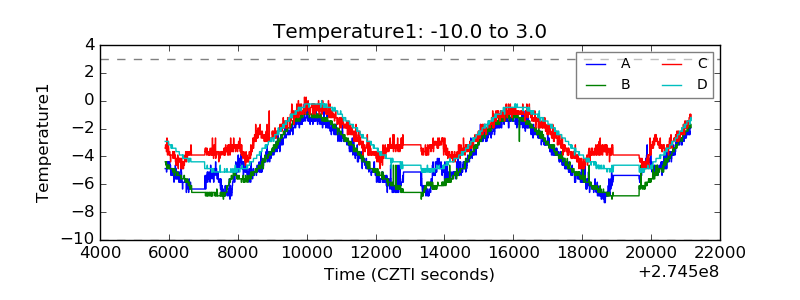 |
| Veto HV Monitor | 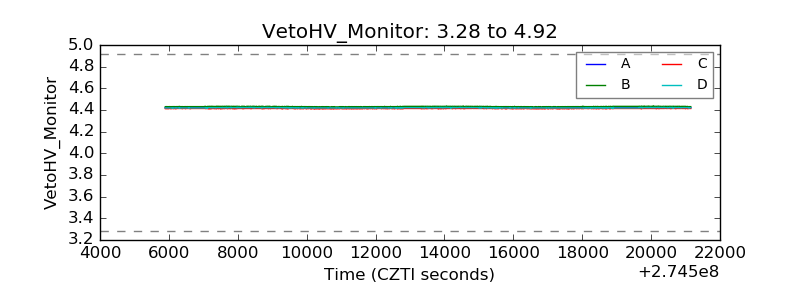 |
| Veto LLD | 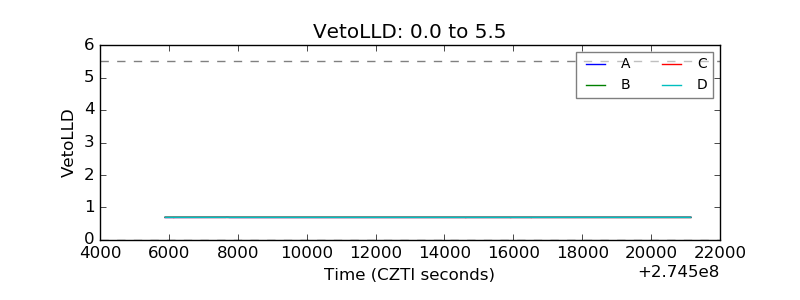 |
| Alpha Counter | 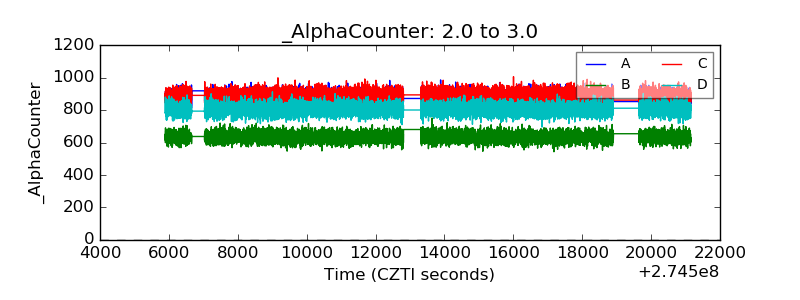 |
| _CPM_Rate | 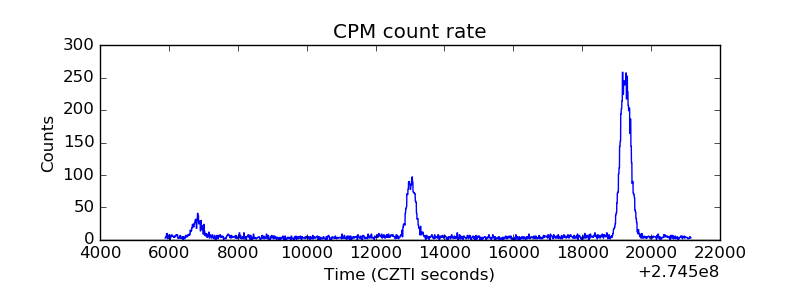 |
| CZT Counter | 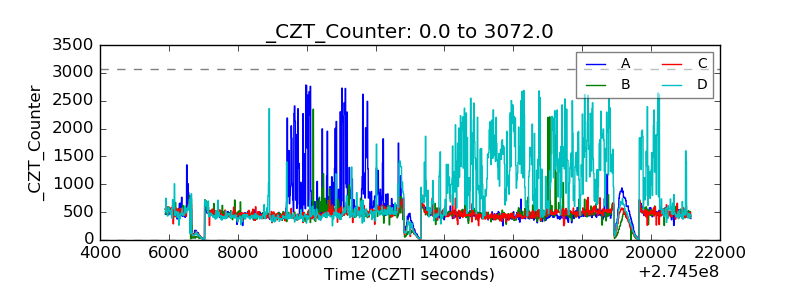 |
| +2.5 Volts monitor |  |
| +5 Volts monitor |  |
| _ROLL_ROT | 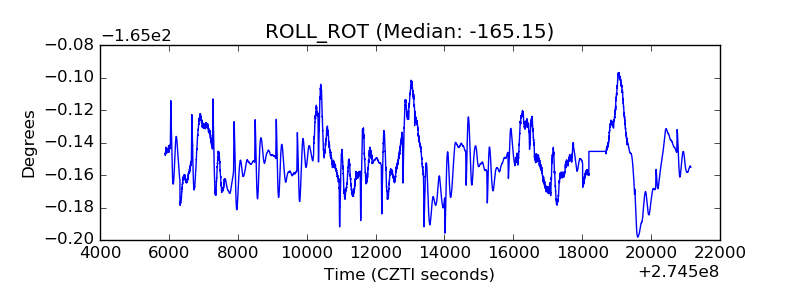 |
| _Roll_DEC | 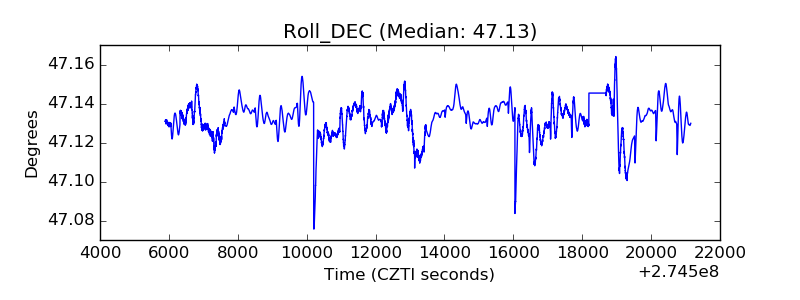 |
| _Roll_RA | 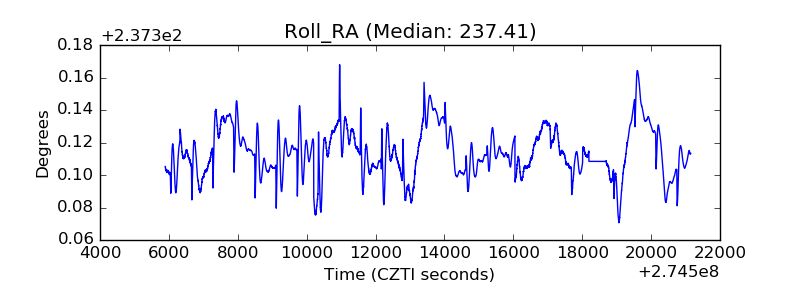 |
| Veto Counter | 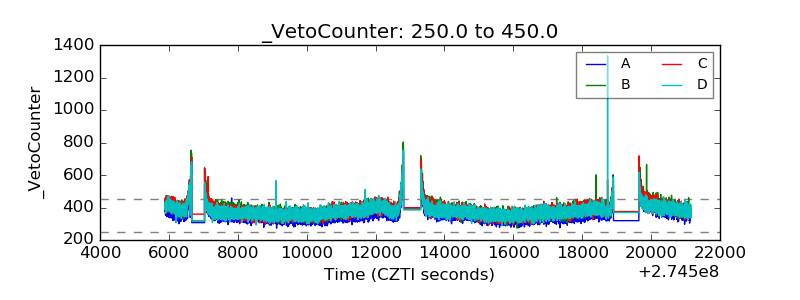 |