| Param | Original file | Final file |
|---|---|---|
| Filename | modeM0/AS1G08_046T09_9000002362_16003cztM0_level2.evt | modeM0/AS1G08_046T09_9000002362_16003cztM0_level2_quad_clean.evt |
| Size (bytes) | 170,115,840 | 41,457,600 |
| Size | 162.2 MB | 39.5 MB |
| Events in quadrant A | 1,137,896 | 273,437 |
| Events in quadrant B | 1,237,006 | 275,596 |
| Events in quadrant C | 1,169,006 | 263,684 |
| Events in quadrant D | 1,434,508 | 261,584 |
| Mode M0 | |||
|---|---|---|---|
| Quadrant | BADHDUFLAG | Total packets | Discarded packets |
| A | 0 | 5096 | 0 |
| B | 0 | 5321 | 0 |
| C | 0 | 5111 | 0 |
| D | 0 | 6062 | 0 |
| Mode SS | |||
|---|---|---|---|
| Quadrant | BADHDUFLAG | Total packets | Discarded packets |
| A | 0 | 50 | 0 |
| B | 0 | 50 | 0 |
| C | 0 | 50 | 0 |
| D | 0 | 50 | 0 |
| Quadrant | Total seconds | Saturated seconds | Saturation percentage |
|---|---|---|---|
| A | 2519 | 2 | 0.079397% |
| B | 2519 | 14 | 0.555776% |
| C | 2519 | 7 | 0.277888% |
| D | 2519 | 92 | 3.652243% |
Noise dominated data is calculated using 1-second bins in cleaned event files. If a bin has >2000 counts, and if more than 50% of those come from <1% of pixels, then it is considered to be noise-dominated and hence unusable.
| Quadrant | # 1 sec bins | Bins with >0 counts | Bins with >2000 counts | High rate bins dominated by noise | Noise dominated (total time) | Noise dominated (detector-on time) | Marked lightcurve |
|---|---|---|---|---|---|---|---|
| A | 2520 | 2520 | 0 | 0 | 0.00% | 0.00% | 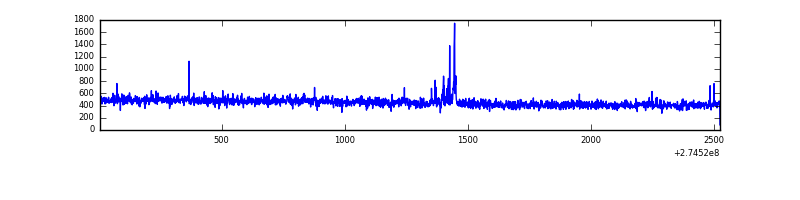 |
| B | 2520 | 2520 | 10 | 10 | 0.40% | 0.40% |  |
| C | 2520 | 2520 | 0 | 0 | 0.00% | 0.00% | 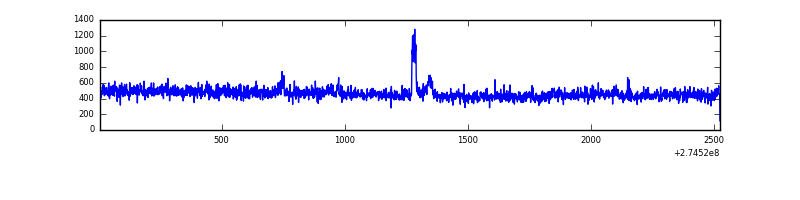 |
| D | 2520 | 2520 | 79 | 79 | 3.13% | 3.13% | 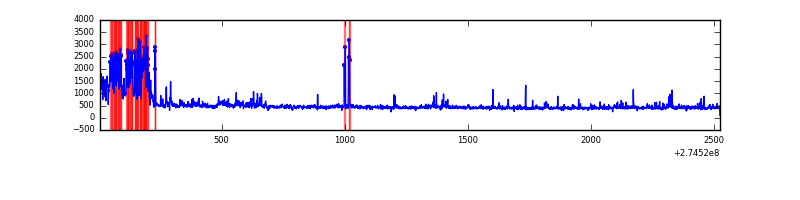 |
Top three noisy pixels from each quadrant. If the there are fewer than three noisy pixels in the level2.evt file, extra rows are filled as -1
| Pixel properties | Quadrant properties | ||||||
|---|---|---|---|---|---|---|---|
| Quadrant | DetID | PixID | Counts | Sigma | Mean | Median | Sigma |
| A | 15 | 174 | 15726 | 257.19 | 290 | 284 | 60.0 |
| A | 0 | 226 | 2613 | 38.79 | 290 | 284 | 60.0 |
| A | 12 | 194 | 2243 | 32.63 | 290 | 284 | 60.0 |
| B | 7 | 220 | 60206 | 1054.79 | 284 | 277 | 56.8 |
| B | 0 | 245 | 28870 | 503.26 | 284 | 277 | 56.8 |
| B | 4 | 216 | 20912 | 363.19 | 284 | 277 | 56.8 |
| C | 3 | 233 | 73596 | 1140.31 | 270 | 271 | 64.3 |
| C | 14 | 238 | 41296 | 638.0 | 270 | 271 | 64.3 |
| C | 13 | 61 | 2015 | 27.12 | 270 | 271 | 64.3 |
| D | 4 | 239 | 328781 | 4775.22 | 275 | 266 | 68.8 |
| D | 10 | 70 | 18149 | 259.94 | 275 | 266 | 68.8 |
| D | 15 | 145 | 13372 | 190.51 | 275 | 266 | 68.8 |
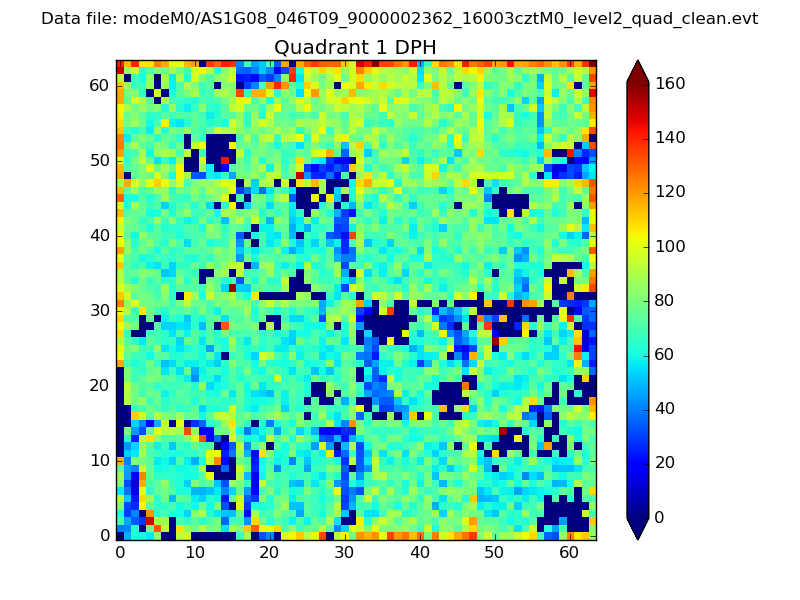
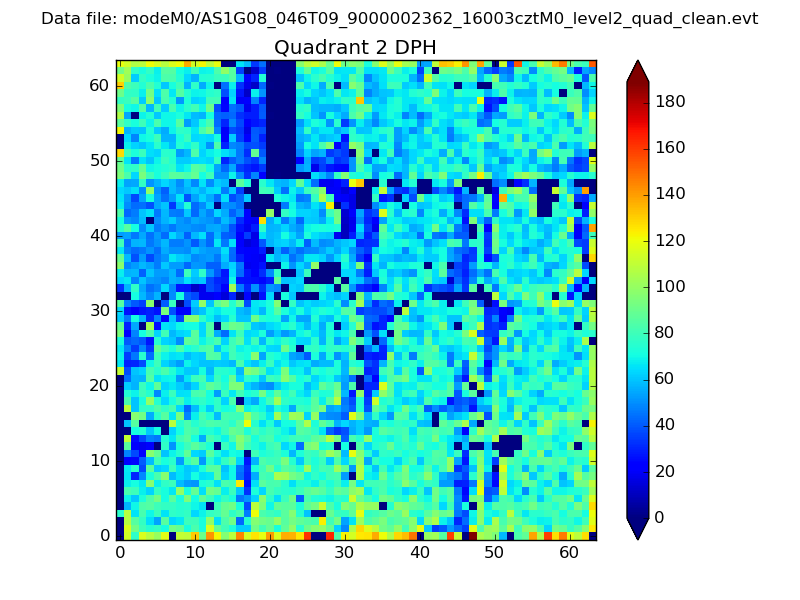
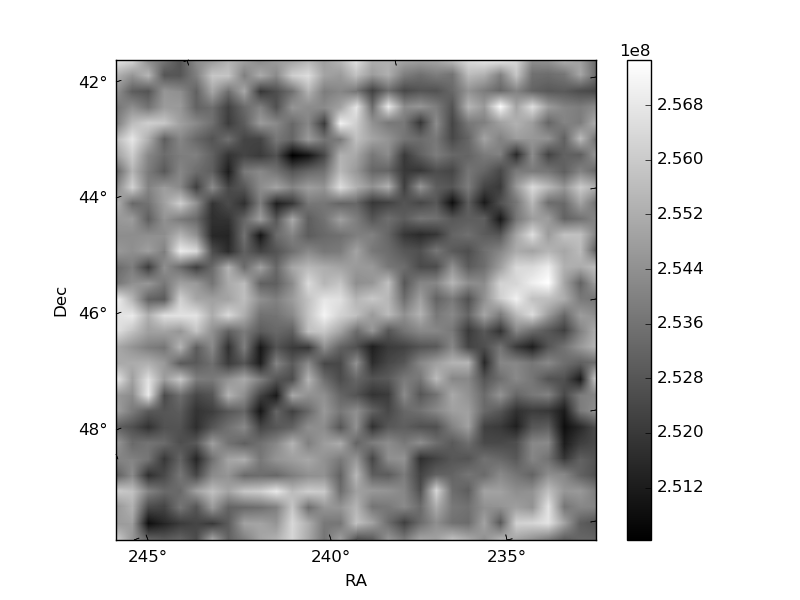
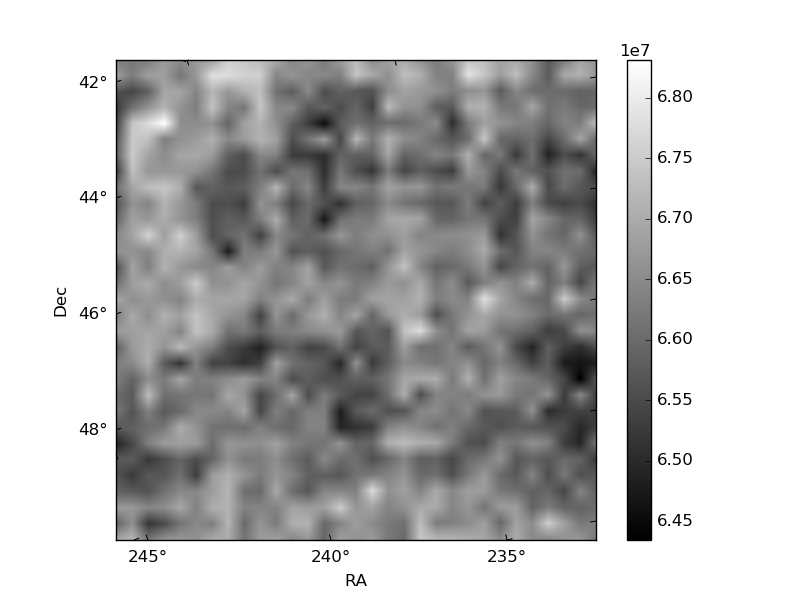
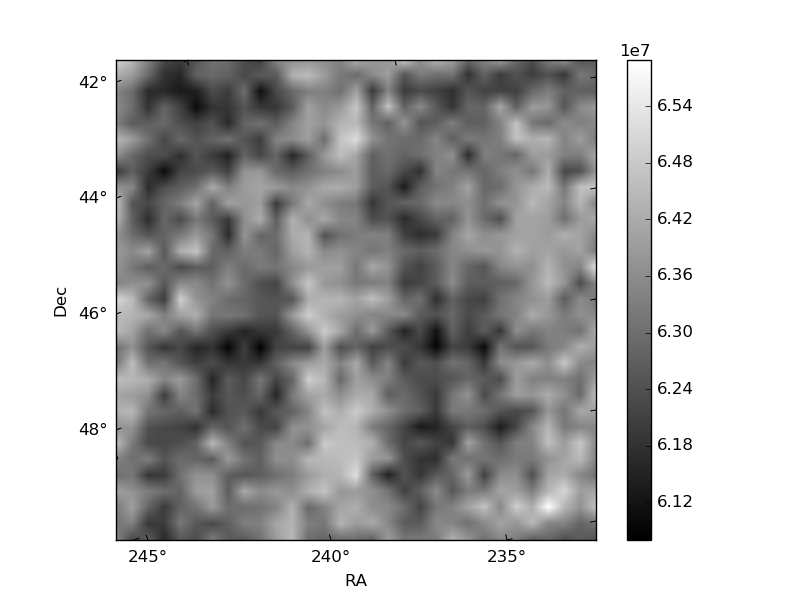
Histogram calculated using DETX and DETY for each event in the final _common_clean file
| Quadrant A | 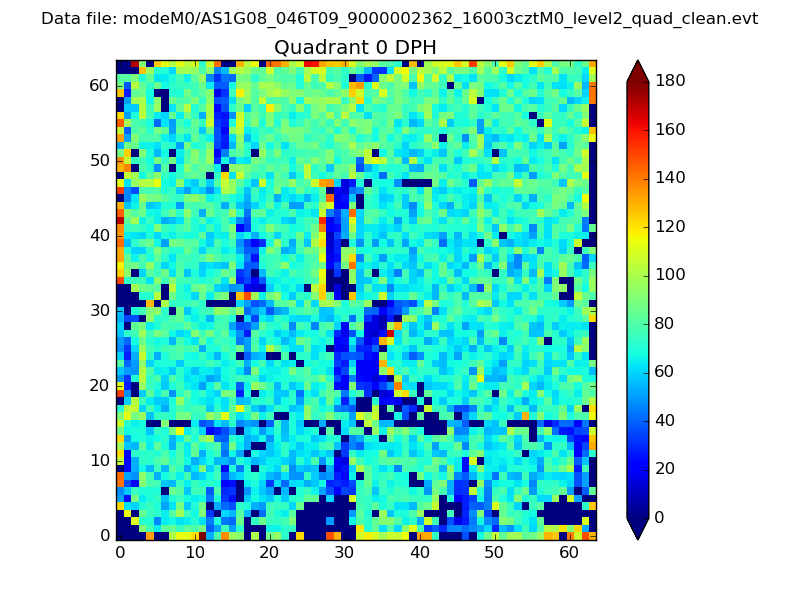 |
 |
Quadrant B |
|---|---|---|---|
| Quadrant D | 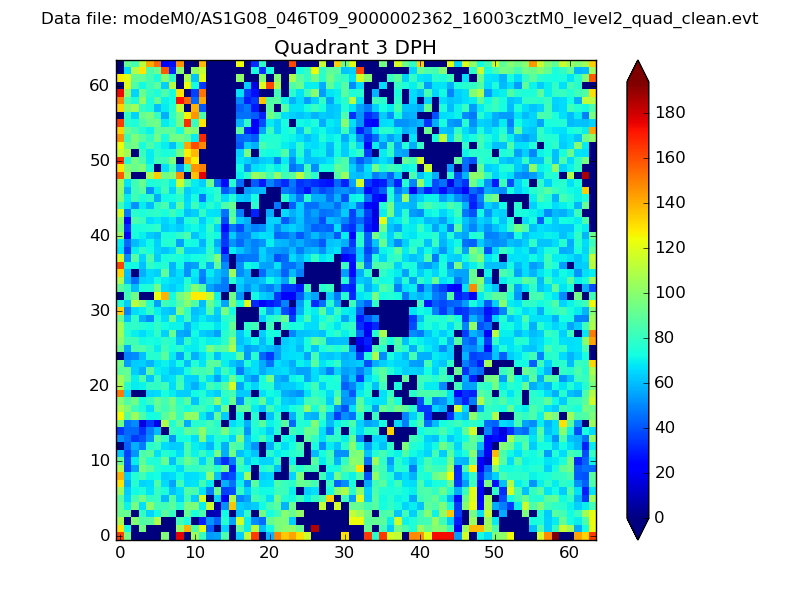 |
 |
Quadrant C |
| Plot type | Count rate plots | Images |
|---|---|---|
| Comparison with Poisson distribution Blue bars denote a histogram of data divided into 1 sec bins. Red curve is a Poisson curve with rate = median count rate of data. |
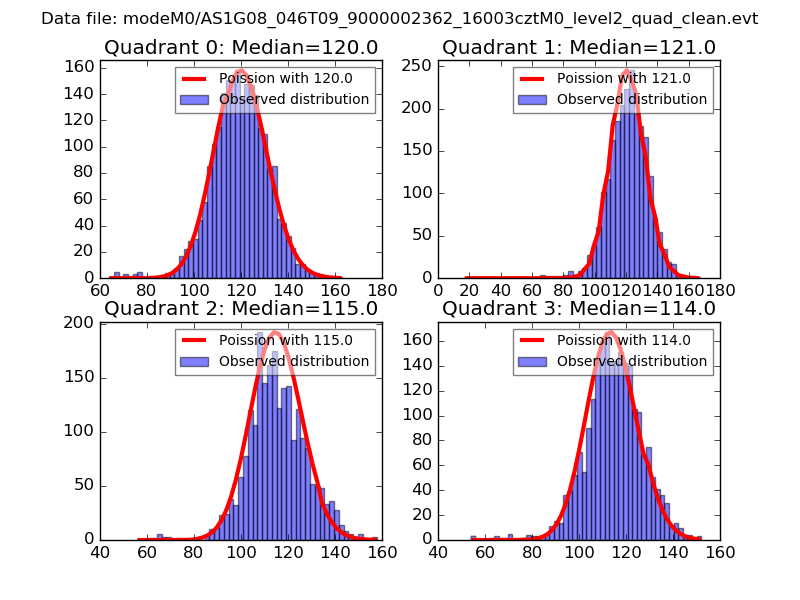 |
 |
| Quadrant-wise count rates Data is divided into 100 sec bins |
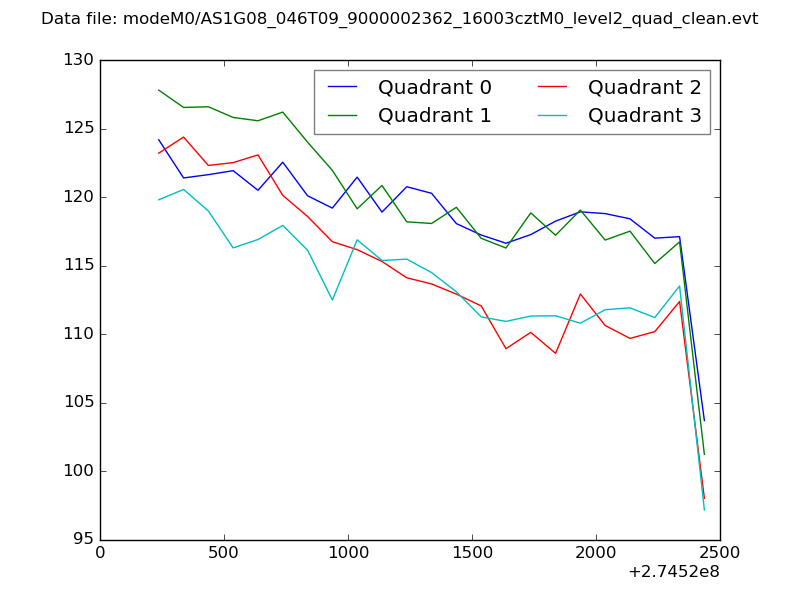 |
|
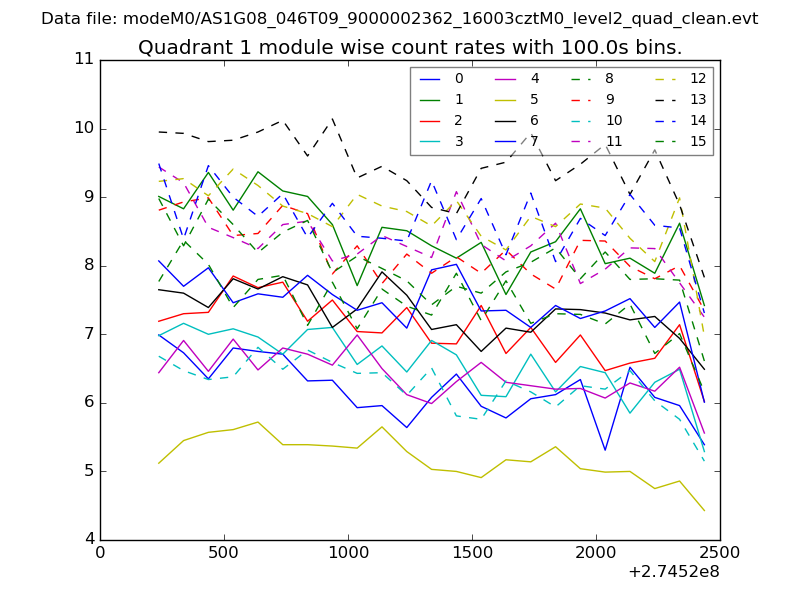
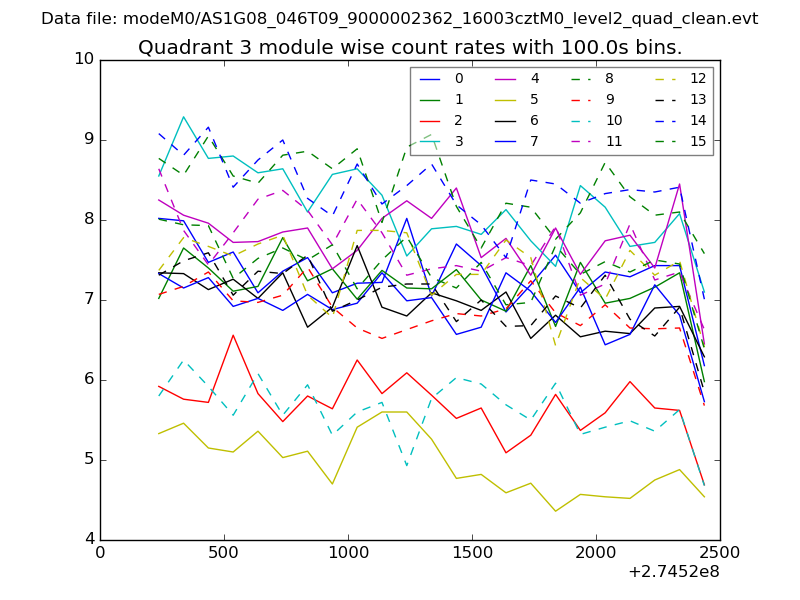
| Module-wise count rates for Quadrant A Data is divided into 100 sec bins |
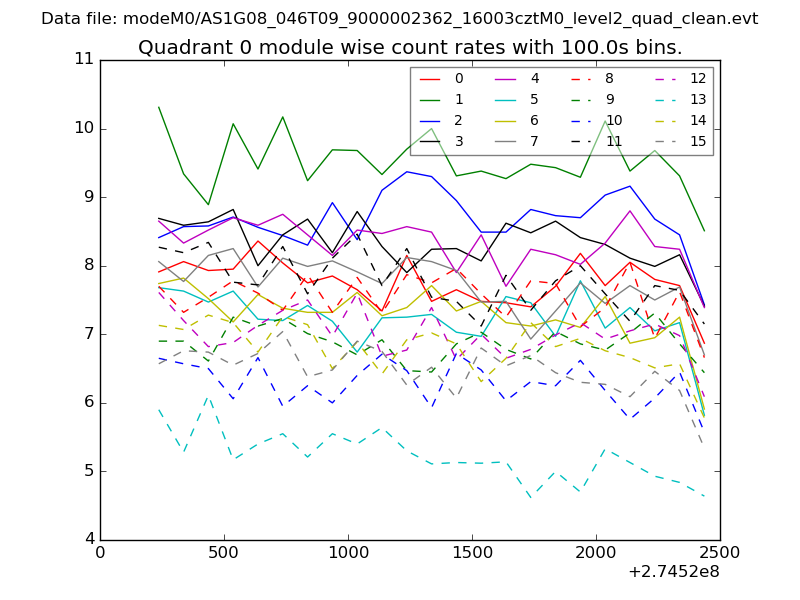 |
 |
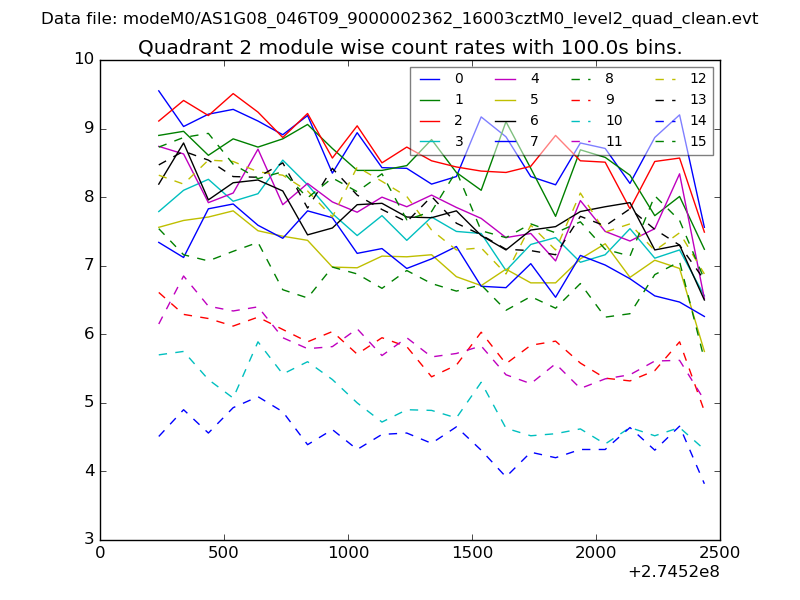
| Module-wise count rates for Quadrant B Data is divided into 100 sec bins |
 |
 |
| Module-wise count rates for Quadrant C Data is divided into 100 sec bins |
 |
 |
| Module-wise count rates for Quadrant D Data is divided into 100 sec bins |
 |
 |
| Parameter | Plot |
|---|---|
| CZT HV Monitor | 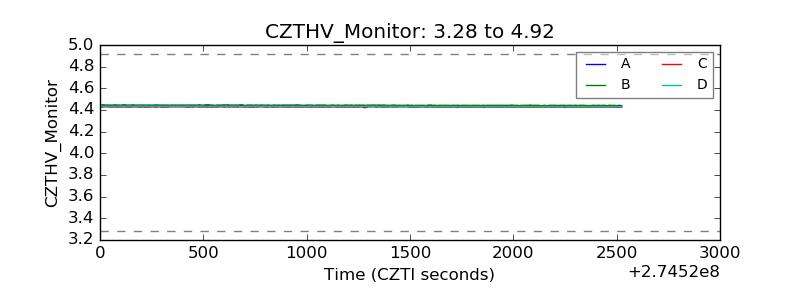 |
| D_VDD |  |
| Temperature 1 | 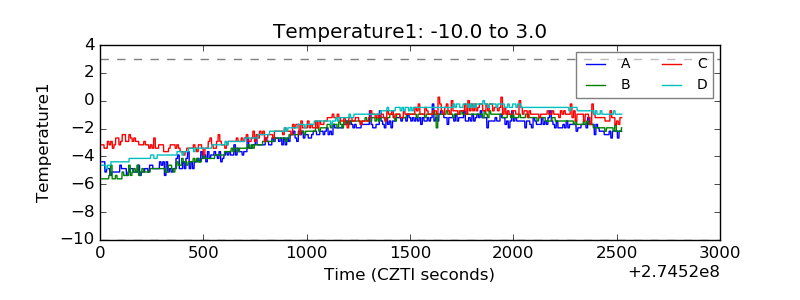 |
| Veto HV Monitor | 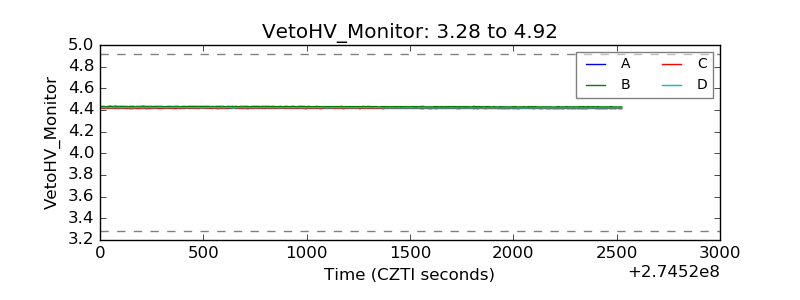 |
| Veto LLD | 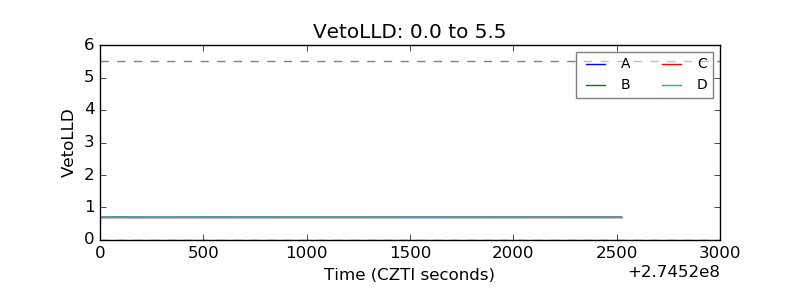 |
| Alpha Counter | 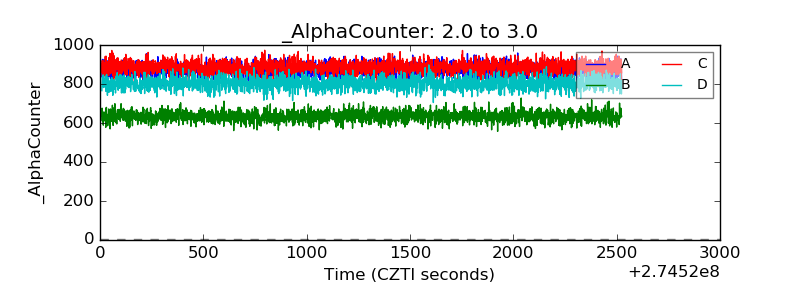 |
| _CPM_Rate | 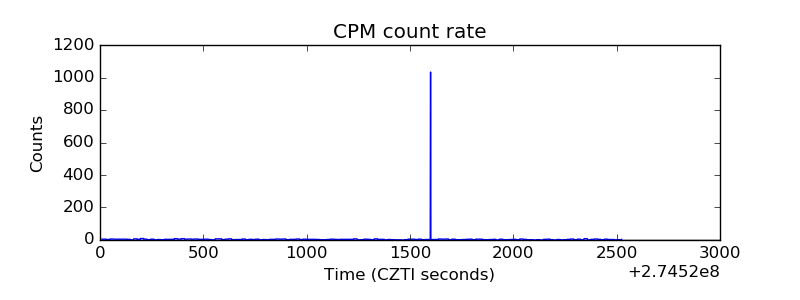 |
| CZT Counter | 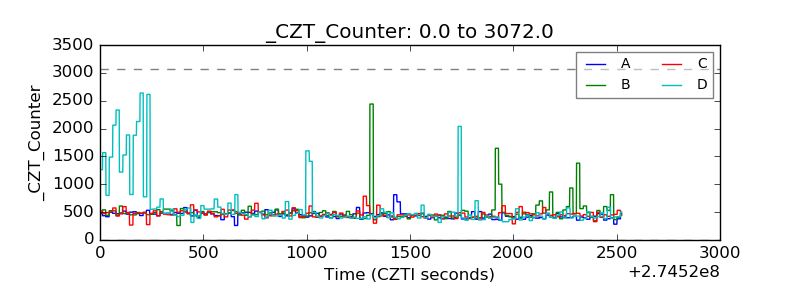 |
| +2.5 Volts monitor |  |
| +5 Volts monitor |  |
| _ROLL_ROT | 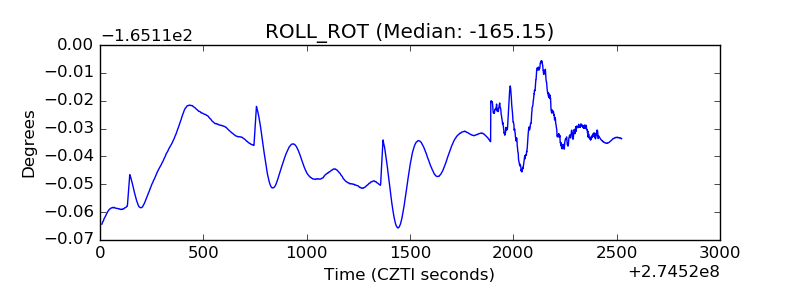 |
| _Roll_DEC |  |
| _Roll_RA | 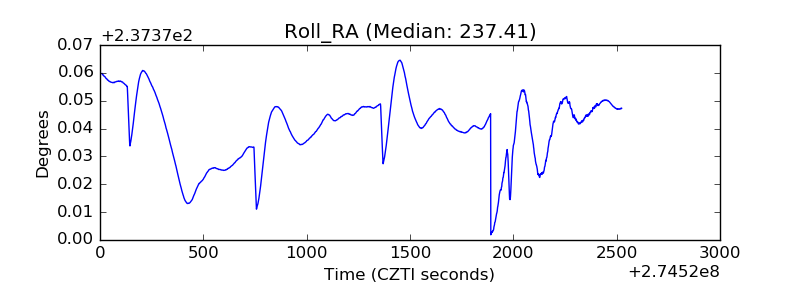 |
| Veto Counter | 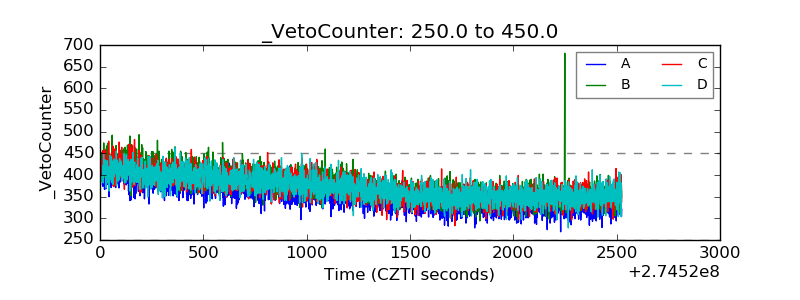 |