| Param | Original file | Final file |
|---|---|---|
| Filename | modeM0/AS1T02_090T01_9000002364cztM0_level2.fits | modeM0/AS1T02_090T01_9000002364cztM0_level2_quad_clean.evt |
| Size (bytes) | 456,180,480 | 447,984,000 |
| Size | 435.0 MB | 427.2 MB |
| Events in quadrant A | 2,830,964 | 2,758,925 |
| Events in quadrant B | 2,705,906 | 2,745,038 |
| Events in quadrant C | 2,797,440 | 2,625,800 |
| Events in quadrant D | 2,454,934 | 2,411,300 |
| Mode M9 | |||
|---|---|---|---|
| Quadrant | BADHDUFLAG | Total packets | Discarded packets |
| A | 0 | 97 | 0 |
| B | 0 | 97 | 0 |
| C | 0 | 97 | 0 |
| D | 0 | 97 | 0 |
| Mode M0 | |||
|---|---|---|---|
| Quadrant | BADHDUFLAG | Total packets | Discarded packets |
| A | 0 | 94925 | 0 |
| B | 0 | 99501 | 0 |
| C | 0 | 96851 | 0 |
| D | 0 | 102515 | 0 |
| Mode SS | |||
|---|---|---|---|
| Quadrant | BADHDUFLAG | Total packets | Discarded packets |
| A | 0 | 898 | 0 |
| B | 0 | 898 | 0 |
| C | 0 | 898 | 0 |
| D | 0 | 898 | 0 |
| Quadrant | Total seconds | Saturated seconds | Saturation percentage |
|---|---|---|---|
| A | 44093 | 630 | 1.428798% |
| B | 44093 | 916 | 2.077427% |
| C | 44093 | 851 | 1.930012% |
| D | 44093 | 1130 | 2.562765% |
Noise dominated data is calculated using 1-second bins in cleaned event files. If a bin has >2000 counts, and if more than 50% of those come from <1% of pixels, then it is considered to be noise-dominated and hence unusable.
| Quadrant | # 1 sec bins | Bins with >0 counts | Bins with >2000 counts | High rate bins dominated by noise | Noise dominated (total time) | Noise dominated (detector-on time) | Marked lightcurve |
|---|---|---|---|---|---|---|---|
| A | 53723 | 44086 | 0 | 0 | 0.00% | 0.00% |  |
| B | 53723 | 44085 | 0 | 0 | 0.00% | 0.00% |  |
| C | 53723 | 44087 | 0 | 0 | 0.00% | 0.00% |  |
| D | 53723 | 44083 | 0 | 0 | 0.00% | 0.00% |  |
Top three noisy pixels from each quadrant. If the there are fewer than three noisy pixels in the level2.evt file, extra rows are filled as -1
| Pixel properties | Quadrant properties | ||||||
|---|---|---|---|---|---|---|---|
| Quadrant | DetID | PixID | Counts | Sigma | Mean | Median | Sigma |
| A | 0 | 29 | 2773 | 11.66 | 736 | 693 | 178.4 |
| A | 7 | 110 | 2222 | 8.57 | 736 | 693 | 178.4 |
| A | 0 | 30 | 2129 | 8.05 | 736 | 693 | 178.4 |
| B | 2 | 9 | 2168 | 10.64 | 715 | 685 | 139.4 |
| B | 2 | 8 | 1812 | 8.08 | 715 | 685 | 139.4 |
| B | 12 | 226 | 1758 | 7.7 | 715 | 685 | 139.4 |
| C | 12 | 250 | 1988 | 6.79 | 739 | 692 | 190.8 |
| C | 2 | 191 | 1930 | 6.49 | 739 | 692 | 190.8 |
| C | 12 | 241 | 1916 | 6.42 | 739 | 692 | 190.8 |
| D | 3 | 14 | 1767 | 5.99 | 701 | 641 | 188.0 |
| D | 6 | 67 | 1727 | 5.78 | 701 | 641 | 188.0 |
| D | 6 | 231 | 1713 | 5.7 | 701 | 641 | 188.0 |
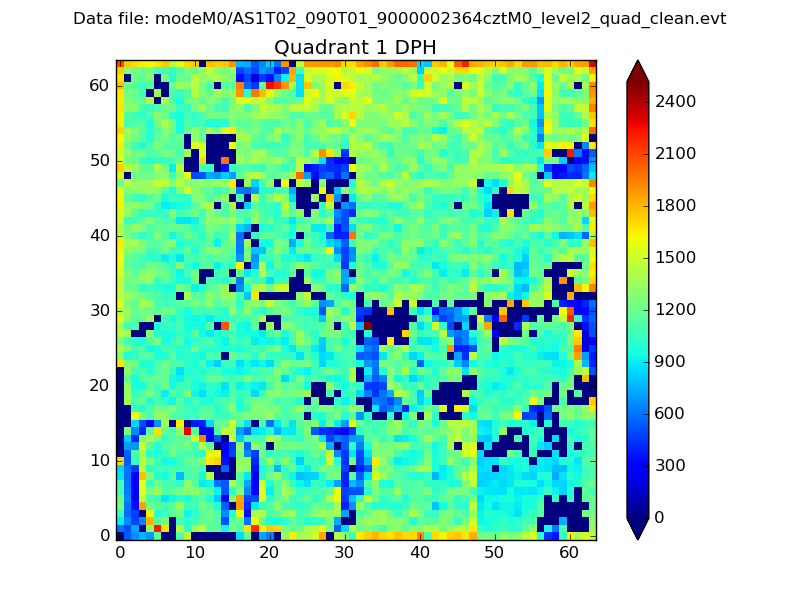
Histogram calculated using DETX and DETY for each event in the final _common_clean file
| Quadrant A |  |
 |
Quadrant B |
|---|---|---|---|
| Quadrant D |  |
 |
Quadrant C |
| Plot type | Count rate plots | Images |
|---|---|---|
| Comparison with Poisson distribution Blue bars denote a histogram of data divided into 1 sec bins. Red curve is a Poisson curve with rate = median count rate of data. |
 |
 |
| Quadrant-wise count rates Data is divided into 100 sec bins |
 |
|
| Module-wise count rates for Quadrant A Data is divided into 100 sec bins |
 |
 |
| Module-wise count rates for Quadrant B Data is divided into 100 sec bins |
 |
 |
| Module-wise count rates for Quadrant C Data is divided into 100 sec bins |
 |
 |
| Module-wise count rates for Quadrant D Data is divided into 100 sec bins |
 |
 |
| Parameter | Plot |
|---|---|
| CZT HV Monitor |  |
| D_VDD |  |
| Temperature 1 |  |
| Veto HV Monitor |  |
| Veto LLD |  |
| Alpha Counter |  |
| _CPM_Rate |  |
| CZT Counter |  |
| +2.5 Volts monitor |  |
| +5 Volts monitor |  |
| _ROLL_ROT |  |
| _Roll_DEC |  |
| _Roll_RA |  |
| Veto Counter |  |