| Param | Original file | Final file |
|---|---|---|
| Filename | modeM0/AS1T02_090T01_9000002364_16003cztM0_level2.evt | modeM0/AS1T02_090T01_9000002364_16003cztM0_level2_quad_clean.evt |
| Size (bytes) | 208,604,160 | 58,907,520 |
| Size | 198.9 MB | 56.2 MB |
| Events in quadrant A | 1,534,412 | 401,990 |
| Events in quadrant B | 1,575,317 | 404,316 |
| Events in quadrant C | 1,508,449 | 389,607 |
| Events in quadrant D | 1,501,114 | 381,716 |
| Mode M9 | |||
|---|---|---|---|
| Quadrant | BADHDUFLAG | Total packets | Discarded packets |
| A | 0 | 9 | 0 |
| B | 0 | 9 | 0 |
| C | 0 | 9 | 0 |
| D | 0 | 9 | 0 |
| Mode M0 | |||
|---|---|---|---|
| Quadrant | BADHDUFLAG | Total packets | Discarded packets |
| A | 0 | 6205 | 2 |
| B | 0 | 6269 | 1 |
| C | 0 | 6056 | 1 |
| D | 0 | 6179 | 1 |
| Mode SS | |||
|---|---|---|---|
| Quadrant | BADHDUFLAG | Total packets | Discarded packets |
| A | 0 | 58 | 0 |
| B | 0 | 58 | 0 |
| C | 0 | 58 | 0 |
| D | 0 | 58 | 0 |
| Quadrant | Total seconds | Saturated seconds | Saturation percentage |
|---|---|---|---|
| A | 2894 | 77 | 2.660677% |
| B | 2894 | 93 | 3.213545% |
| C | 2894 | 74 | 2.557015% |
| D | 2894 | 69 | 2.384243% |
Noise dominated data is calculated using 1-second bins in cleaned event files. If a bin has >2000 counts, and if more than 50% of those come from <1% of pixels, then it is considered to be noise-dominated and hence unusable.
| Quadrant | # 1 sec bins | Bins with >0 counts | Bins with >2000 counts | High rate bins dominated by noise | Noise dominated (total time) | Noise dominated (detector-on time) | Marked lightcurve |
|---|---|---|---|---|---|---|---|
| A | 3750 | 2895 | 3 | 3 | 0.08% | 0.10% | 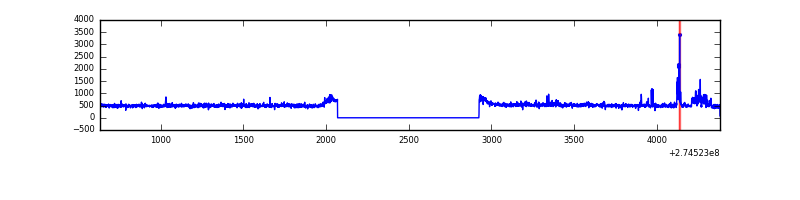 |
| B | 3750 | 2895 | 22 | 22 | 0.59% | 0.76% |  |
| C | 3750 | 2895 | 0 | 0 | 0.00% | 0.00% | 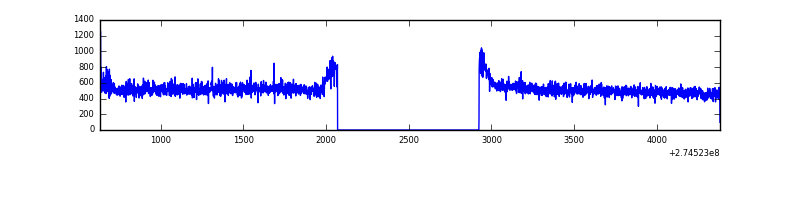 |
| D | 3749 | 2894 | 9 | 9 | 0.24% | 0.31% | 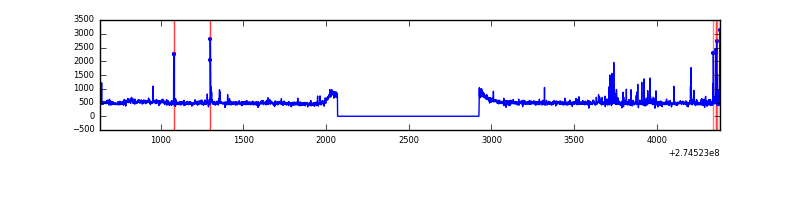 |
Top three noisy pixels from each quadrant. If the there are fewer than three noisy pixels in the level2.evt file, extra rows are filled as -1
| Pixel properties | Quadrant properties | ||||||
|---|---|---|---|---|---|---|---|
| Quadrant | DetID | PixID | Counts | Sigma | Mean | Median | Sigma |
| A | 10 | 253 | 63795 | 794.59 | 381 | 373 | 79.8 |
| A | 0 | 226 | 3430 | 38.3 | 381 | 373 | 79.8 |
| A | 12 | 194 | 2859 | 31.15 | 381 | 373 | 79.8 |
| B | 5 | 65 | 64566 | 848.64 | 379 | 369 | 75.6 |
| B | 0 | 245 | 9395 | 119.32 | 379 | 369 | 75.6 |
| B | 12 | 111 | 8396 | 106.11 | 379 | 369 | 75.6 |
| C | 14 | 238 | 55743 | 633.05 | 364 | 367 | 87.5 |
| C | 3 | 233 | 30334 | 342.58 | 364 | 367 | 87.5 |
| C | 13 | 61 | 2624 | 25.8 | 364 | 367 | 87.5 |
| D | 12 | 218 | 29137 | 309.85 | 370 | 359 | 92.9 |
| D | 7 | 223 | 28211 | 299.88 | 370 | 359 | 92.9 |
| D | 13 | 249 | 13846 | 145.21 | 370 | 359 | 92.9 |
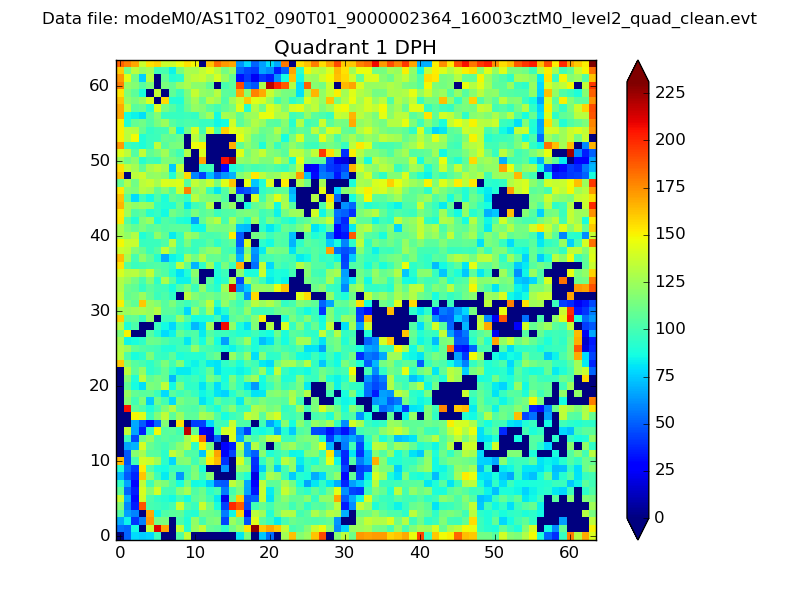
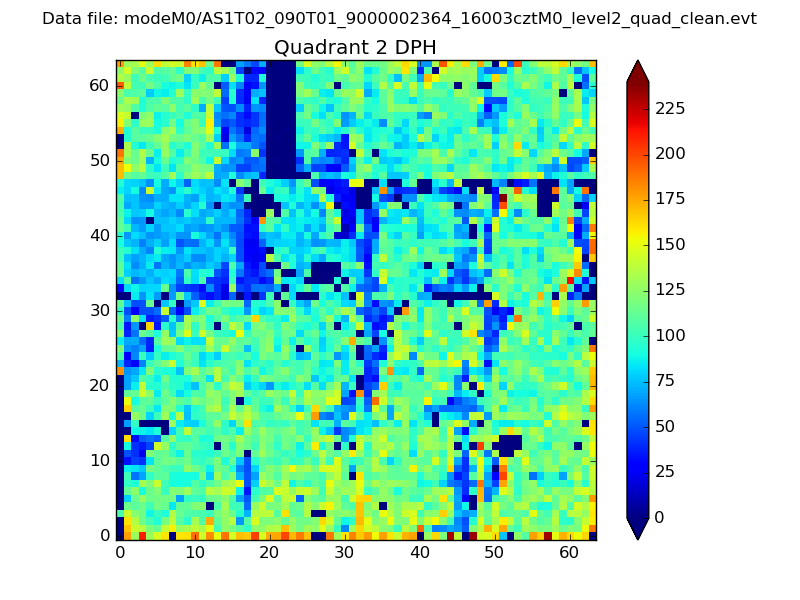
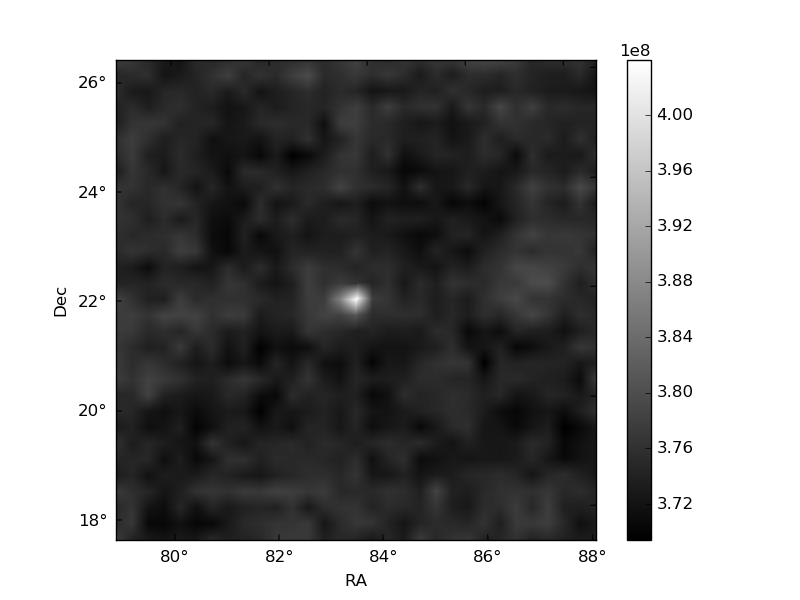
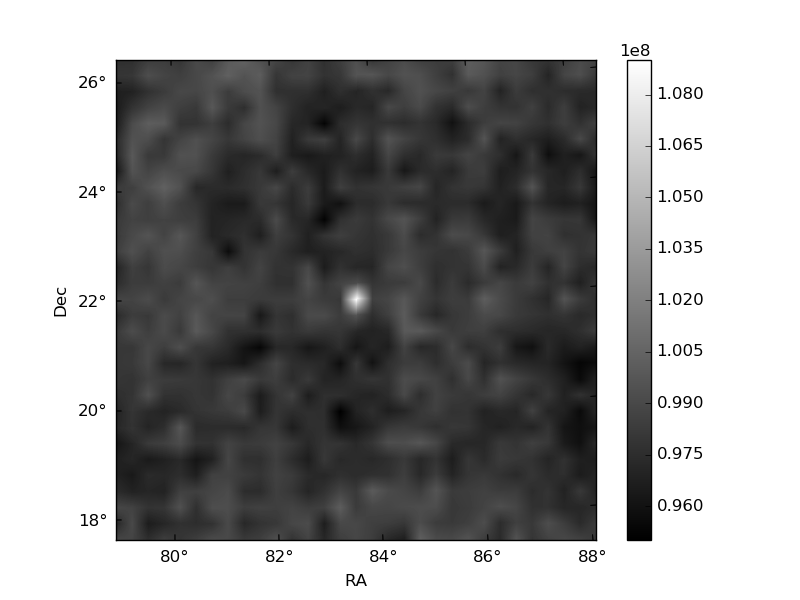
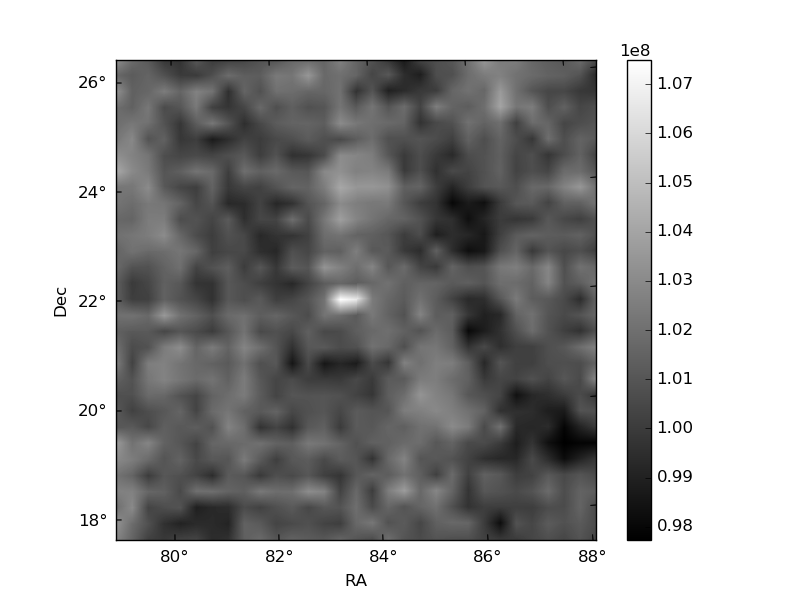
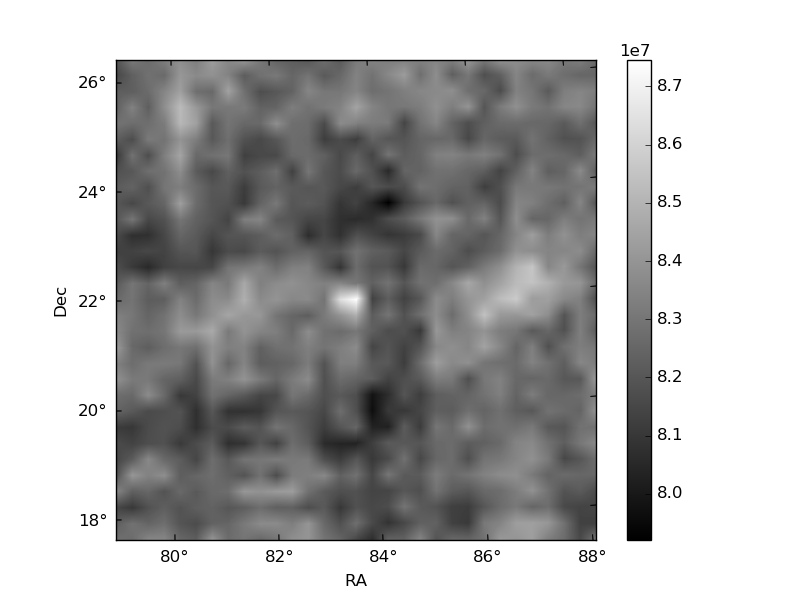
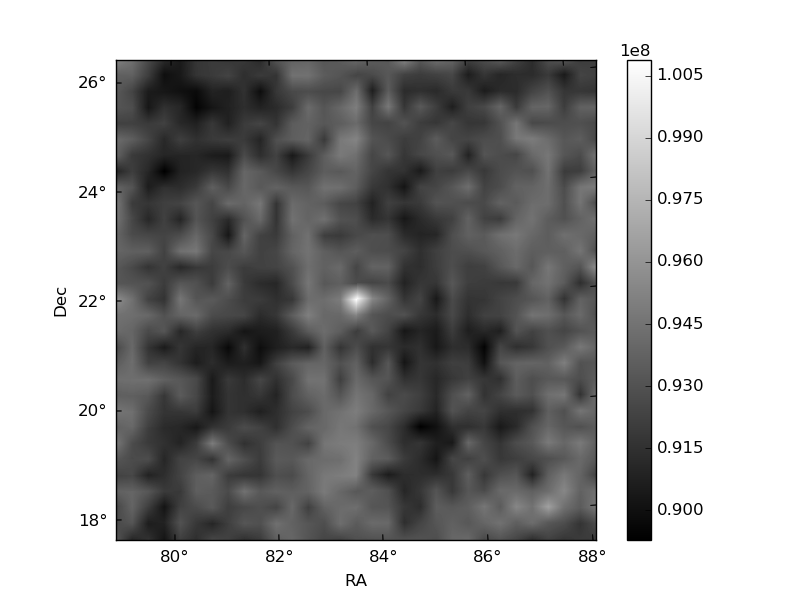
Histogram calculated using DETX and DETY for each event in the final _common_clean file
| Quadrant A | 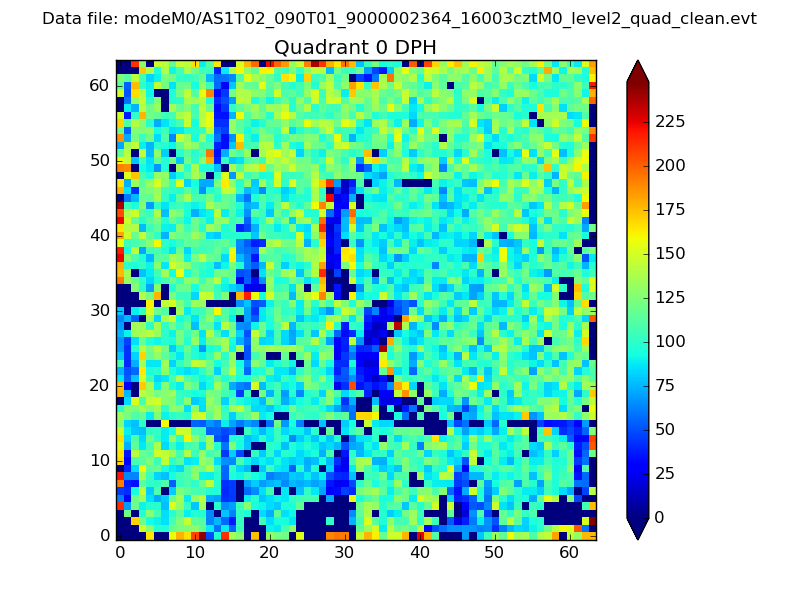 |
 |
Quadrant B |
|---|---|---|---|
| Quadrant D | 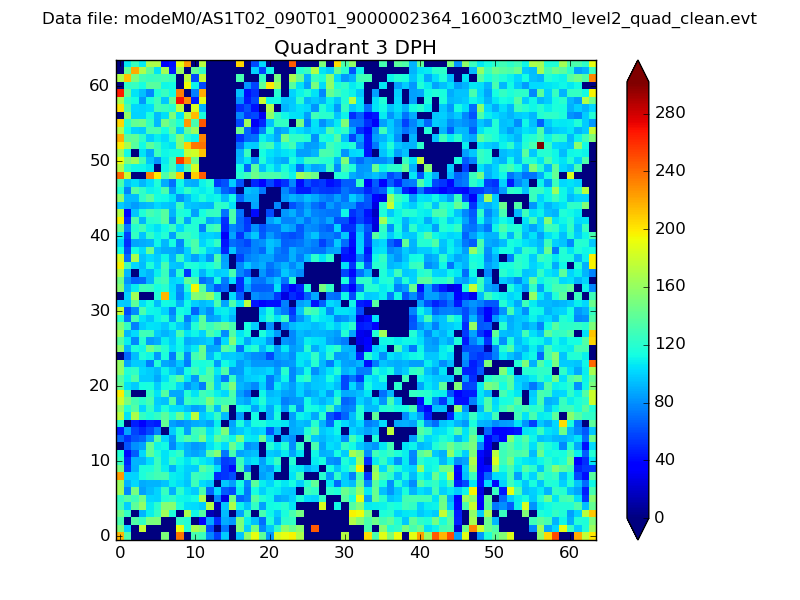 |
 |
Quadrant C |
| Plot type | Count rate plots | Images |
|---|---|---|
| Comparison with Poisson distribution Blue bars denote a histogram of data divided into 1 sec bins. Red curve is a Poisson curve with rate = median count rate of data. |
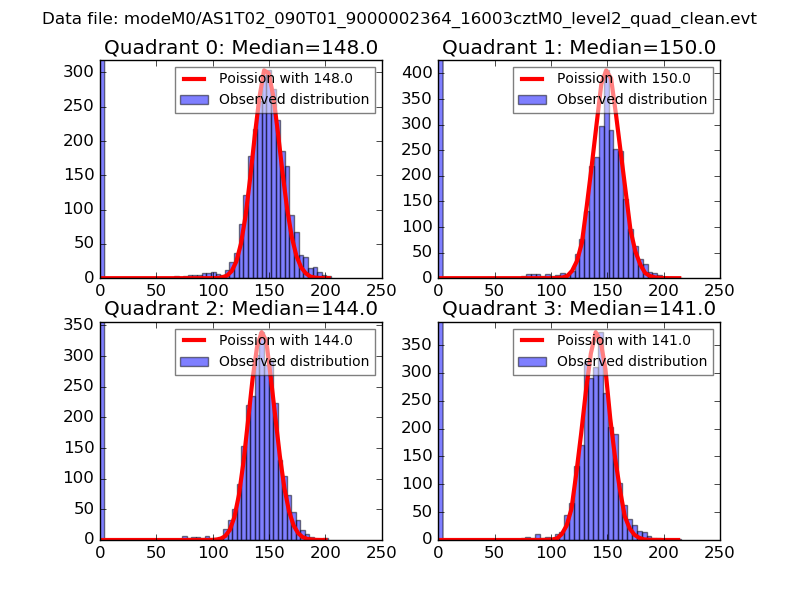 |
 |
| Quadrant-wise count rates Data is divided into 100 sec bins |
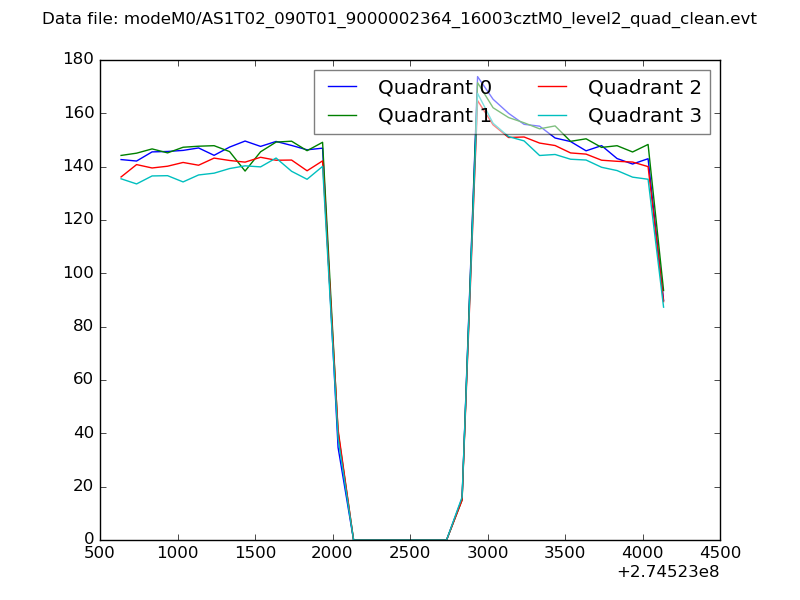 |
|
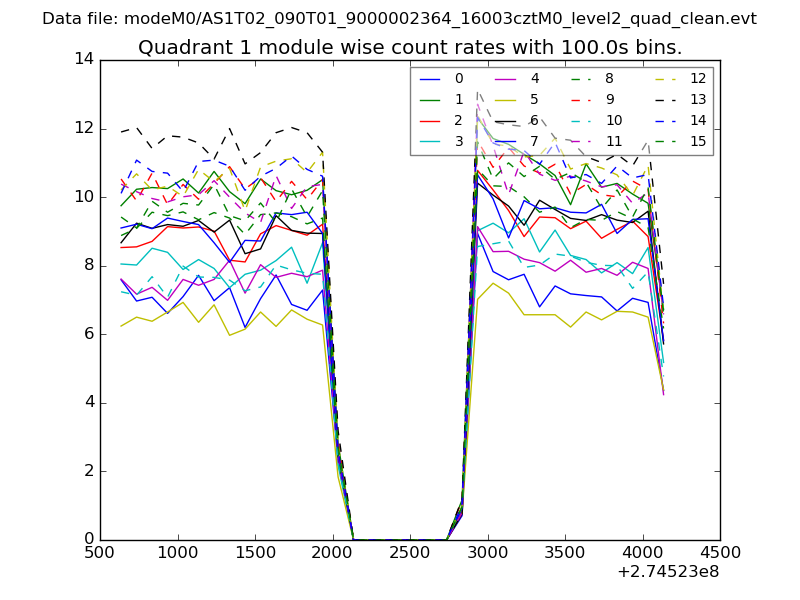
| Module-wise count rates for Quadrant A Data is divided into 100 sec bins |
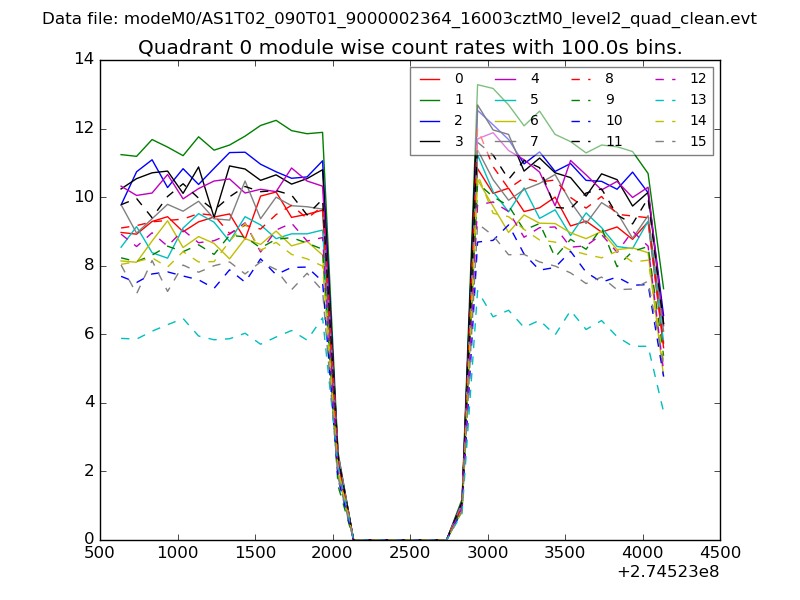 |
 |
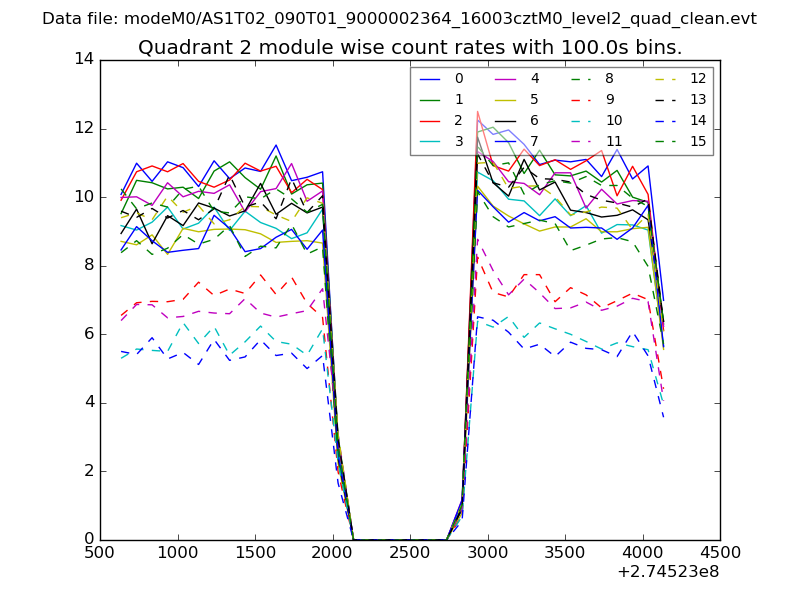
| Module-wise count rates for Quadrant B Data is divided into 100 sec bins |
 |
 |
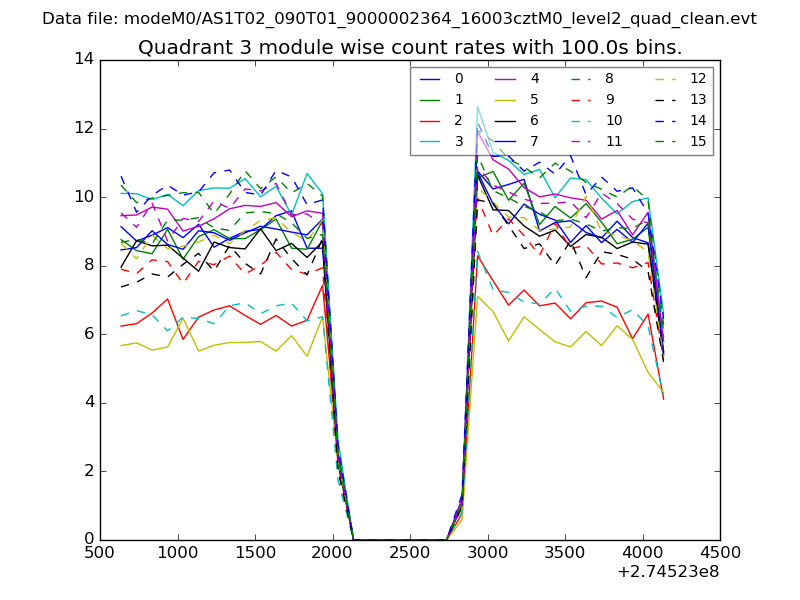
| Module-wise count rates for Quadrant C Data is divided into 100 sec bins |
 |
 |
| Module-wise count rates for Quadrant D Data is divided into 100 sec bins |
 |
 |
| Parameter | Plot |
|---|---|
| CZT HV Monitor | 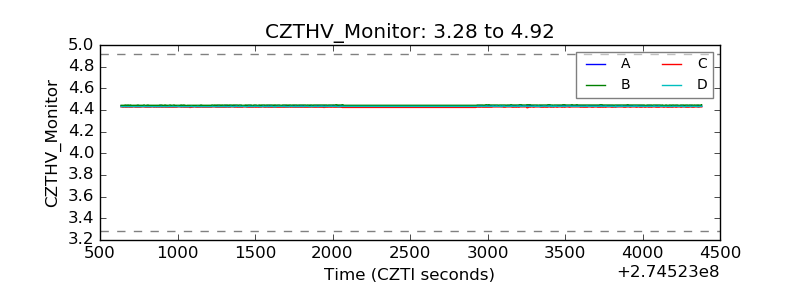 |
| D_VDD | 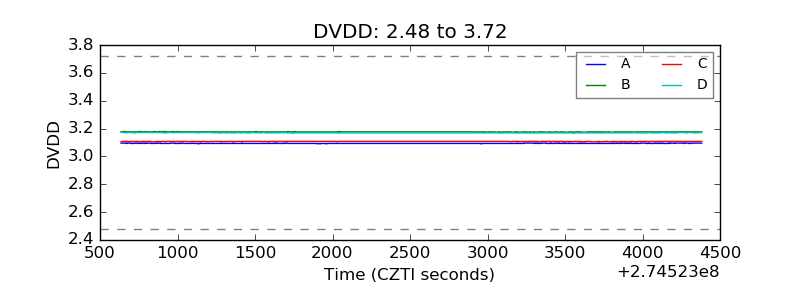 |
| Temperature 1 |  |
| Veto HV Monitor | 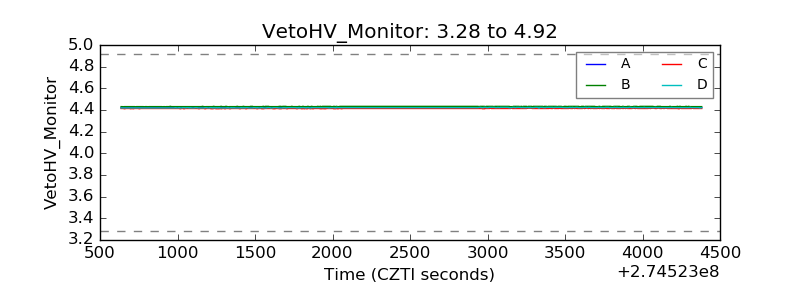 |
| Veto LLD |  |
| Alpha Counter | 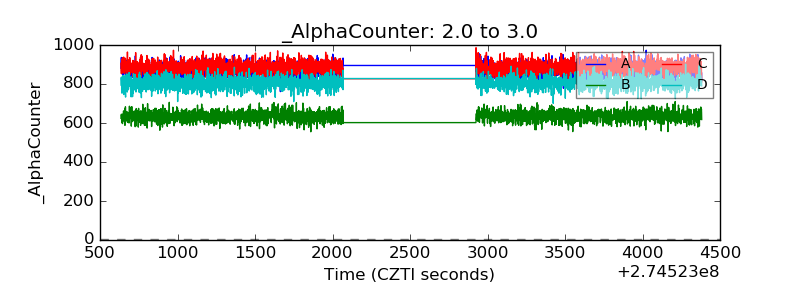 |
| _CPM_Rate | 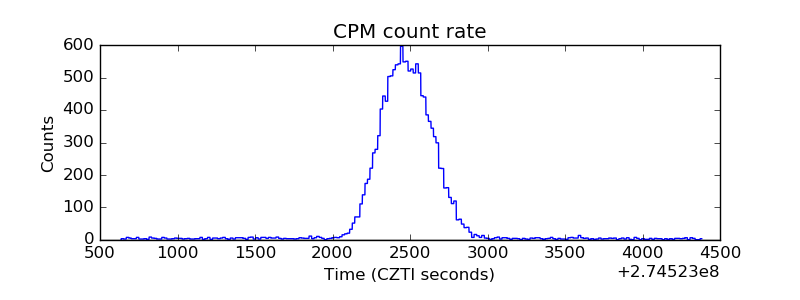 |
| CZT Counter | 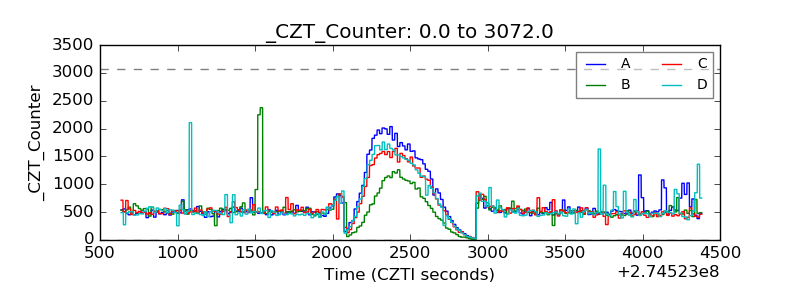 |
| +2.5 Volts monitor |  |
| +5 Volts monitor | 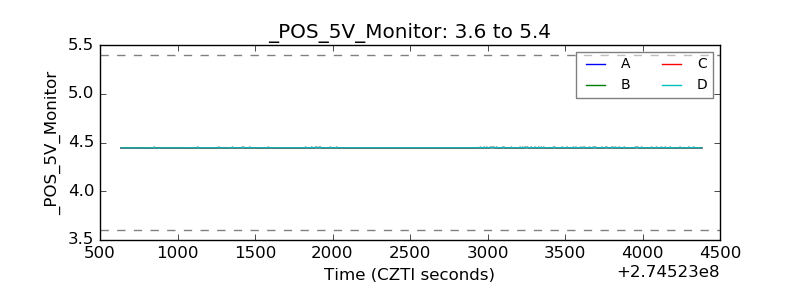 |
| _ROLL_ROT | 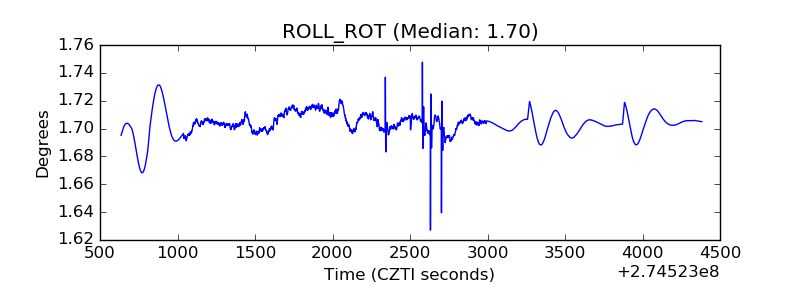 |
| _Roll_DEC | 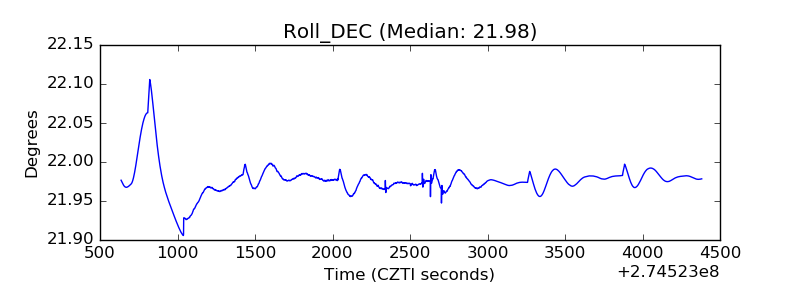 |
| _Roll_RA | 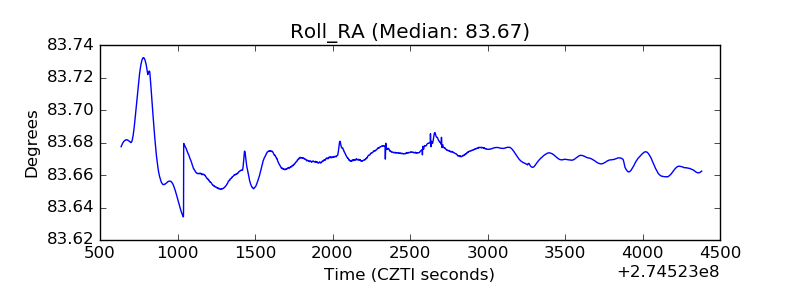 |
| Veto Counter | 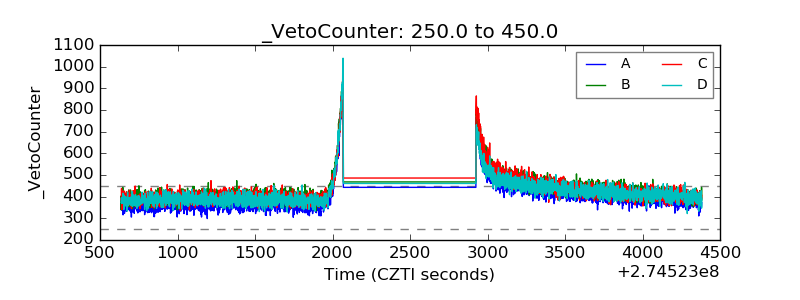 |