| Param | Original file | Final file |
|---|---|---|
| Filename | modeM0/AS1T02_090T01_9000002364_16004cztM0_level2.evt | modeM0/AS1T02_090T01_9000002364_16004cztM0_level2_quad_clean.evt |
| Size (bytes) | 463,464,000 | 83,802,240 |
| Size | 442.0 MB | 79.9 MB |
| Events in quadrant A | 3,114,254 | 538,867 |
| Events in quadrant B | 3,314,448 | 543,445 |
| Events in quadrant C | 3,184,527 | 519,366 |
| Events in quadrant D | 4,004,353 | 505,956 |
| Mode M9 | |||
|---|---|---|---|
| Quadrant | BADHDUFLAG | Total packets | Discarded packets |
| A | 0 | 10 | 0 |
| B | 0 | 10 | 0 |
| C | 0 | 10 | 0 |
| D | 0 | 10 | 0 |
| Mode M0 | |||
|---|---|---|---|
| Quadrant | BADHDUFLAG | Total packets | Discarded packets |
| A | 0 | 13015 | 2 |
| B | 0 | 13468 | 1 |
| C | 0 | 12947 | 1 |
| D | 0 | 15829 | 1 |
| Mode SS | |||
|---|---|---|---|
| Quadrant | BADHDUFLAG | Total packets | Discarded packets |
| A | 0 | 126 | 0 |
| B | 0 | 126 | 0 |
| C | 0 | 126 | 0 |
| D | 0 | 126 | 0 |
| Quadrant | Total seconds | Saturated seconds | Saturation percentage |
|---|---|---|---|
| A | 6158 | 70 | 1.136733% |
| B | 6158 | 94 | 1.526470% |
| C | 6158 | 88 | 1.429035% |
| D | 6158 | 245 | 3.978564% |
Noise dominated data is calculated using 1-second bins in cleaned event files. If a bin has >2000 counts, and if more than 50% of those come from <1% of pixels, then it is considered to be noise-dominated and hence unusable.
| Quadrant | # 1 sec bins | Bins with >0 counts | Bins with >2000 counts | High rate bins dominated by noise | Noise dominated (total time) | Noise dominated (detector-on time) | Marked lightcurve |
|---|---|---|---|---|---|---|---|
| A | 7179 | 6159 | 4 | 4 | 0.06% | 0.06% | 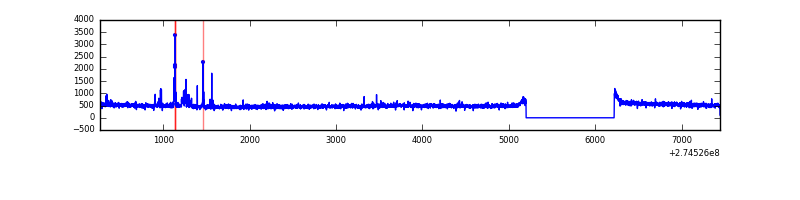 |
| B | 7179 | 6159 | 22 | 22 | 0.31% | 0.36% | 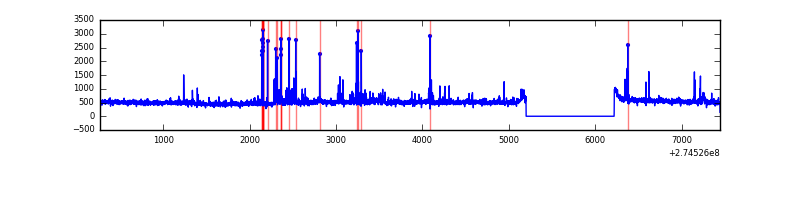 |
| C | 7179 | 6159 | 6 | 6 | 0.08% | 0.10% | 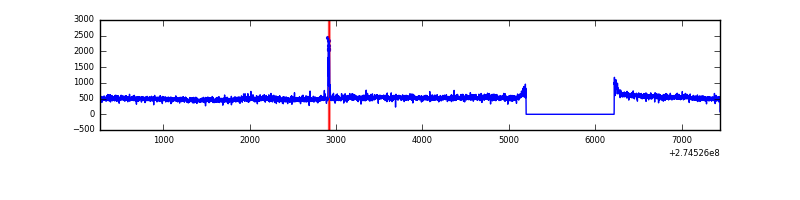 |
| D | 7179 | 6159 | 174 | 174 | 2.42% | 2.83% | 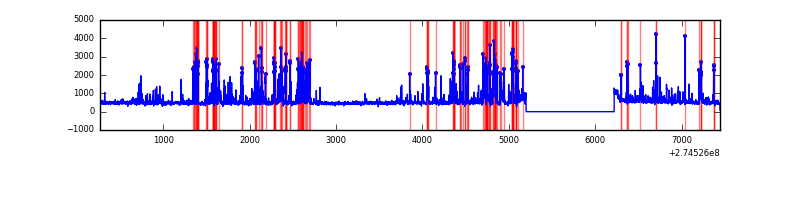 |
Top three noisy pixels from each quadrant. If the there are fewer than three noisy pixels in the level2.evt file, extra rows are filled as -1
| Pixel properties | Quadrant properties | ||||||
|---|---|---|---|---|---|---|---|
| Quadrant | DetID | PixID | Counts | Sigma | Mean | Median | Sigma |
| A | 10 | 253 | 63846 | 394.9 | 786 | 772 | 159.7 |
| A | 15 | 174 | 10772 | 62.61 | 786 | 772 | 159.7 |
| A | 13 | 210 | 9989 | 57.71 | 786 | 772 | 159.7 |
| B | 7 | 220 | 117147 | 784.6 | 778 | 760 | 148.3 |
| B | 5 | 65 | 54806 | 364.34 | 778 | 760 | 148.3 |
| B | 3 | 209 | 30736 | 202.08 | 778 | 760 | 148.3 |
| C | 3 | 233 | 161952 | 920.59 | 745 | 751 | 175.1 |
| C | 14 | 238 | 115802 | 657.04 | 745 | 751 | 175.1 |
| C | 13 | 61 | 5361 | 26.33 | 745 | 751 | 175.1 |
| D | 12 | 218 | 936016 | 5037.51 | 754 | 733 | 185.7 |
| D | 7 | 223 | 60080 | 319.65 | 754 | 733 | 185.7 |
| D | 10 | 70 | 46092 | 244.31 | 754 | 733 | 185.7 |
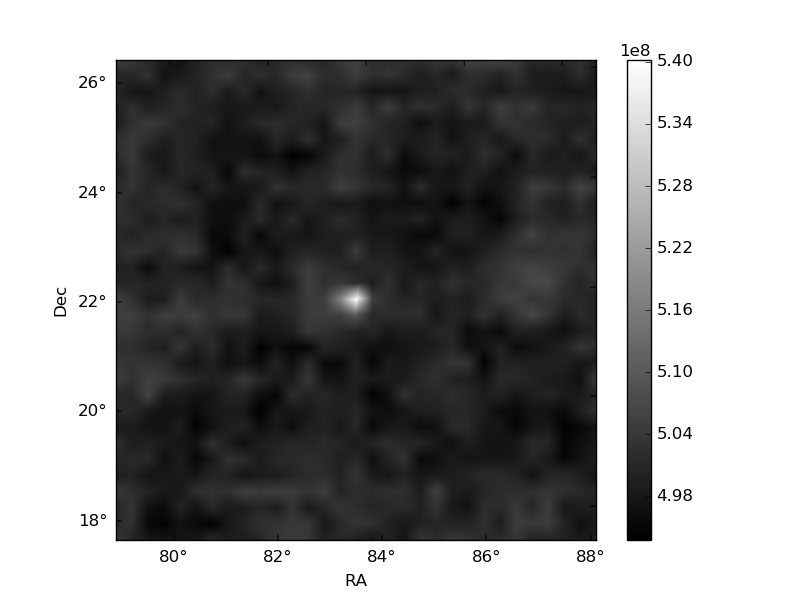
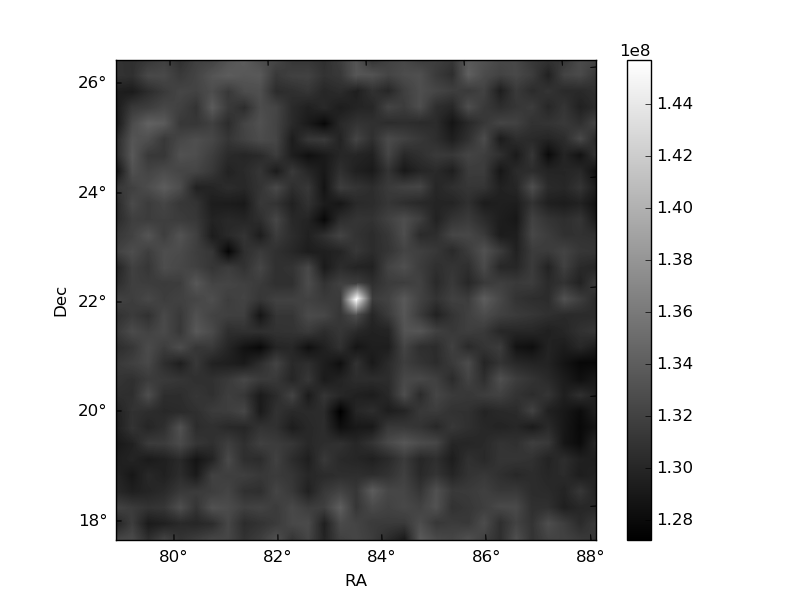
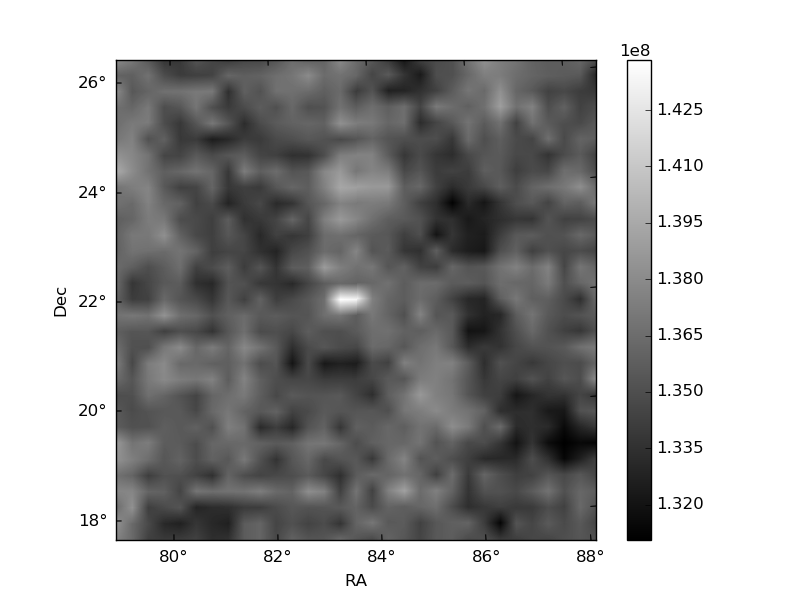
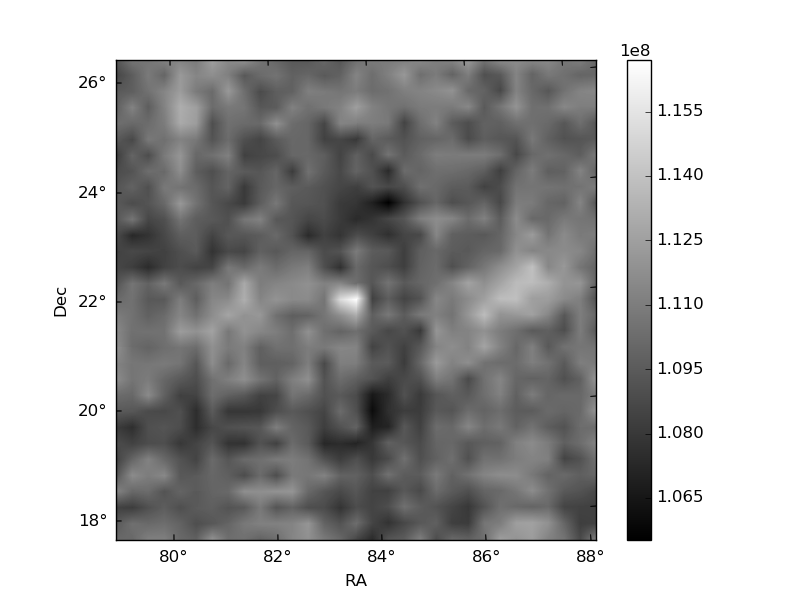
Histogram calculated using DETX and DETY for each event in the final _common_clean file
| Quadrant A | 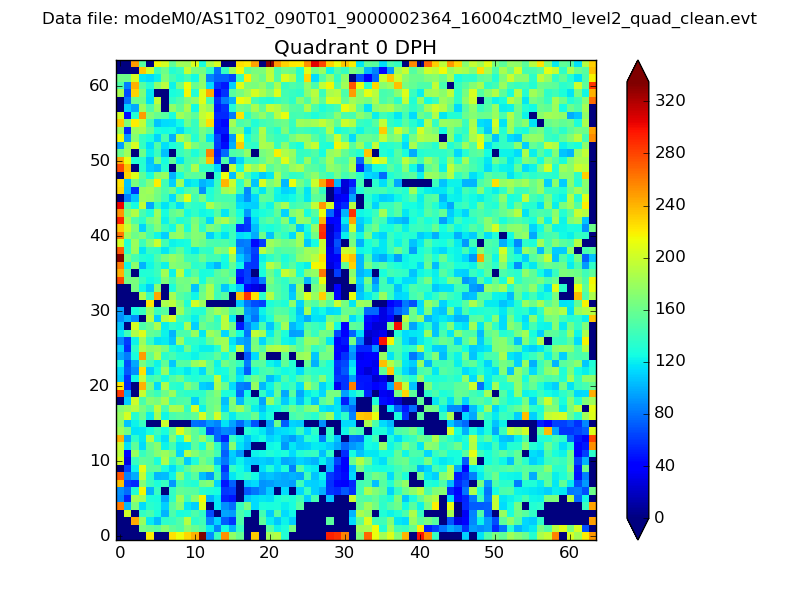 |
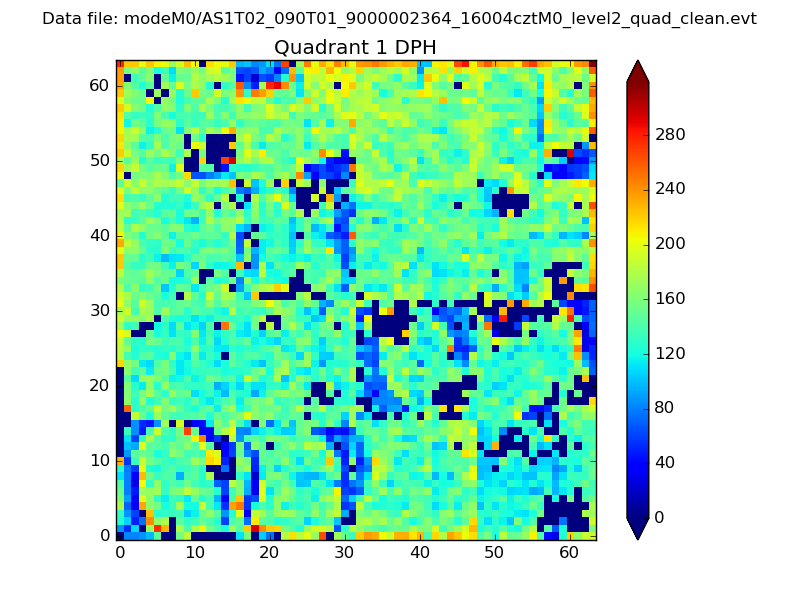 |
Quadrant B |
|---|---|---|---|
| Quadrant D | 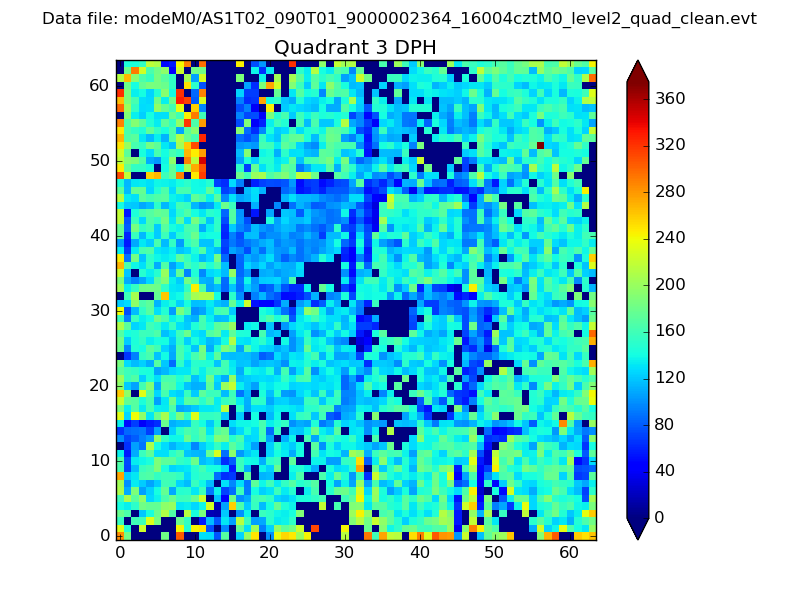 |
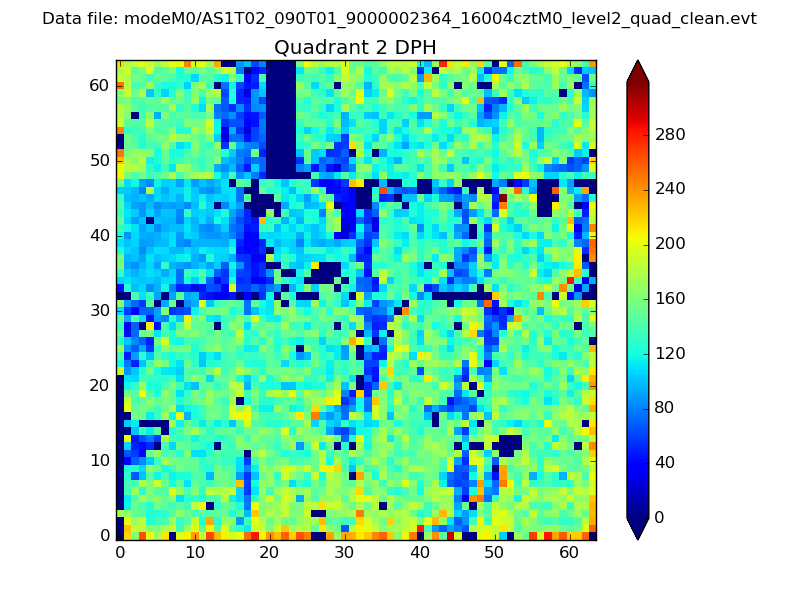 |
Quadrant C |
| Plot type | Count rate plots | Images |
|---|---|---|
| Comparison with Poisson distribution Blue bars denote a histogram of data divided into 1 sec bins. Red curve is a Poisson curve with rate = median count rate of data. |
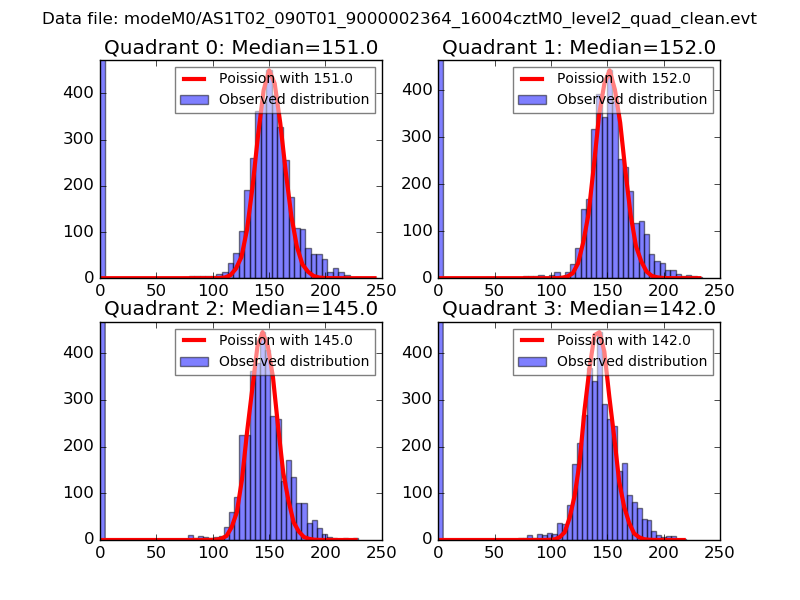 |
 |
| Quadrant-wise count rates Data is divided into 100 sec bins |
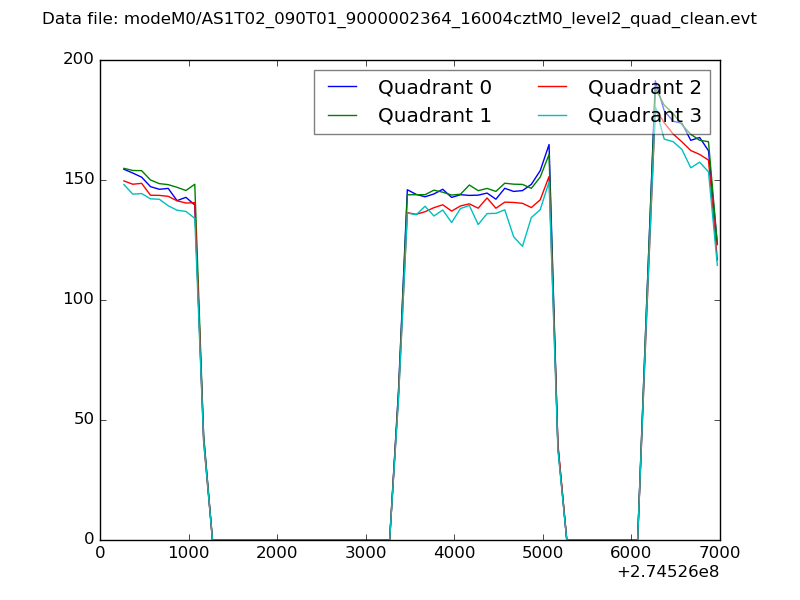 |
|
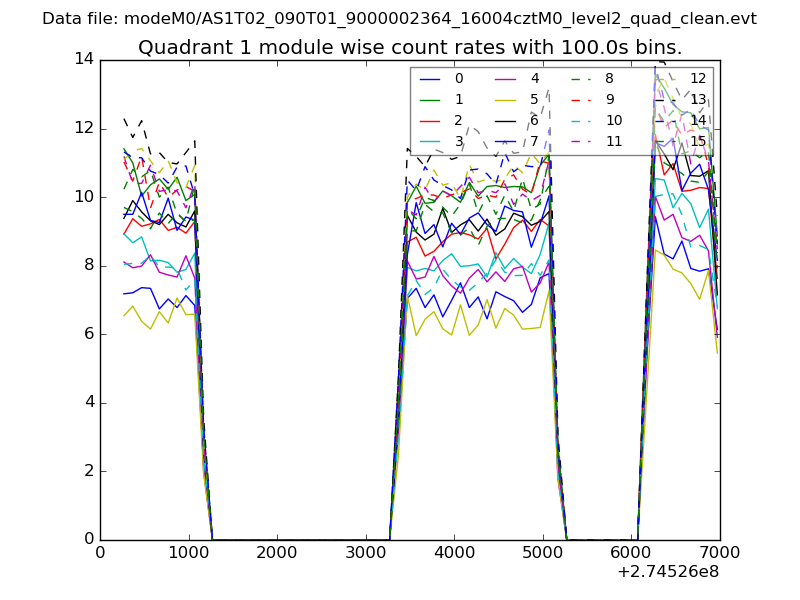
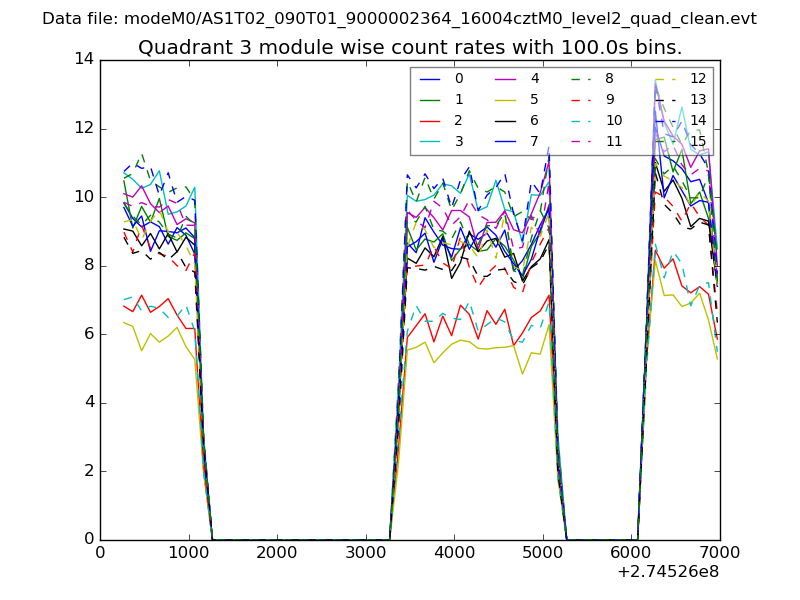
| Module-wise count rates for Quadrant A Data is divided into 100 sec bins |
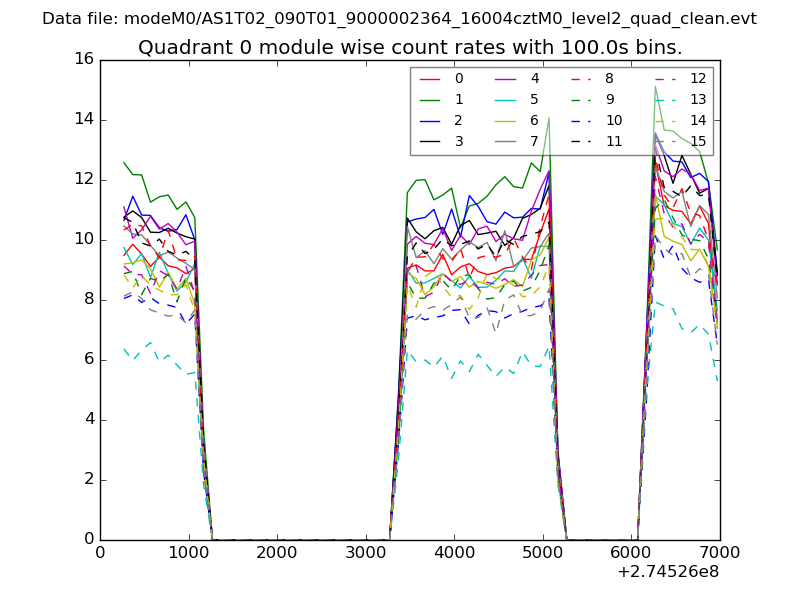 |
 |
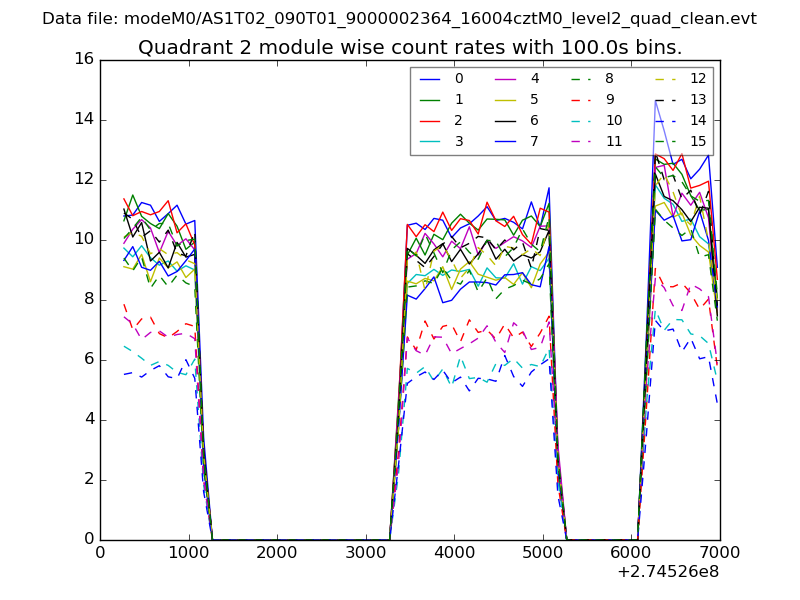
| Module-wise count rates for Quadrant B Data is divided into 100 sec bins |
 |
 |
| Module-wise count rates for Quadrant C Data is divided into 100 sec bins |
 |
 |
| Module-wise count rates for Quadrant D Data is divided into 100 sec bins |
 |
 |
| Parameter | Plot |
|---|---|
| CZT HV Monitor | 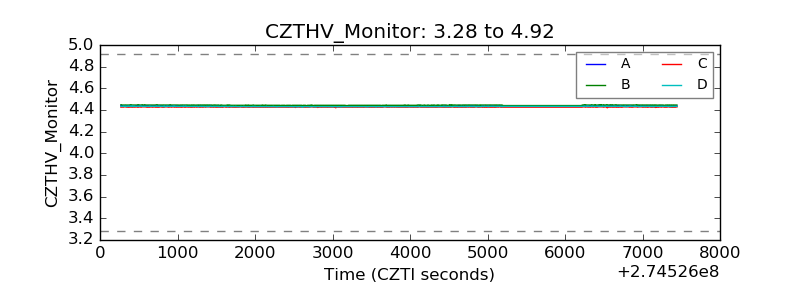 |
| D_VDD | 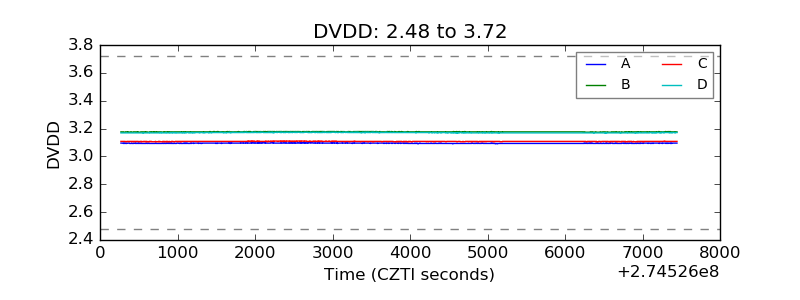 |
| Temperature 1 |  |
| Veto HV Monitor | 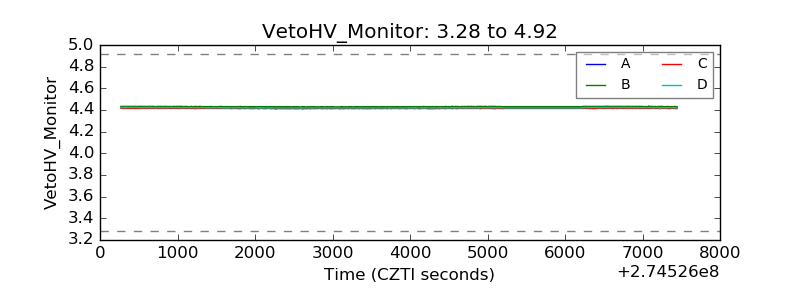 |
| Veto LLD | 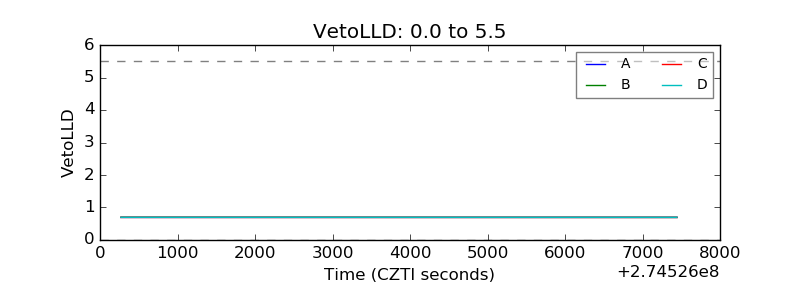 |
| Alpha Counter | 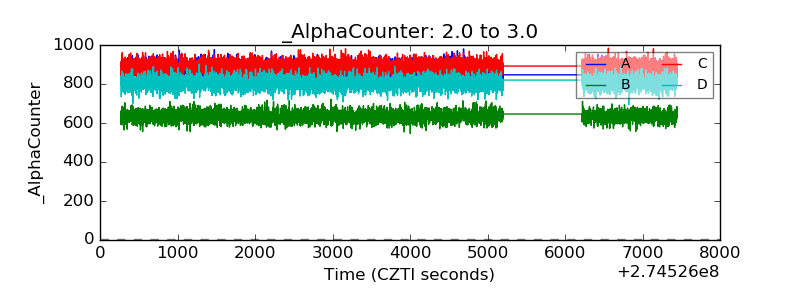 |
| _CPM_Rate | 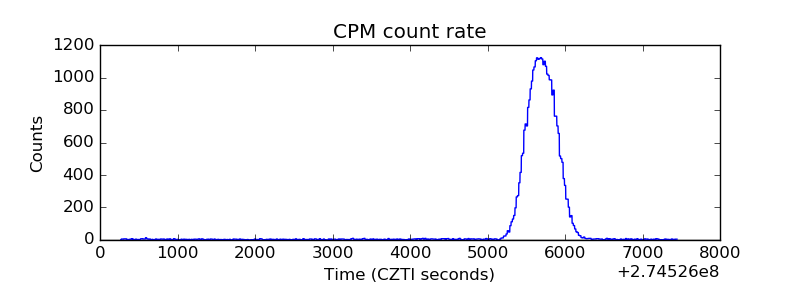 |
| CZT Counter | 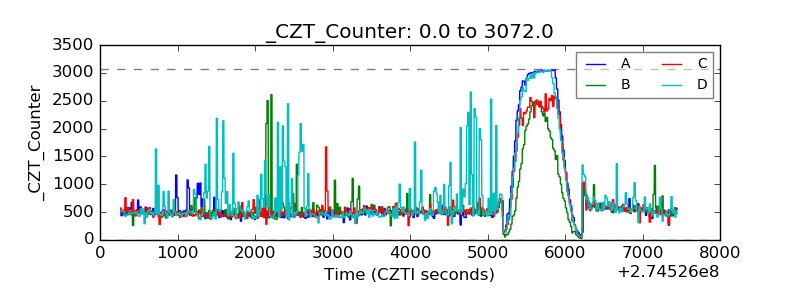 |
| +2.5 Volts monitor |  |
| +5 Volts monitor | 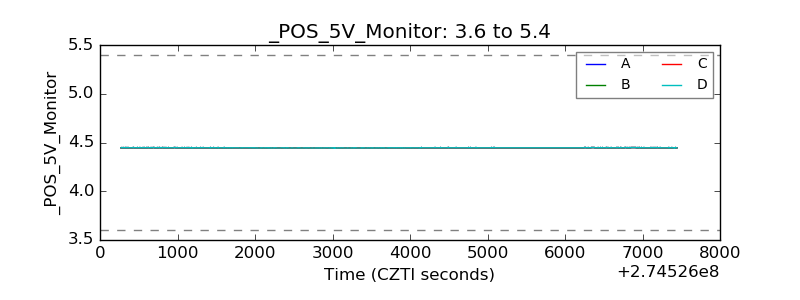 |
| _ROLL_ROT |  |
| _Roll_DEC | 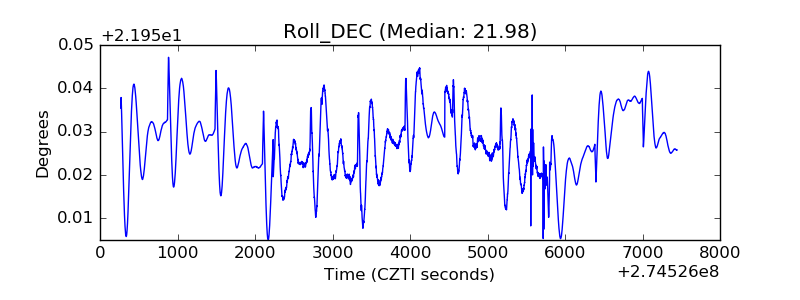 |
| _Roll_RA | 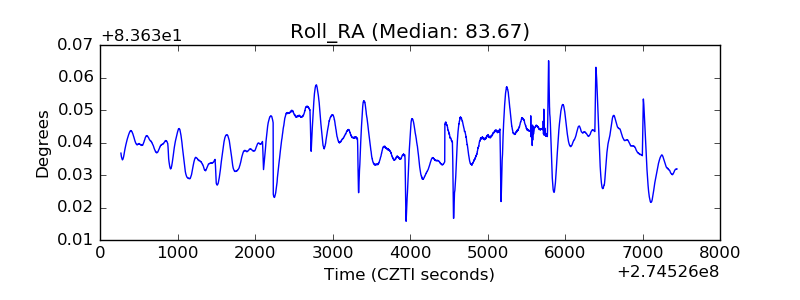 |
| Veto Counter | 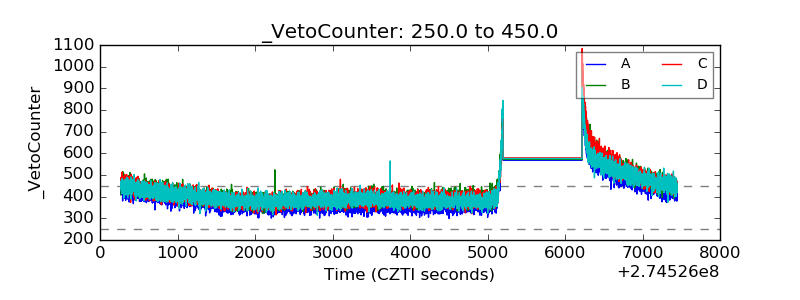 |