| Param | Original file | Final file |
|---|---|---|
| Filename | modeM0/AS1T02_090T01_9000002364_16006cztM0_level2.evt | modeM0/AS1T02_090T01_9000002364_16006cztM0_level2_quad_clean.evt |
| Size (bytes) | 498,021,120 | 82,857,600 |
| Size | 474.9 MB | 79.0 MB |
| Events in quadrant A | 3,431,961 | 523,648 |
| Events in quadrant B | 3,657,529 | 524,251 |
| Events in quadrant C | 3,601,713 | 503,572 |
| Events in quadrant D | 3,940,822 | 494,836 |
| Mode M9 | |||
|---|---|---|---|
| Quadrant | BADHDUFLAG | Total packets | Discarded packets |
| A | 0 | 14 | 0 |
| B | 0 | 14 | 0 |
| C | 0 | 14 | 0 |
| D | 0 | 15 | 0 |
| Mode M0 | |||
|---|---|---|---|
| Quadrant | BADHDUFLAG | Total packets | Discarded packets |
| A | 0 | 14283 | 3 |
| B | 0 | 14910 | 2 |
| C | 0 | 14501 | 2 |
| D | 0 | 16068 | 2 |
| Mode SS | |||
|---|---|---|---|
| Quadrant | BADHDUFLAG | Total packets | Discarded packets |
| A | 0 | 134 | 0 |
| B | 0 | 134 | 0 |
| C | 0 | 134 | 0 |
| D | 0 | 134 | 0 |
| Quadrant | Total seconds | Saturated seconds | Saturation percentage |
|---|---|---|---|
| A | 6639 | 93 | 1.400813% |
| B | 6639 | 120 | 1.807501% |
| C | 6639 | 121 | 1.822564% |
| D | 6639 | 204 | 3.072752% |
Noise dominated data is calculated using 1-second bins in cleaned event files. If a bin has >2000 counts, and if more than 50% of those come from <1% of pixels, then it is considered to be noise-dominated and hence unusable.
| Quadrant | # 1 sec bins | Bins with >0 counts | Bins with >2000 counts | High rate bins dominated by noise | Noise dominated (total time) | Noise dominated (detector-on time) | Marked lightcurve |
|---|---|---|---|---|---|---|---|
| A | 7810 | 6640 | 0 | 0 | 0.00% | 0.00% | 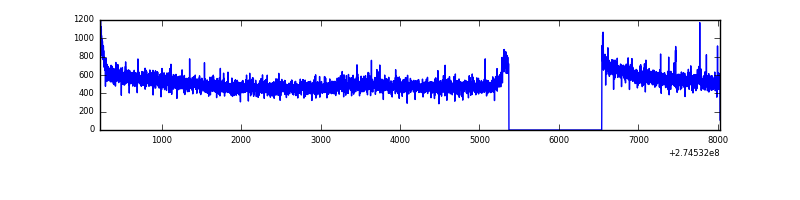 |
| B | 7810 | 6640 | 14 | 14 | 0.18% | 0.21% | 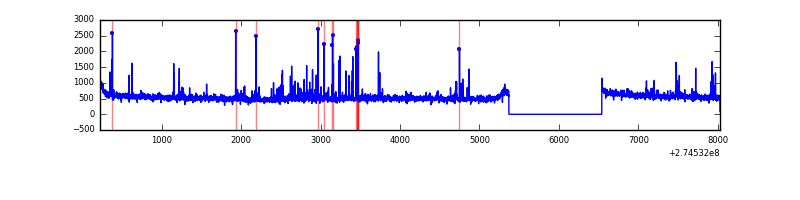 |
| C | 7810 | 6640 | 1 | 1 | 0.01% | 0.02% | 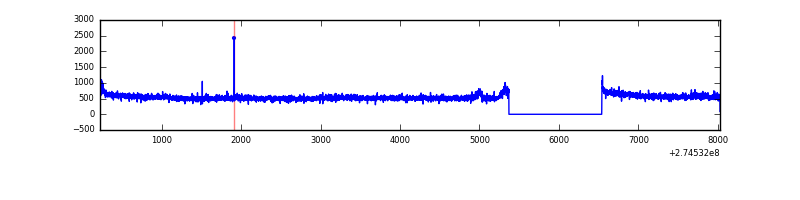 |
| D | 7810 | 6640 | 108 | 108 | 1.38% | 1.63% | 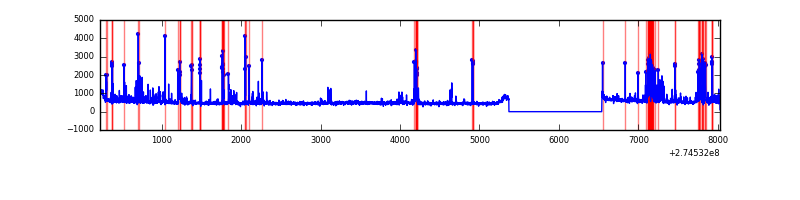 |
Top three noisy pixels from each quadrant. If the there are fewer than three noisy pixels in the level2.evt file, extra rows are filled as -1
| Pixel properties | Quadrant properties | ||||||
|---|---|---|---|---|---|---|---|
| Quadrant | DetID | PixID | Counts | Sigma | Mean | Median | Sigma |
| A | 0 | 226 | 8182 | 40.91 | 889 | 873 | 178.6 |
| A | 12 | 194 | 6668 | 32.44 | 889 | 873 | 178.6 |
| A | 15 | 157 | 6404 | 30.96 | 889 | 873 | 178.6 |
| B | 5 | 65 | 63567 | 379.31 | 878 | 860 | 165.3 |
| B | 7 | 220 | 34097 | 201.05 | 878 | 860 | 165.3 |
| B | 10 | 245 | 29138 | 171.05 | 878 | 860 | 165.3 |
| C | 3 | 233 | 154722 | 784.58 | 844 | 851 | 196.1 |
| C | 14 | 238 | 132147 | 669.47 | 844 | 851 | 196.1 |
| C | 9 | 54 | 14420 | 69.19 | 844 | 851 | 196.1 |
| D | 12 | 218 | 497072 | 2379.77 | 858 | 836 | 208.5 |
| D | 10 | 70 | 83046 | 394.25 | 858 | 836 | 208.5 |
| D | 2 | 234 | 26330 | 122.26 | 858 | 836 | 208.5 |
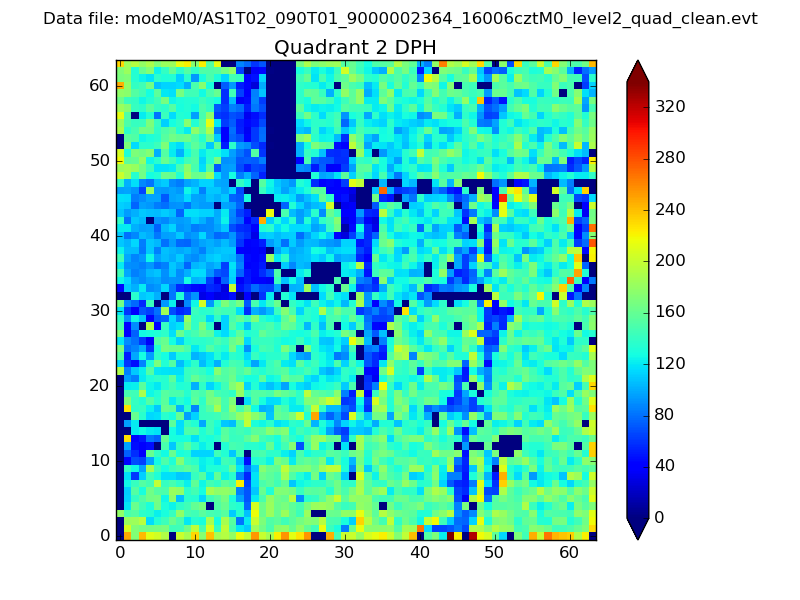
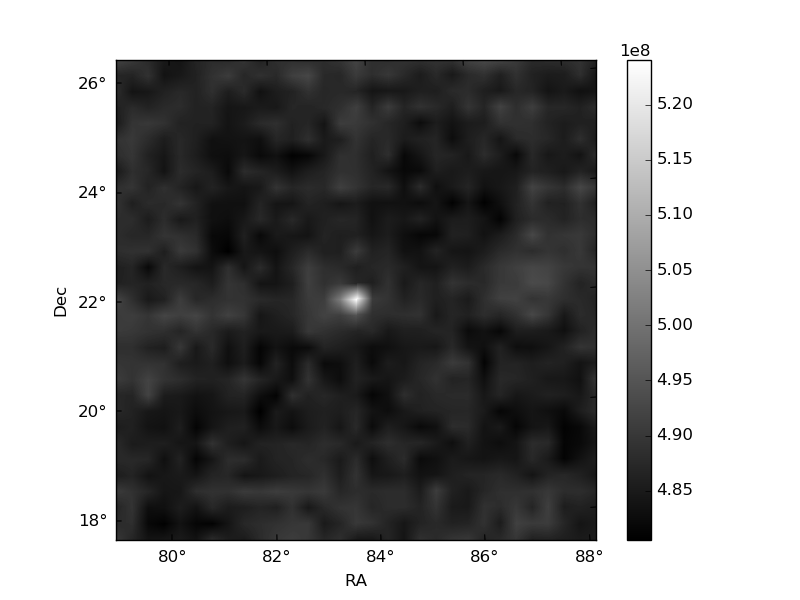
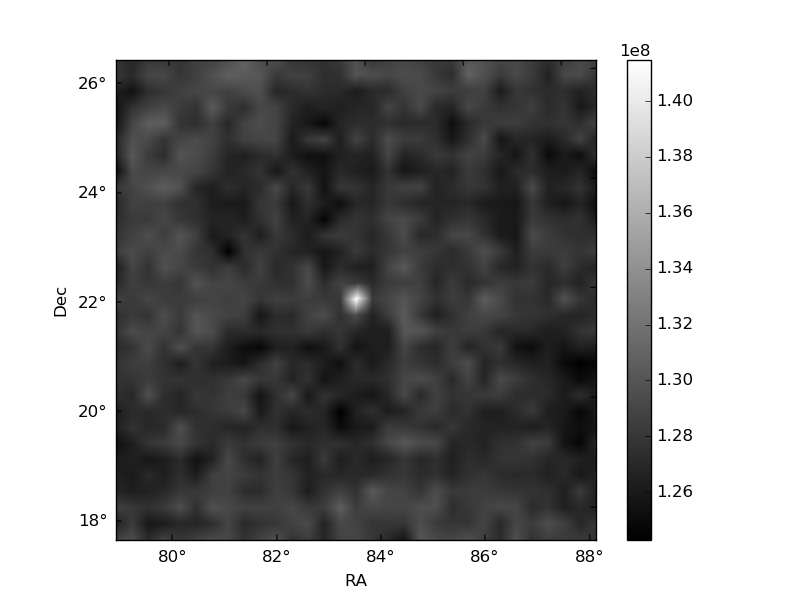
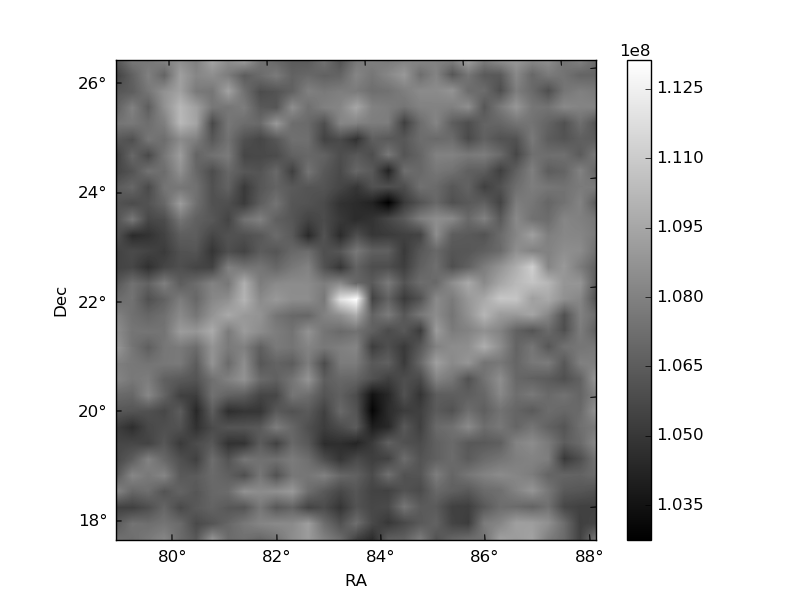
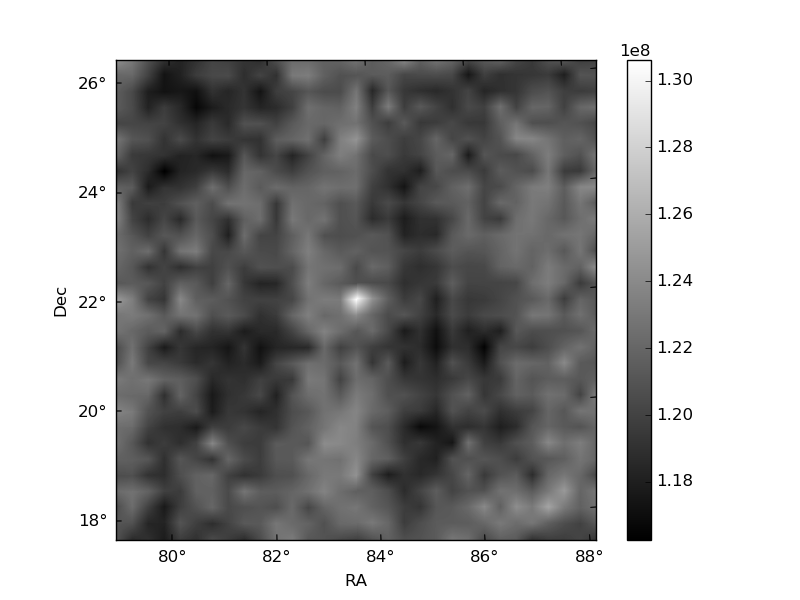
Histogram calculated using DETX and DETY for each event in the final _common_clean file
| Quadrant A | 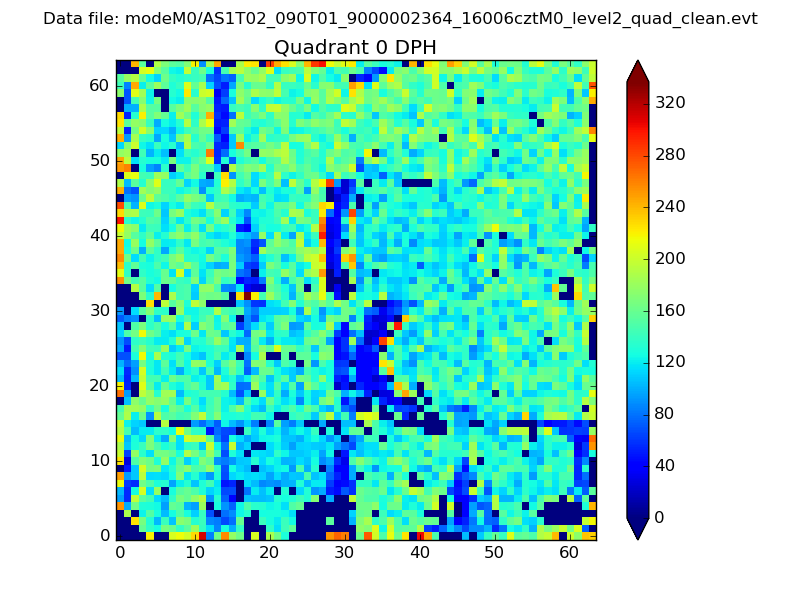 |
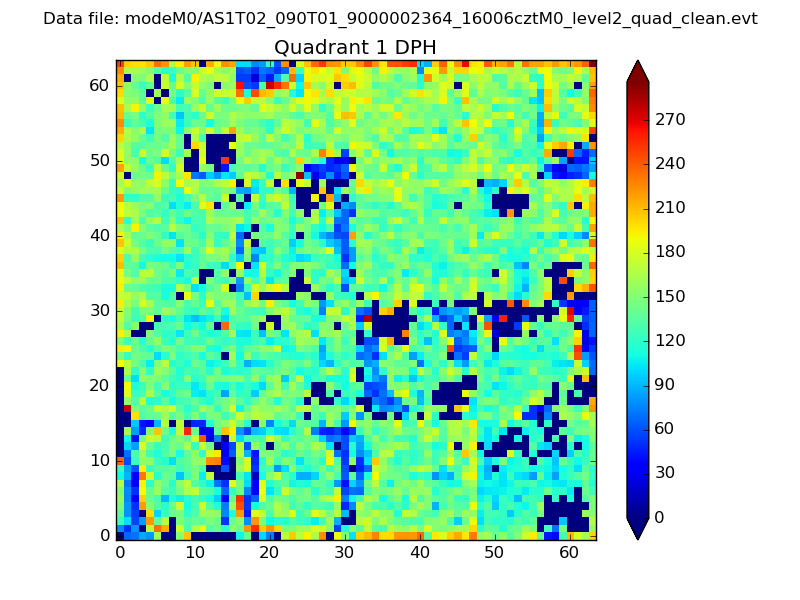 |
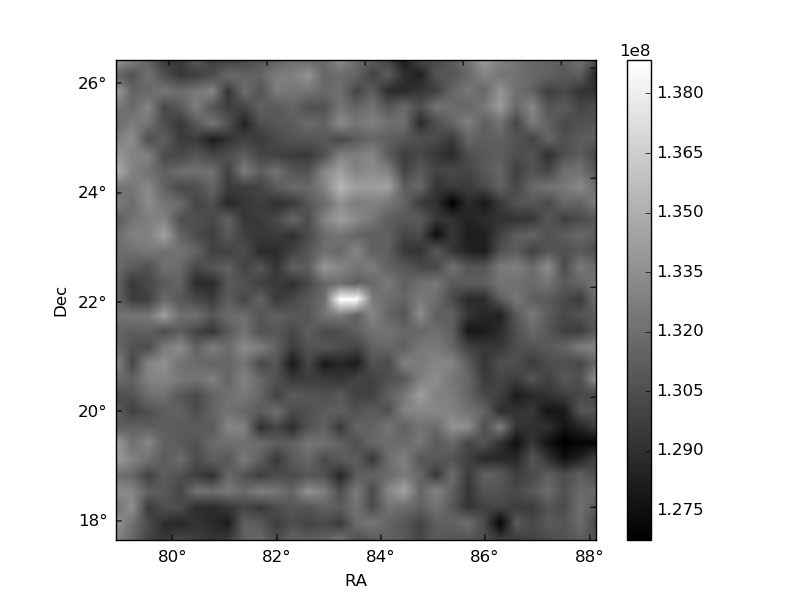
Quadrant B |
|---|---|---|---|
| Quadrant D | 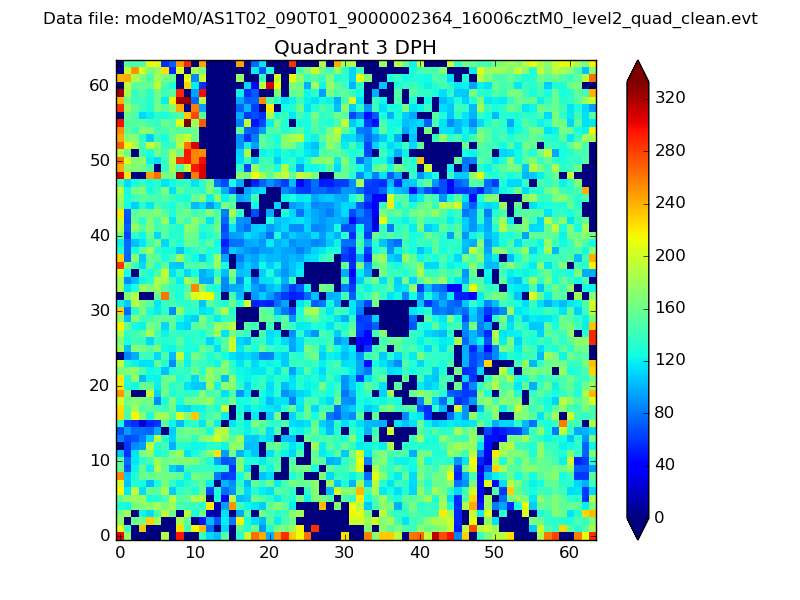 |
 |
Quadrant C |
| Plot type | Count rate plots | Images |
|---|---|---|
| Comparison with Poisson distribution Blue bars denote a histogram of data divided into 1 sec bins. Red curve is a Poisson curve with rate = median count rate of data. |
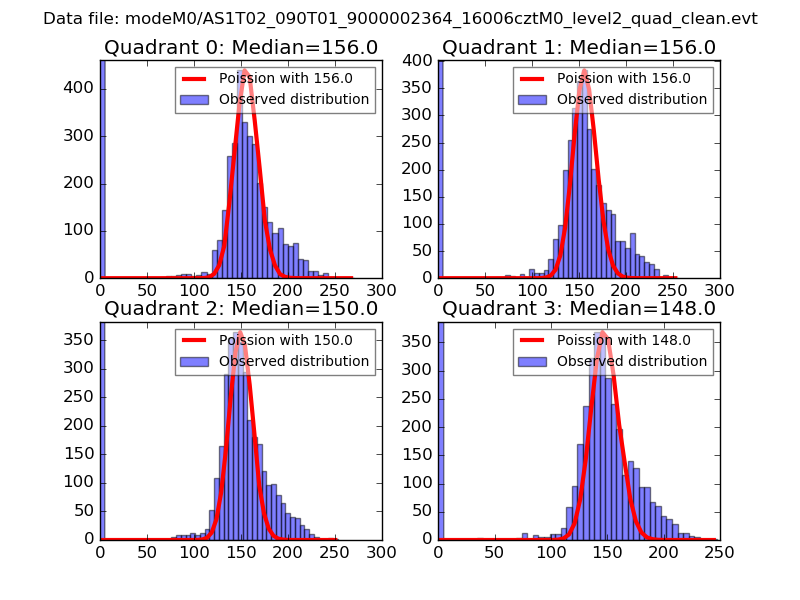 |
 |
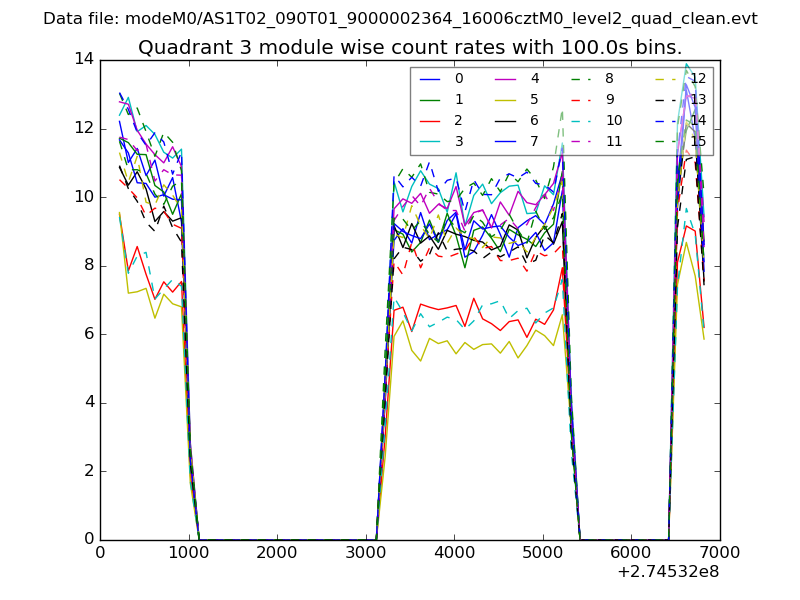
| Quadrant-wise count rates Data is divided into 100 sec bins |
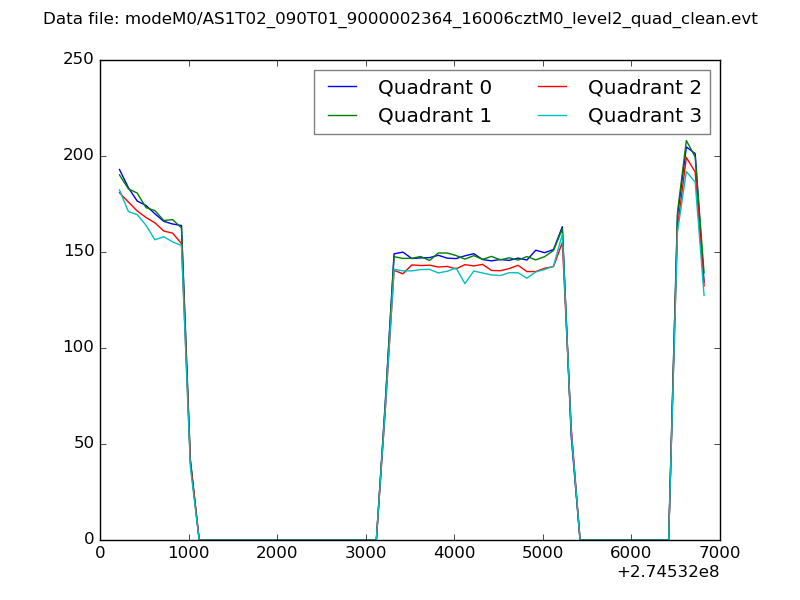 |
|
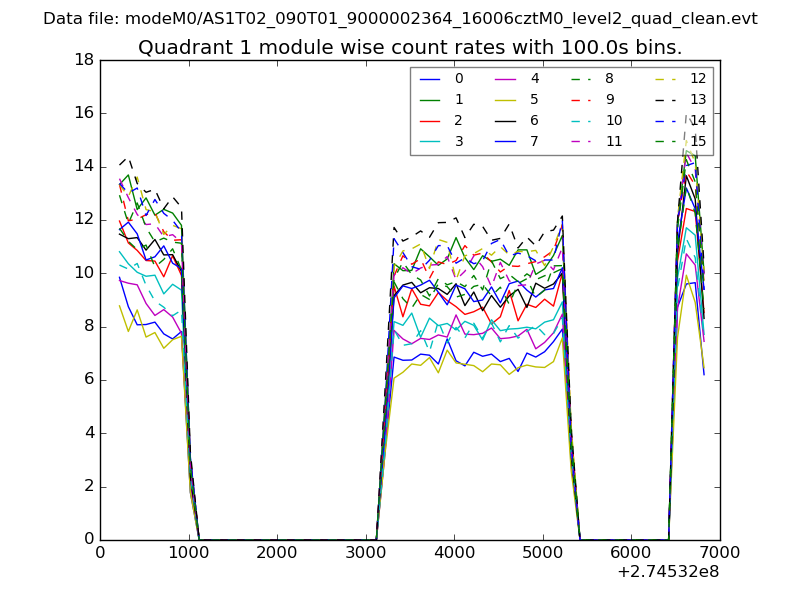
| Module-wise count rates for Quadrant A Data is divided into 100 sec bins |
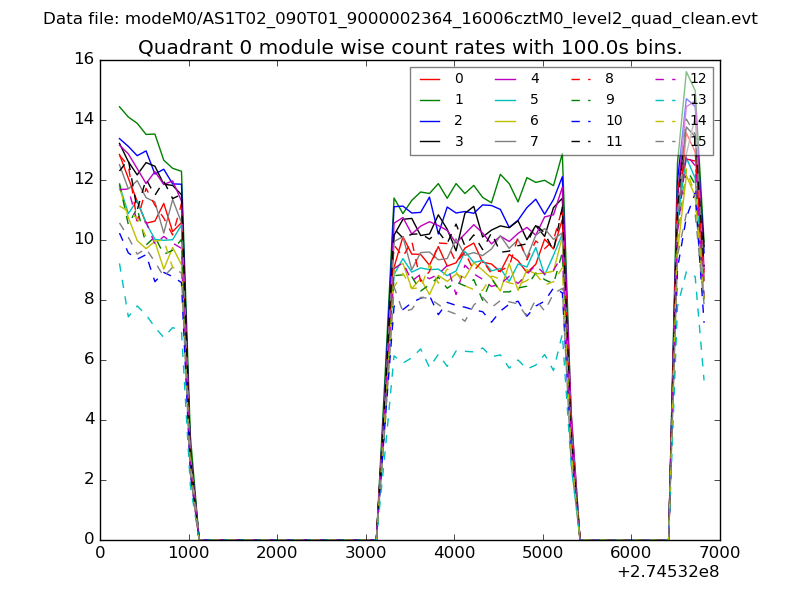 |
 |
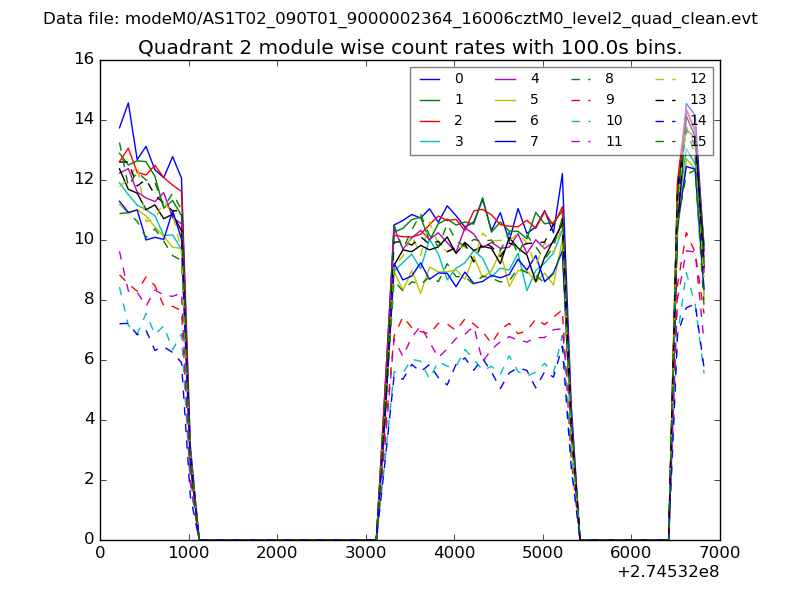
| Module-wise count rates for Quadrant B Data is divided into 100 sec bins |
 |
 |
| Module-wise count rates for Quadrant C Data is divided into 100 sec bins |
 |
 |
| Module-wise count rates for Quadrant D Data is divided into 100 sec bins |
 |
 |
| Parameter | Plot |
|---|---|
| CZT HV Monitor | 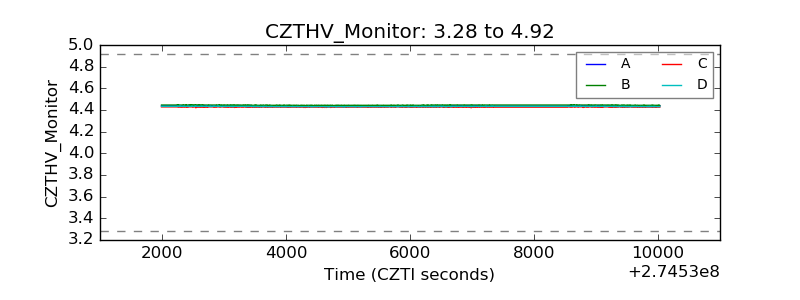 |
| D_VDD | 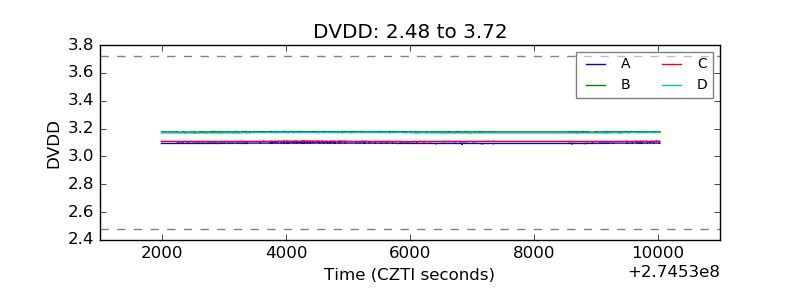 |
| Temperature 1 | 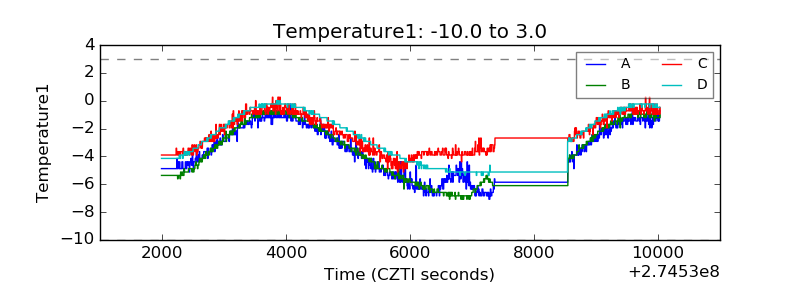 |
| Veto HV Monitor | 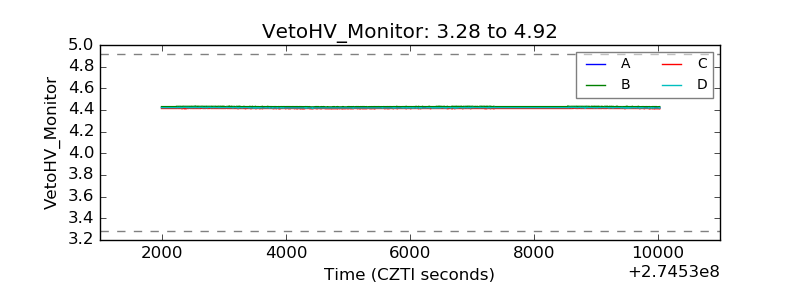 |
| Veto LLD | 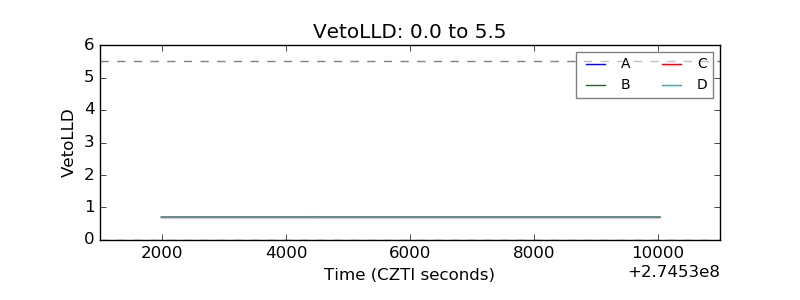 |
| Alpha Counter | 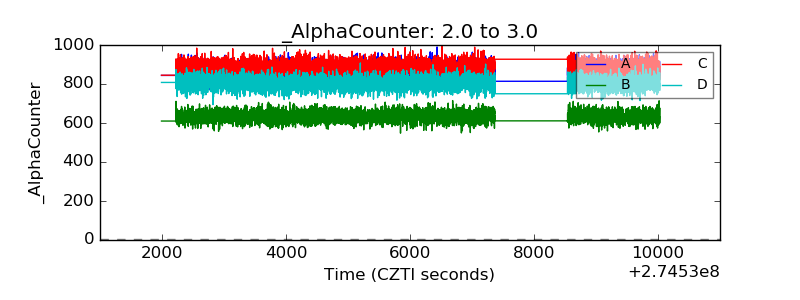 |
| _CPM_Rate | 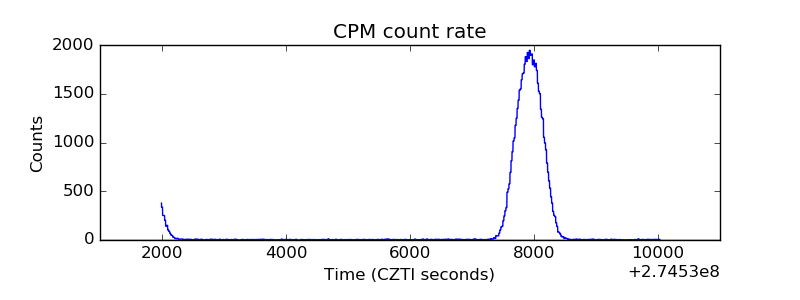 |
| CZT Counter | 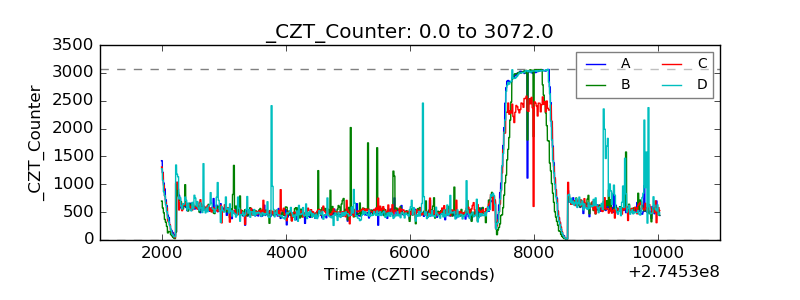 |
| +2.5 Volts monitor |  |
| +5 Volts monitor |  |
| _ROLL_ROT | 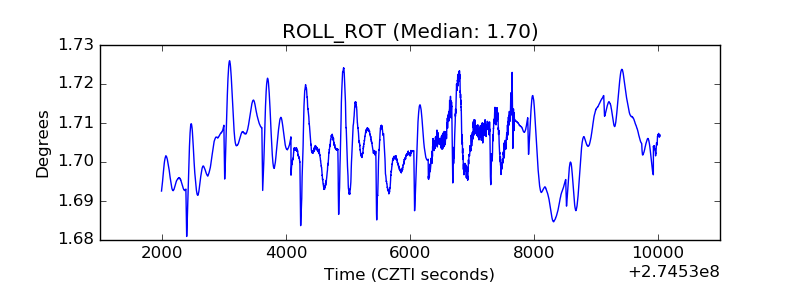 |
| _Roll_DEC | 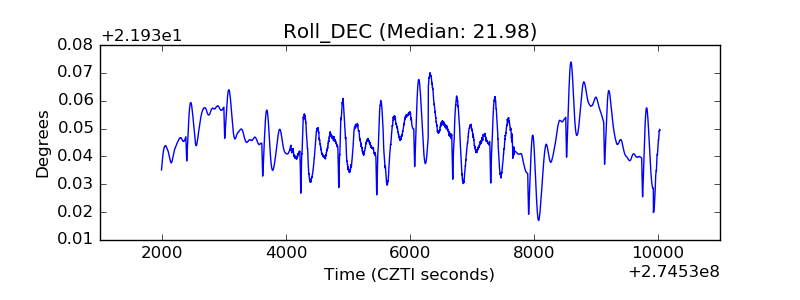 |
| _Roll_RA | 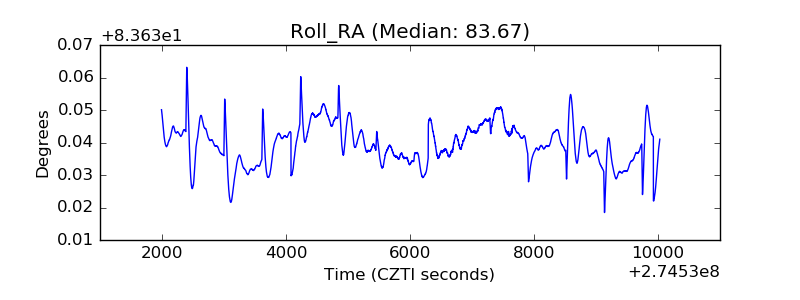 |
| Veto Counter | 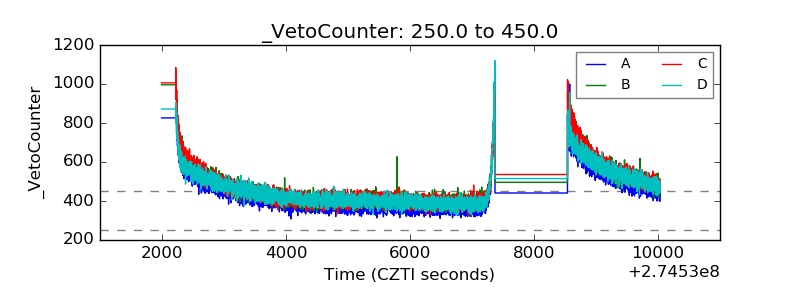 |