| Param | Original file | Final file |
|---|---|---|
| Filename | modeM0/AS1T02_090T01_9000002364_16007cztM0_level2.evt | modeM0/AS1T02_090T01_9000002364_16007cztM0_level2_quad_clean.evt |
| Size (bytes) | 508,561,920 | 71,032,320 |
| Size | 485.0 MB | 67.7 MB |
| Events in quadrant A | 3,468,122 | 437,052 |
| Events in quadrant B | 3,861,041 | 437,506 |
| Events in quadrant C | 3,693,356 | 420,010 |
| Events in quadrant D | 3,947,240 | 411,709 |
| Mode M9 | |||
|---|---|---|---|
| Quadrant | BADHDUFLAG | Total packets | Discarded packets |
| A | 0 | 12 | 0 |
| B | 0 | 12 | 0 |
| C | 0 | 12 | 0 |
| D | 0 | 13 | 0 |
| Mode M0 | |||
|---|---|---|---|
| Quadrant | BADHDUFLAG | Total packets | Discarded packets |
| A | 0 | 14232 | 3 |
| B | 0 | 15519 | 2 |
| C | 0 | 15039 | 2 |
| D | 0 | 15851 | 2 |
| Mode SS | |||
|---|---|---|---|
| Quadrant | BADHDUFLAG | Total packets | Discarded packets |
| A | 0 | 130 | 0 |
| B | 0 | 130 | 0 |
| C | 0 | 130 | 0 |
| D | 0 | 130 | 0 |
| Quadrant | Total seconds | Saturated seconds | Saturation percentage |
|---|---|---|---|
| A | 6368 | 73 | 1.146357% |
| B | 6368 | 148 | 2.324121% |
| C | 6368 | 120 | 1.884422% |
| D | 6368 | 193 | 3.030779% |
Noise dominated data is calculated using 1-second bins in cleaned event files. If a bin has >2000 counts, and if more than 50% of those come from <1% of pixels, then it is considered to be noise-dominated and hence unusable.
| Quadrant | # 1 sec bins | Bins with >0 counts | Bins with >2000 counts | High rate bins dominated by noise | Noise dominated (total time) | Noise dominated (detector-on time) | Marked lightcurve |
|---|---|---|---|---|---|---|---|
| A | 7634 | 6369 | 1 | 1 | 0.01% | 0.02% | 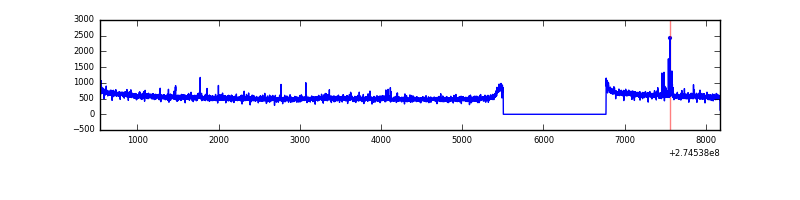 |
| B | 7634 | 6369 | 55 | 55 | 0.72% | 0.86% | 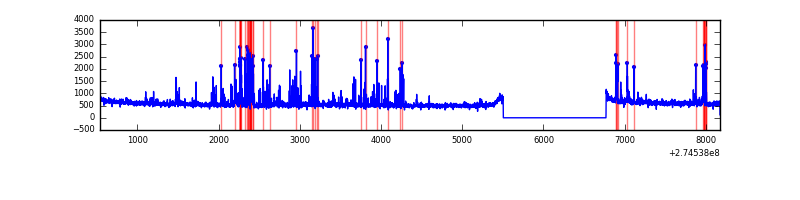 |
| C | 7634 | 6369 | 7 | 7 | 0.09% | 0.11% | 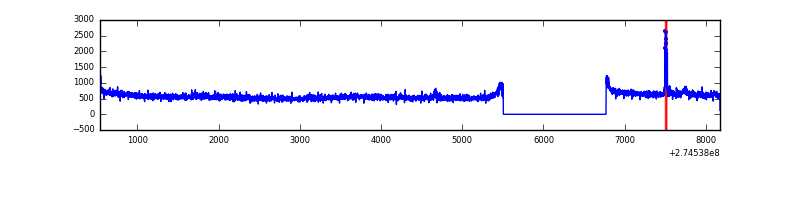 |
| D | 7634 | 6369 | 115 | 115 | 1.51% | 1.81% | 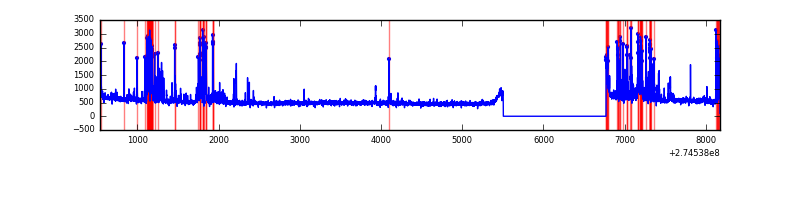 |
Top three noisy pixels from each quadrant. If the there are fewer than three noisy pixels in the level2.evt file, extra rows are filled as -1
| Pixel properties | Quadrant properties | ||||||
|---|---|---|---|---|---|---|---|
| Quadrant | DetID | PixID | Counts | Sigma | Mean | Median | Sigma |
| A | 15 | 157 | 33354 | 183.18 | 889 | 873 | 177.3 |
| A | 13 | 210 | 9149 | 46.67 | 889 | 873 | 177.3 |
| A | 0 | 226 | 8158 | 41.08 | 889 | 873 | 177.3 |
| B | 7 | 220 | 183947 | 1113.88 | 879 | 862 | 164.4 |
| B | 5 | 65 | 98209 | 592.26 | 879 | 862 | 164.4 |
| B | 10 | 245 | 47486 | 283.66 | 879 | 862 | 164.4 |
| C | 3 | 233 | 240234 | 1217.7 | 849 | 858 | 196.6 |
| C | 14 | 238 | 132888 | 671.63 | 849 | 858 | 196.6 |
| C | 9 | 54 | 7264 | 32.59 | 849 | 858 | 196.6 |
| D | 12 | 218 | 554758 | 2634.76 | 861 | 839 | 210.2 |
| D | 2 | 152 | 63759 | 299.28 | 861 | 839 | 210.2 |
| D | 2 | 234 | 26075 | 120.04 | 861 | 839 | 210.2 |
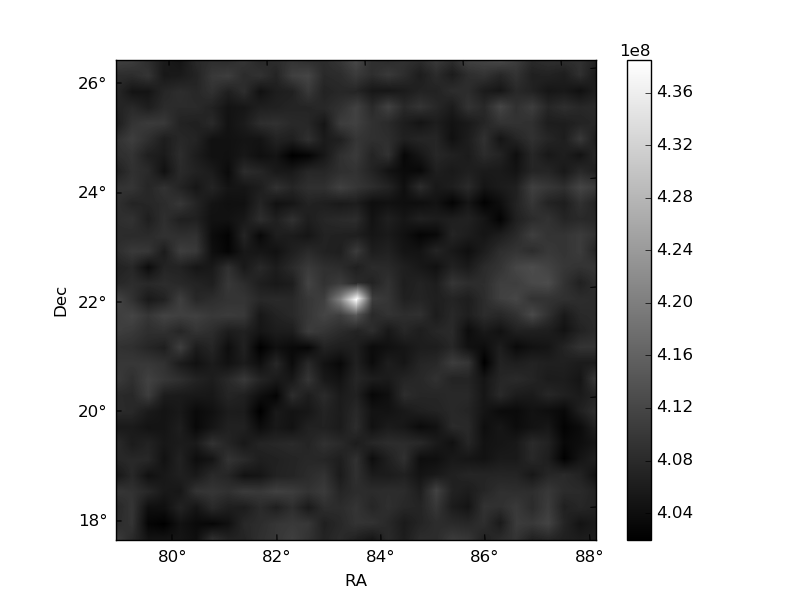
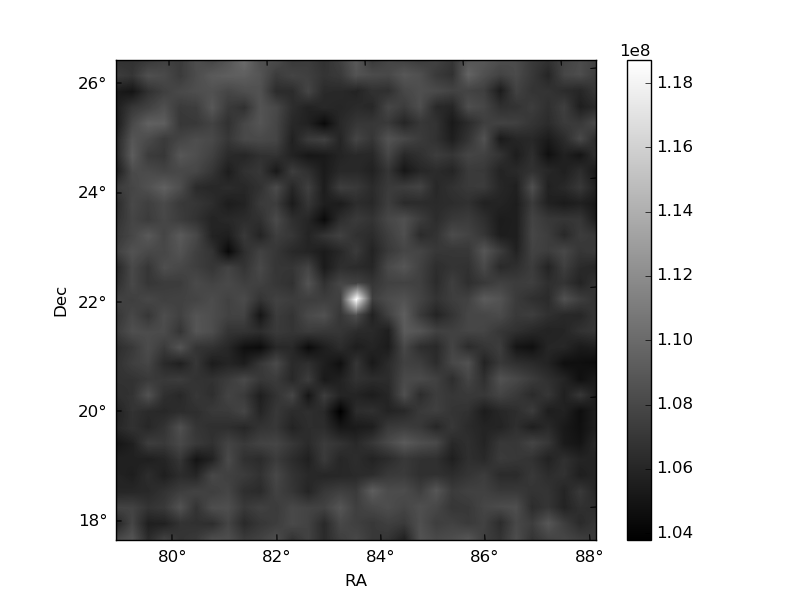
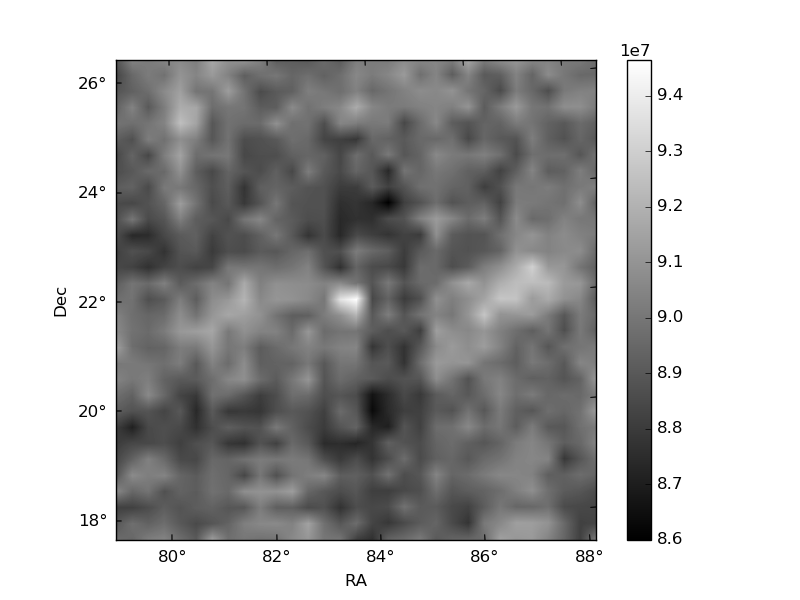
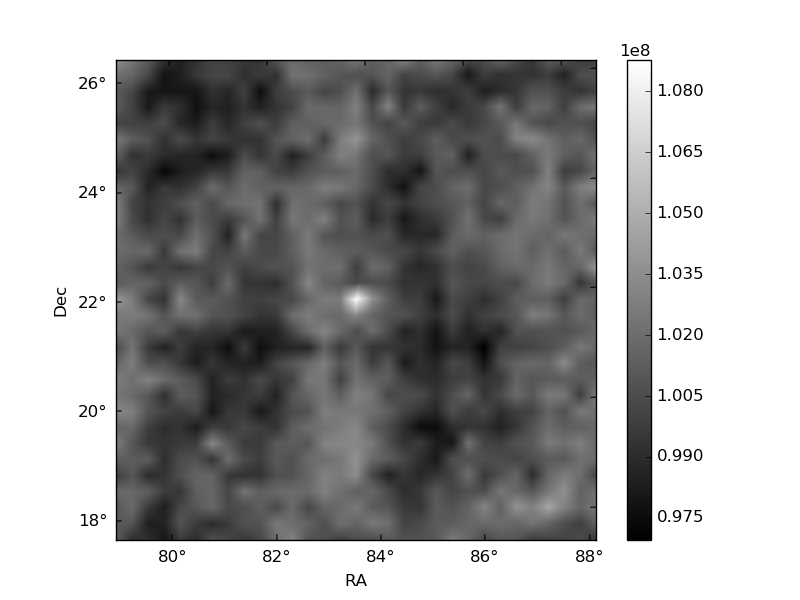
Histogram calculated using DETX and DETY for each event in the final _common_clean file
| Quadrant A | 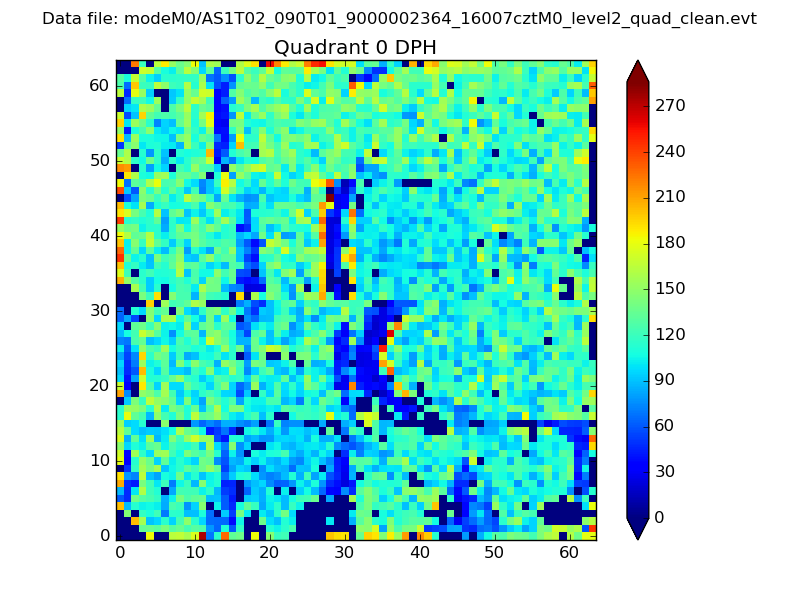 |
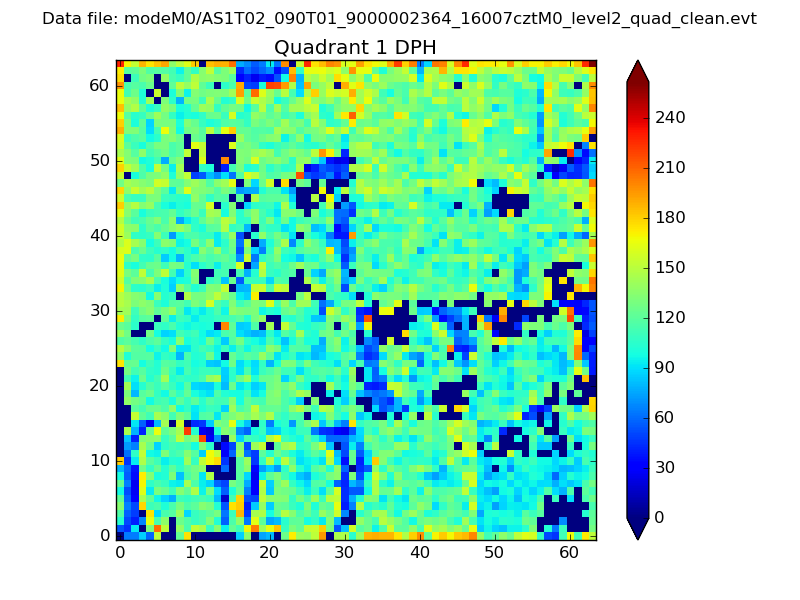 |
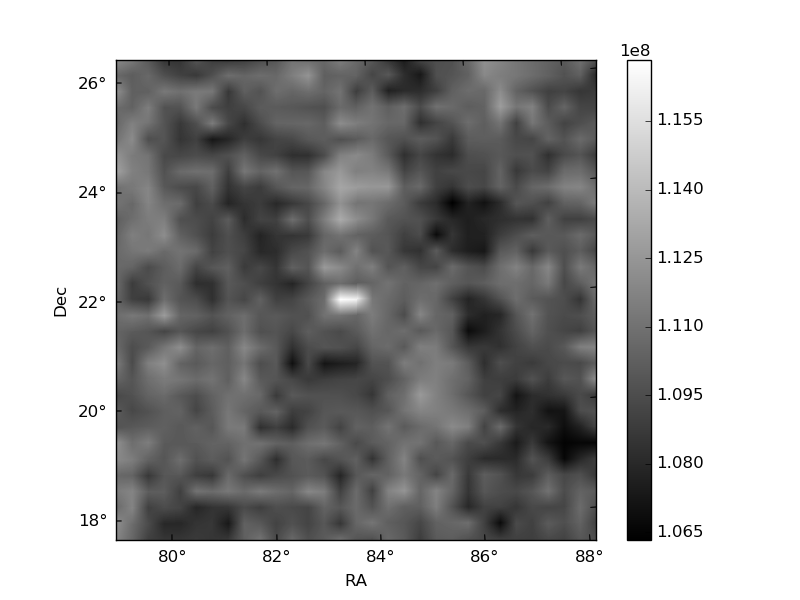
Quadrant B |
|---|---|---|---|
| Quadrant D | 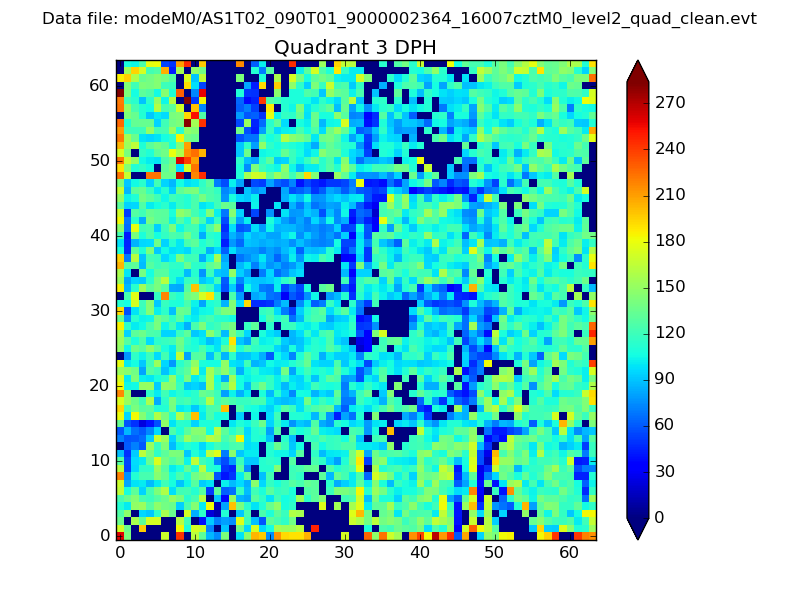 |
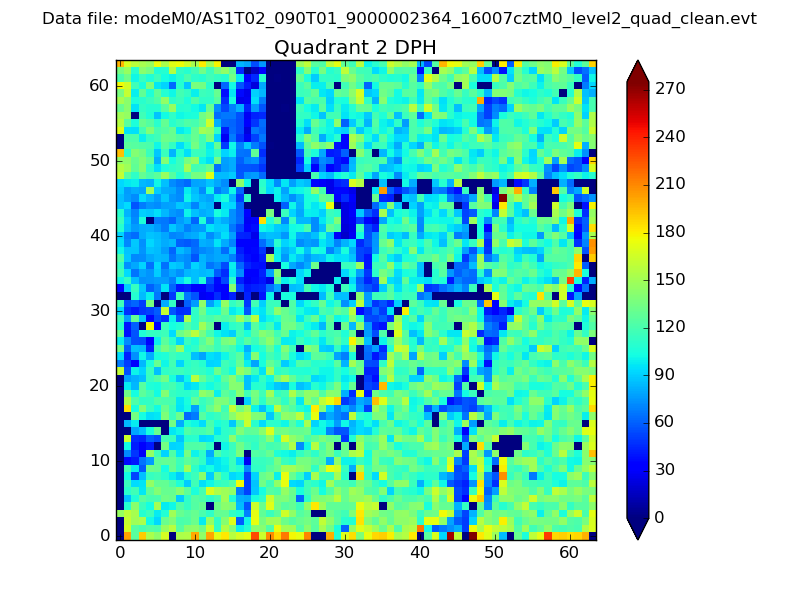 |
Quadrant C |
| Plot type | Count rate plots | Images |
|---|---|---|
| Comparison with Poisson distribution Blue bars denote a histogram of data divided into 1 sec bins. Red curve is a Poisson curve with rate = median count rate of data. |
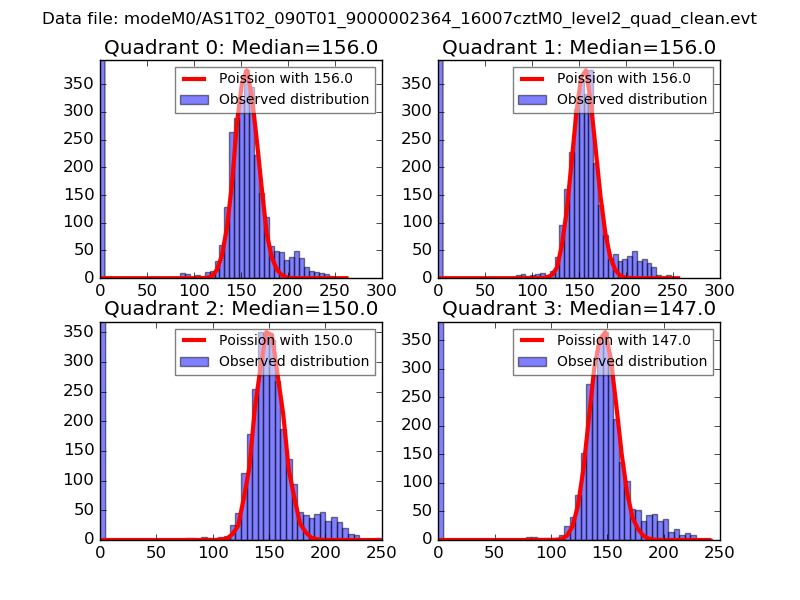 |
 |
| Quadrant-wise count rates Data is divided into 100 sec bins |
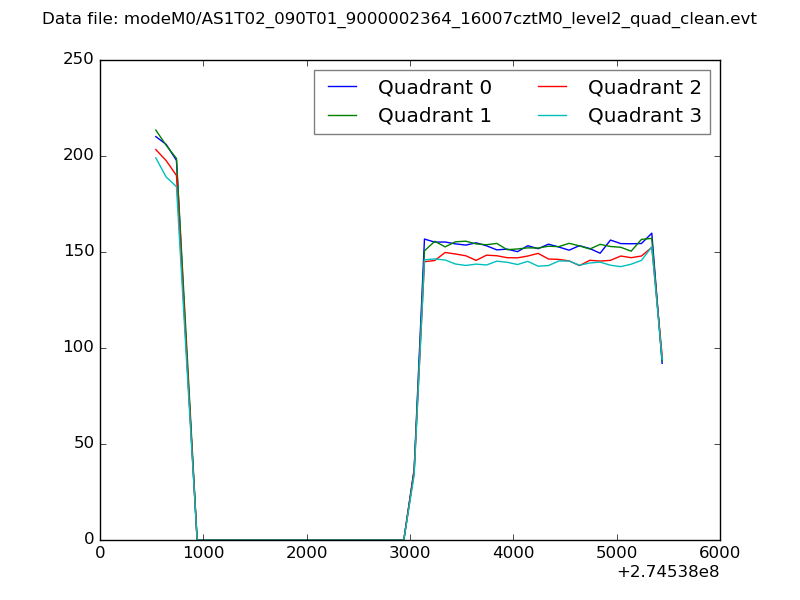 |
|
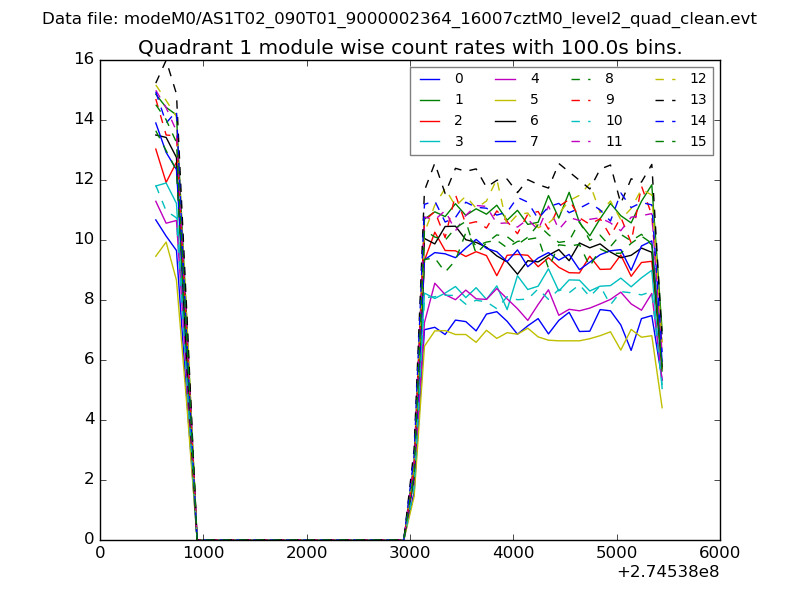
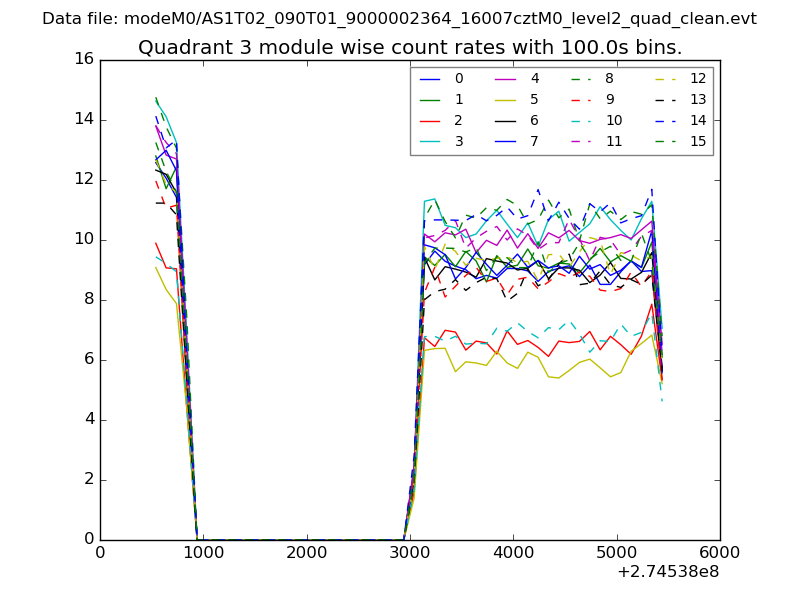
| Module-wise count rates for Quadrant A Data is divided into 100 sec bins |
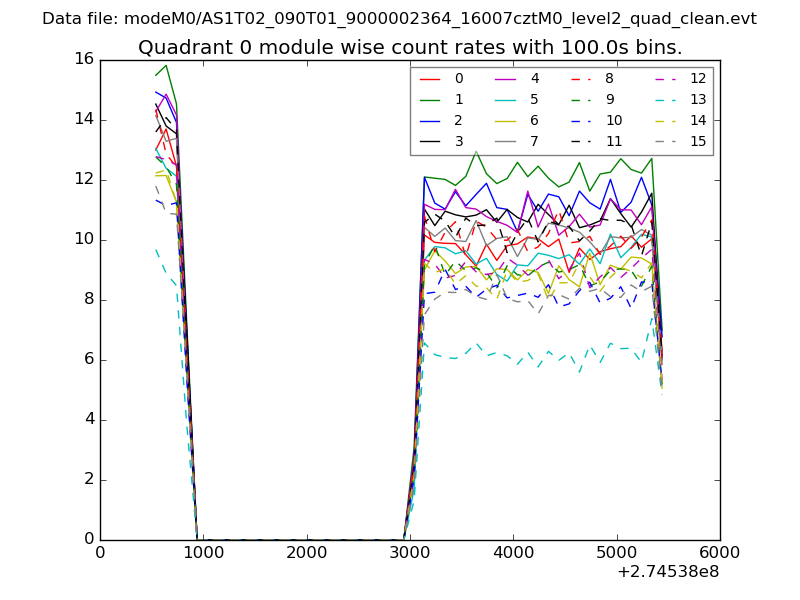 |
 |
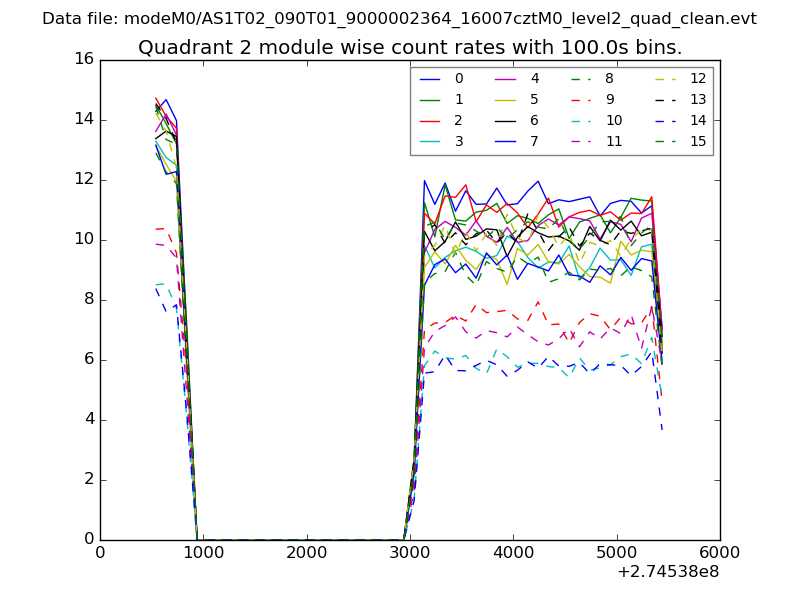
| Module-wise count rates for Quadrant B Data is divided into 100 sec bins |
 |
 |
| Module-wise count rates for Quadrant C Data is divided into 100 sec bins |
 |
 |
| Module-wise count rates for Quadrant D Data is divided into 100 sec bins |
 |
 |
| Parameter | Plot |
|---|---|
| CZT HV Monitor | 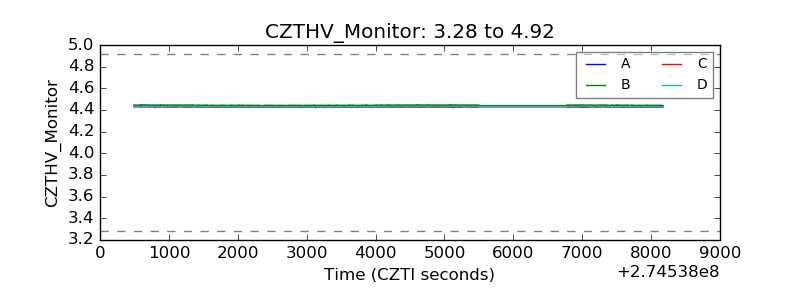 |
| D_VDD | 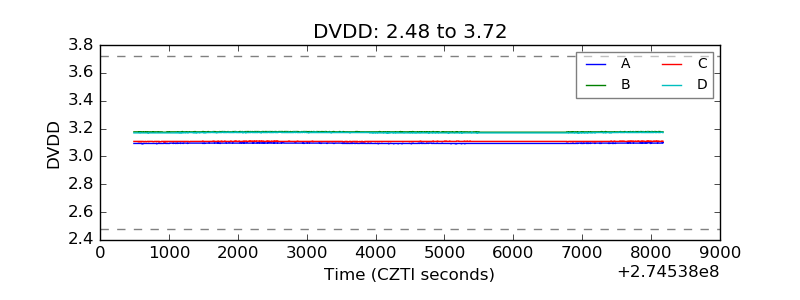 |
| Temperature 1 | 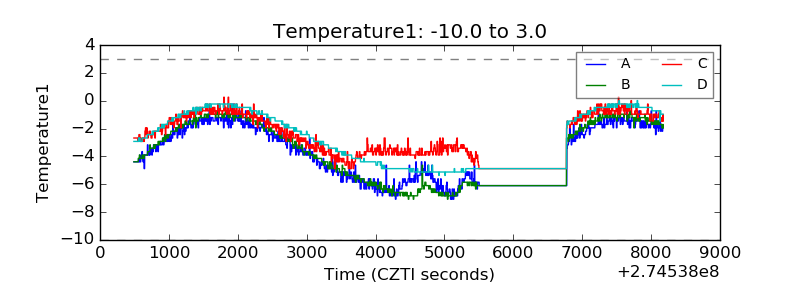 |
| Veto HV Monitor | 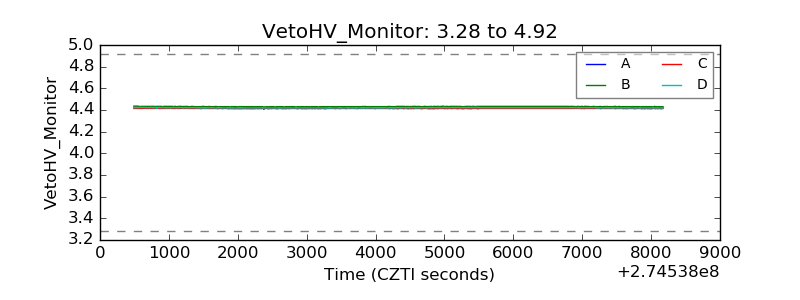 |
| Veto LLD | 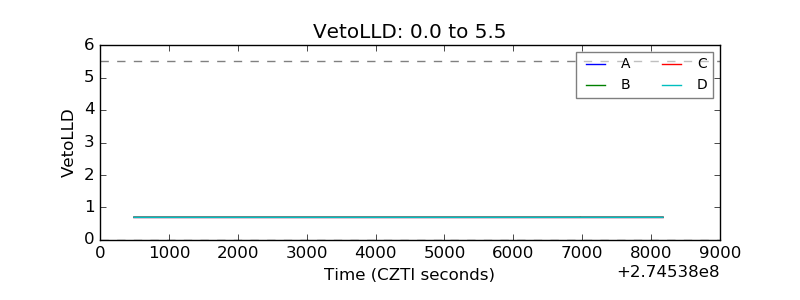 |
| Alpha Counter | 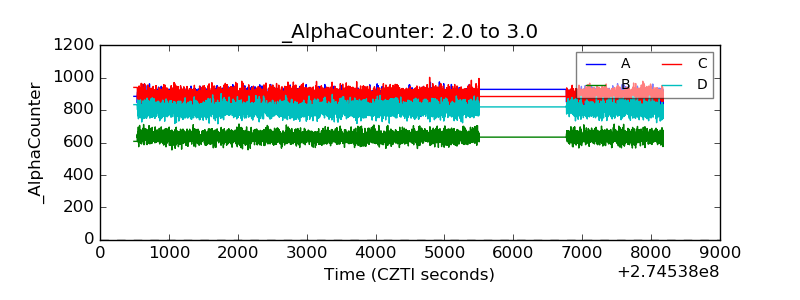 |
| _CPM_Rate | 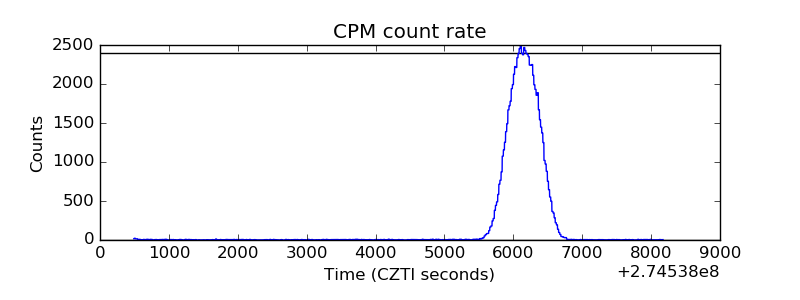 |
| CZT Counter | 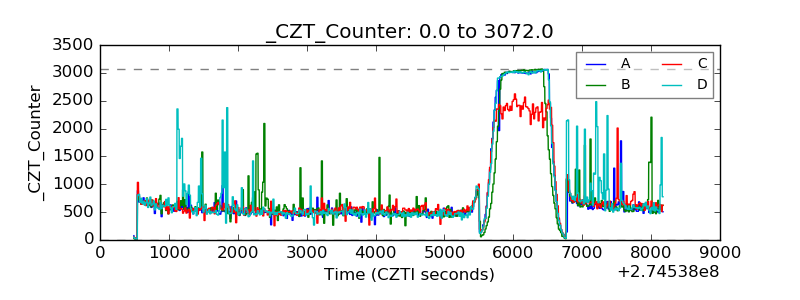 |
| +2.5 Volts monitor |  |
| +5 Volts monitor |  |
| _ROLL_ROT | 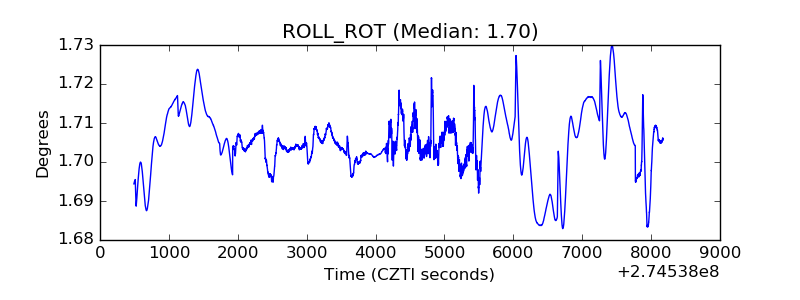 |
| _Roll_DEC | 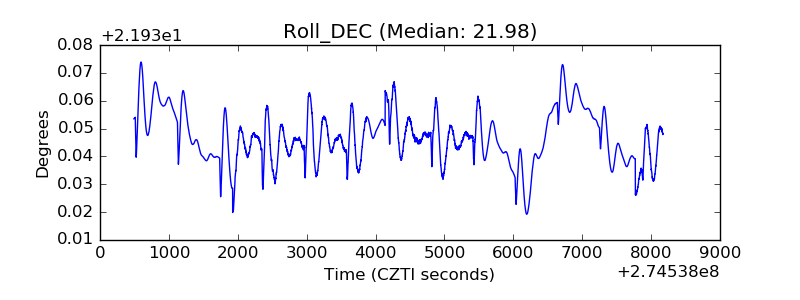 |
| _Roll_RA | 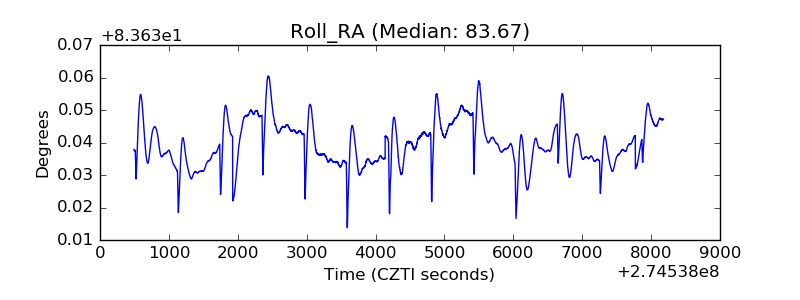 |
| Veto Counter | 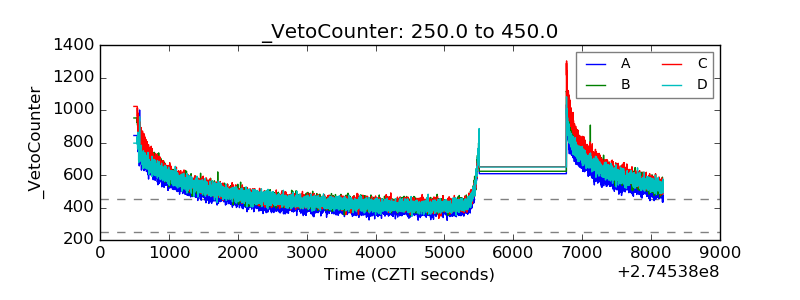 |