| Param | Original file | Final file |
|---|---|---|
| Filename | modeM0/AS1T02_090T01_9000002364_16011cztM0_level2.evt | modeM0/AS1T02_090T01_9000002364_16011cztM0_level2_quad_clean.evt |
| Size (bytes) | 479,761,920 | 99,789,120 |
| Size | 457.5 MB | 95.2 MB |
| Events in quadrant A | 3,327,941 | 647,946 |
| Events in quadrant B | 3,544,474 | 655,703 |
| Events in quadrant C | 3,452,143 | 634,750 |
| Events in quadrant D | 3,753,388 | 619,865 |
| Mode M9 | |||
|---|---|---|---|
| Quadrant | BADHDUFLAG | Total packets | Discarded packets |
| A | 0 | 10 | 0 |
| B | 0 | 10 | 0 |
| C | 0 | 10 | 0 |
| D | 0 | 10 | 0 |
| Mode M0 | |||
|---|---|---|---|
| Quadrant | BADHDUFLAG | Total packets | Discarded packets |
| A | 0 | 13940 | 3 |
| B | 0 | 14647 | 2 |
| C | 0 | 14234 | 2 |
| D | 0 | 15498 | 2 |
| Mode SS | |||
|---|---|---|---|
| Quadrant | BADHDUFLAG | Total packets | Discarded packets |
| A | 0 | 134 | 0 |
| B | 0 | 134 | 0 |
| C | 0 | 134 | 0 |
| D | 0 | 134 | 0 |
| Quadrant | Total seconds | Saturated seconds | Saturation percentage |
|---|---|---|---|
| A | 6656 | 30 | 0.450721% |
| B | 6656 | 88 | 1.322115% |
| C | 6656 | 82 | 1.231971% |
| D | 6656 | 194 | 2.914663% |
Noise dominated data is calculated using 1-second bins in cleaned event files. If a bin has >2000 counts, and if more than 50% of those come from <1% of pixels, then it is considered to be noise-dominated and hence unusable.
| Quadrant | # 1 sec bins | Bins with >0 counts | Bins with >2000 counts | High rate bins dominated by noise | Noise dominated (total time) | Noise dominated (detector-on time) | Marked lightcurve |
|---|---|---|---|---|---|---|---|
| A | 7592 | 6658 | 2 | 2 | 0.03% | 0.03% | 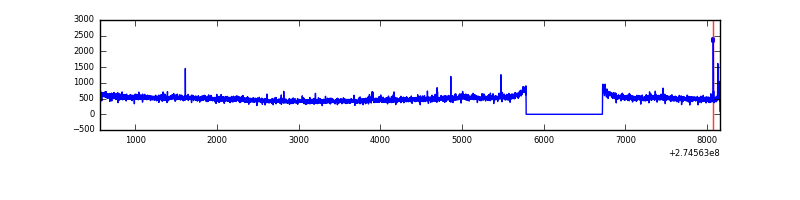 |
| B | 7592 | 6658 | 18 | 18 | 0.24% | 0.27% | 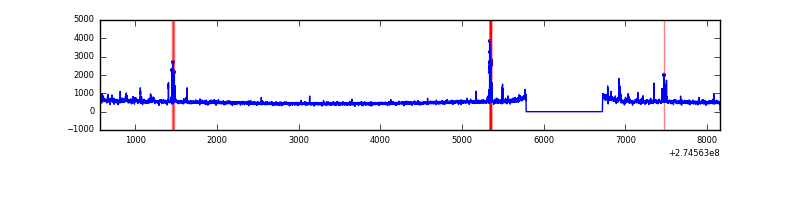 |
| C | 7592 | 6658 | 0 | 0 | 0.00% | 0.00% | 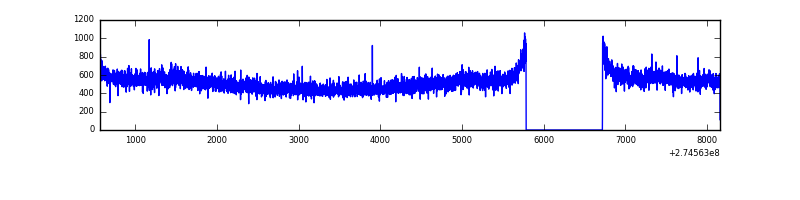 |
| D | 7592 | 6657 | 109 | 109 | 1.44% | 1.64% | 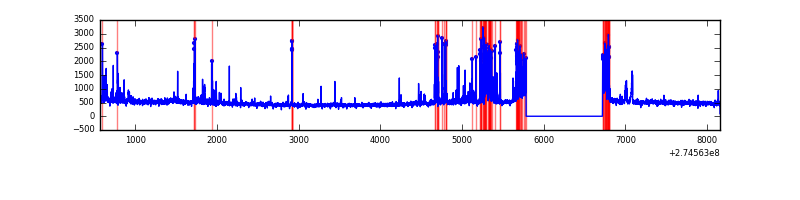 |
Top three noisy pixels from each quadrant. If the there are fewer than three noisy pixels in the level2.evt file, extra rows are filled as -1
| Pixel properties | Quadrant properties | ||||||
|---|---|---|---|---|---|---|---|
| Quadrant | DetID | PixID | Counts | Sigma | Mean | Median | Sigma |
| A | 15 | 174 | 14976 | 80.6 | 854 | 839 | 175.4 |
| A | 14 | 235 | 11192 | 59.03 | 854 | 839 | 175.4 |
| A | 12 | 96 | 9691 | 50.47 | 854 | 839 | 175.4 |
| B | 0 | 245 | 53676 | 322.38 | 857 | 837 | 163.9 |
| B | 0 | 228 | 48412 | 290.26 | 857 | 837 | 163.9 |
| B | 0 | 190 | 26586 | 157.1 | 857 | 837 | 163.9 |
| C | 14 | 238 | 127657 | 658.62 | 826 | 834 | 192.6 |
| C | 3 | 233 | 102188 | 526.35 | 826 | 834 | 192.6 |
| C | 13 | 61 | 5809 | 25.84 | 826 | 834 | 192.6 |
| D | 12 | 218 | 495126 | 2417.67 | 825 | 801 | 204.5 |
| D | 2 | 152 | 51544 | 248.17 | 825 | 801 | 204.5 |
| D | 5 | 32 | 27493 | 130.54 | 825 | 801 | 204.5 |
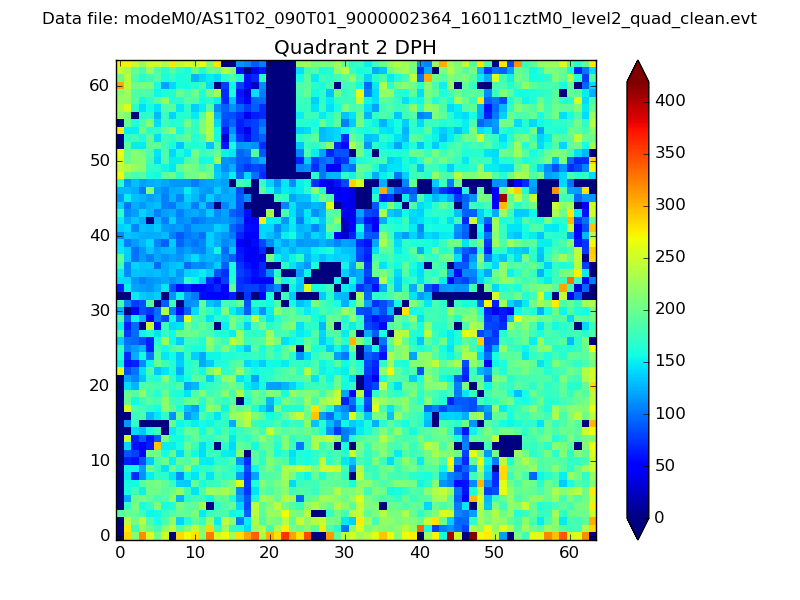
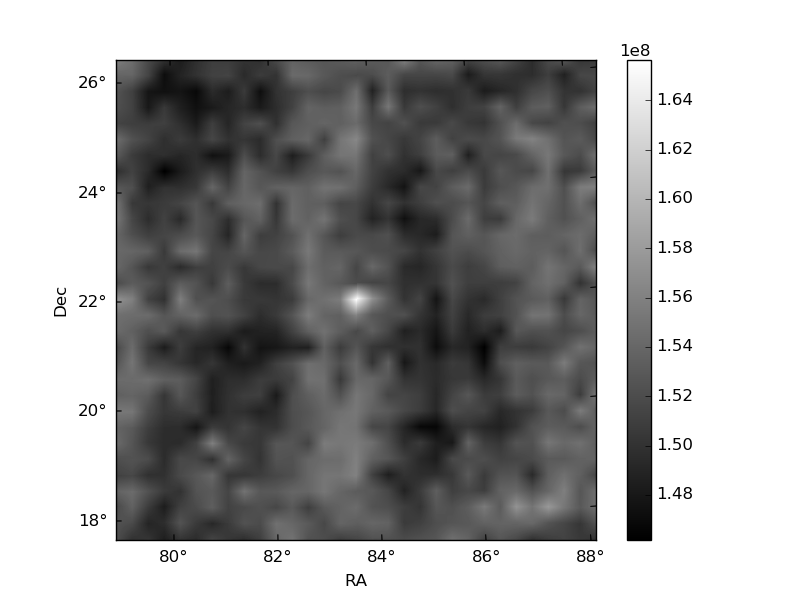
Histogram calculated using DETX and DETY for each event in the final _common_clean file
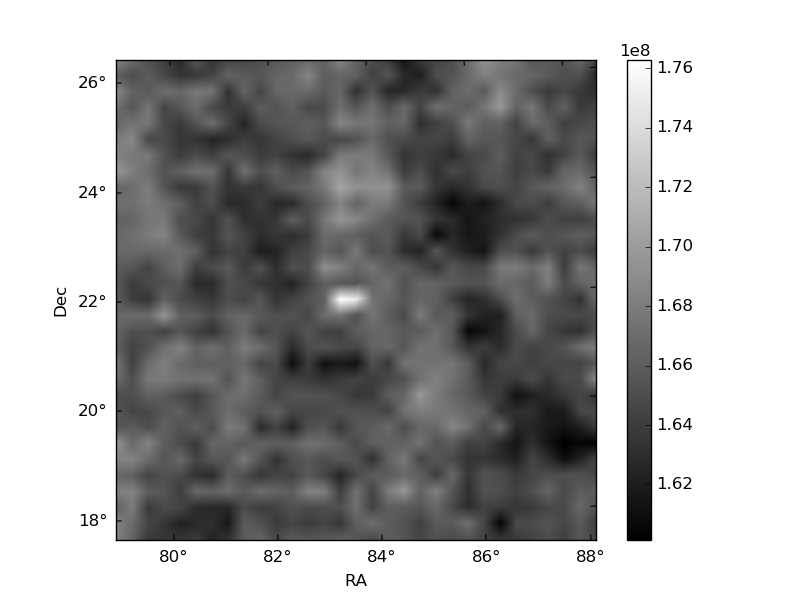
| Quadrant A | 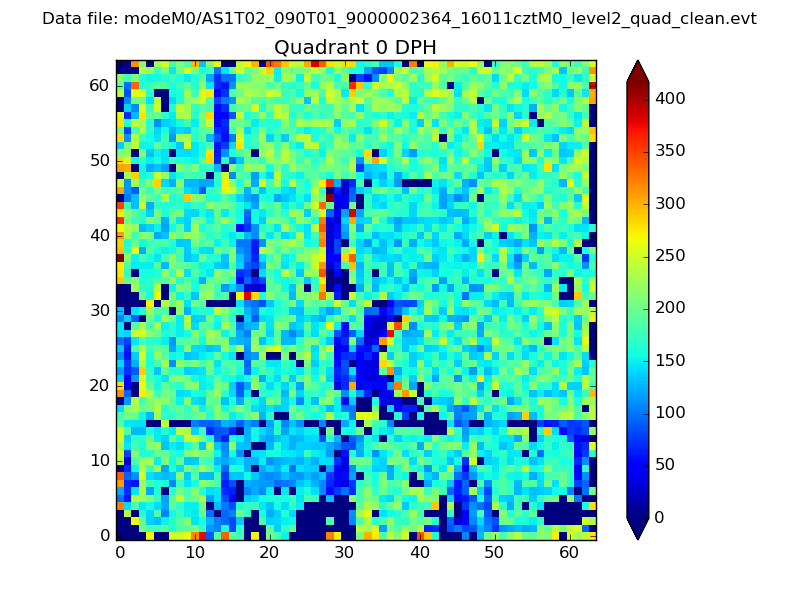 |
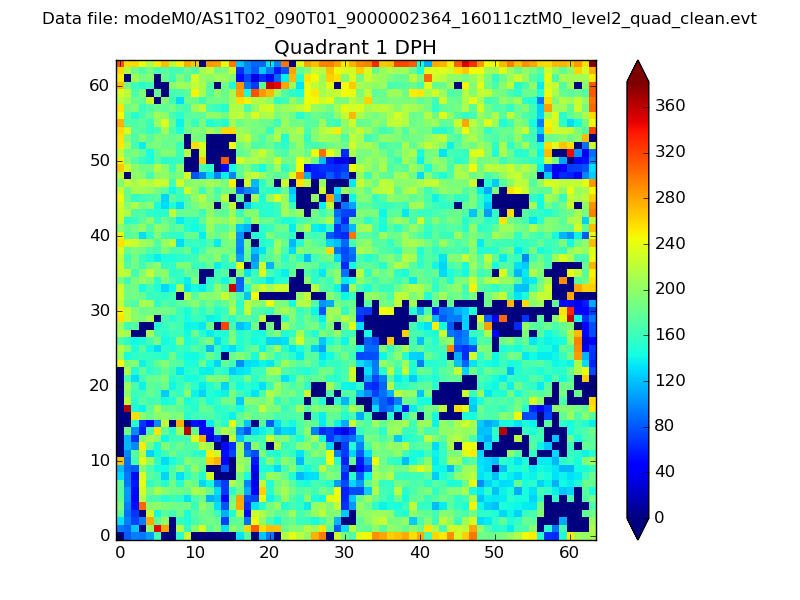 |
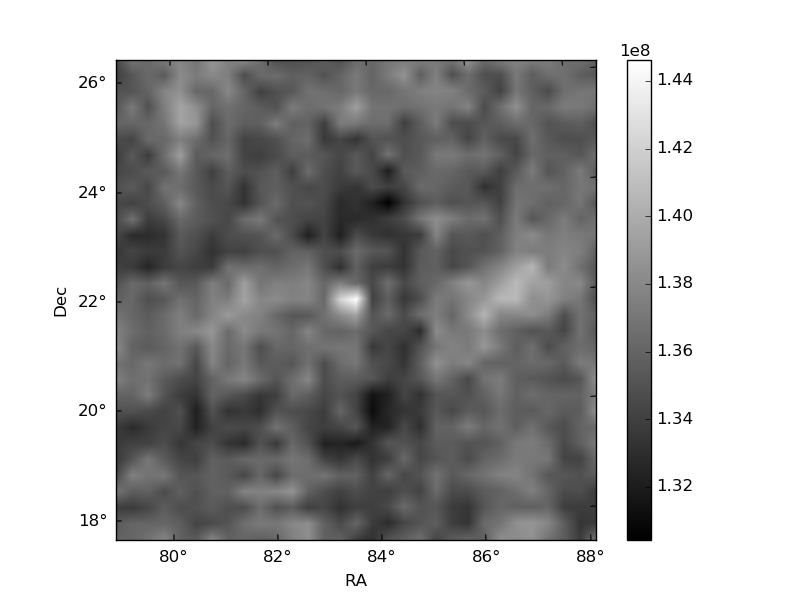
Quadrant B |
|---|---|---|---|
| Quadrant D | 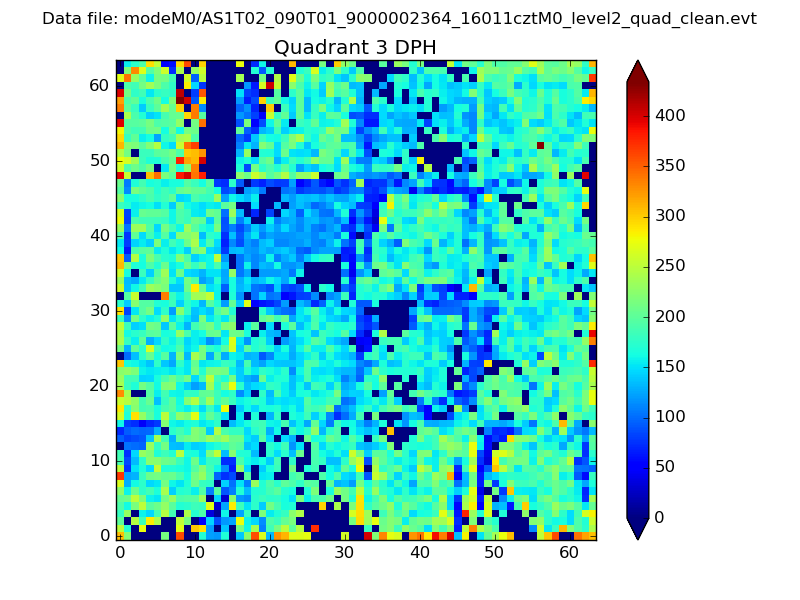 |
 |
Quadrant C |
| Plot type | Count rate plots | Images |
|---|---|---|
| Comparison with Poisson distribution Blue bars denote a histogram of data divided into 1 sec bins. Red curve is a Poisson curve with rate = median count rate of data. |
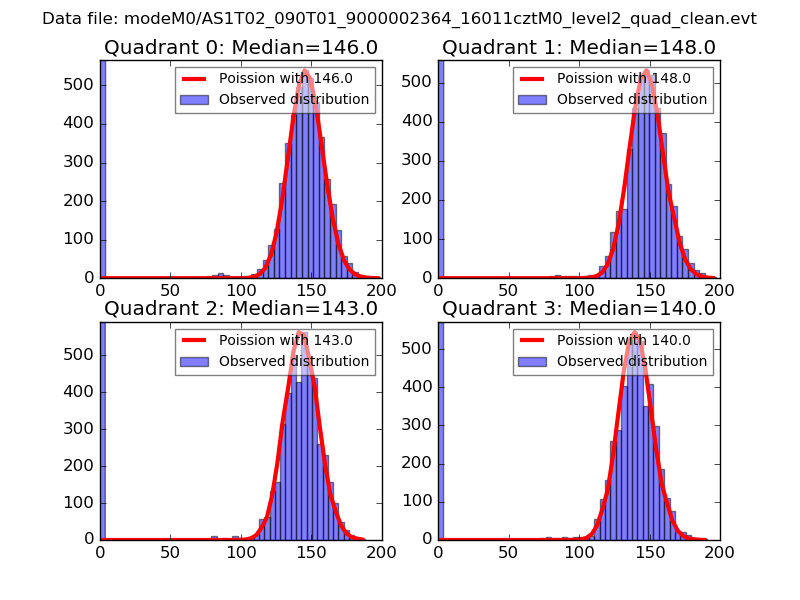 |
 |
| Quadrant-wise count rates Data is divided into 100 sec bins |
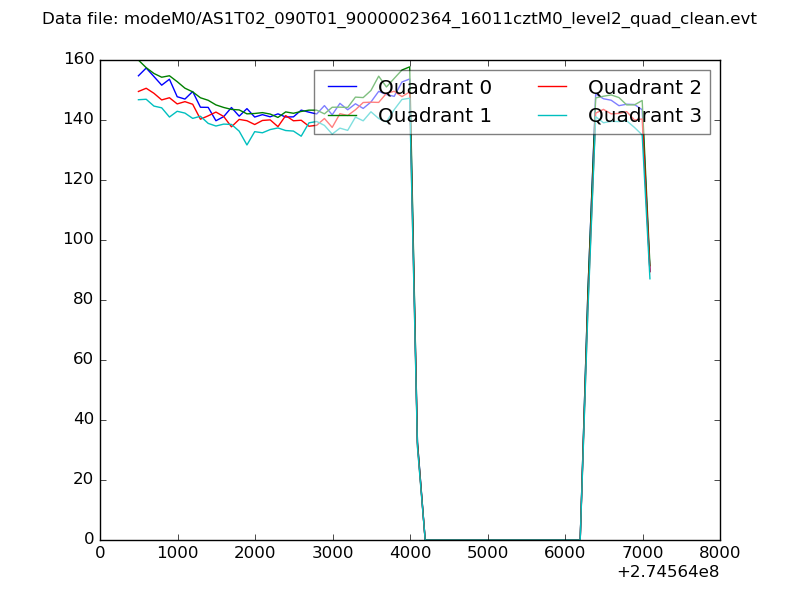 |
|
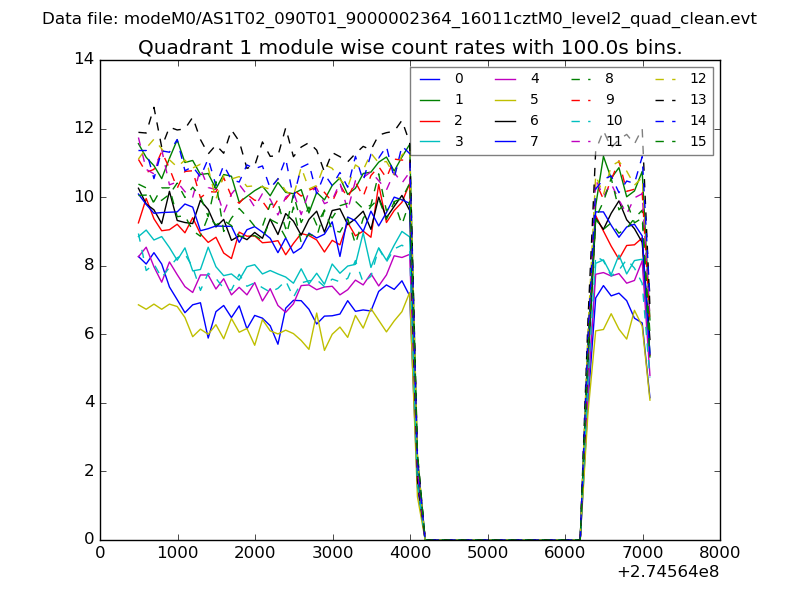
| Module-wise count rates for Quadrant A Data is divided into 100 sec bins |
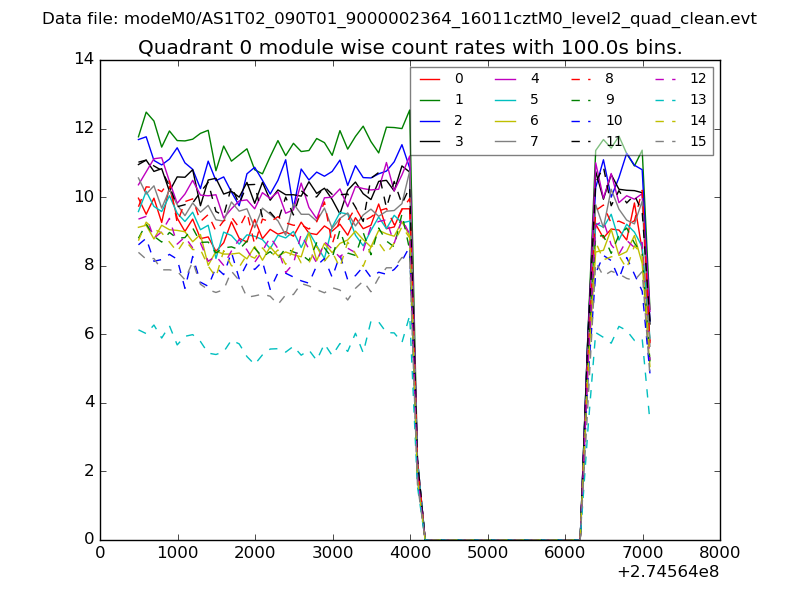 |
 |
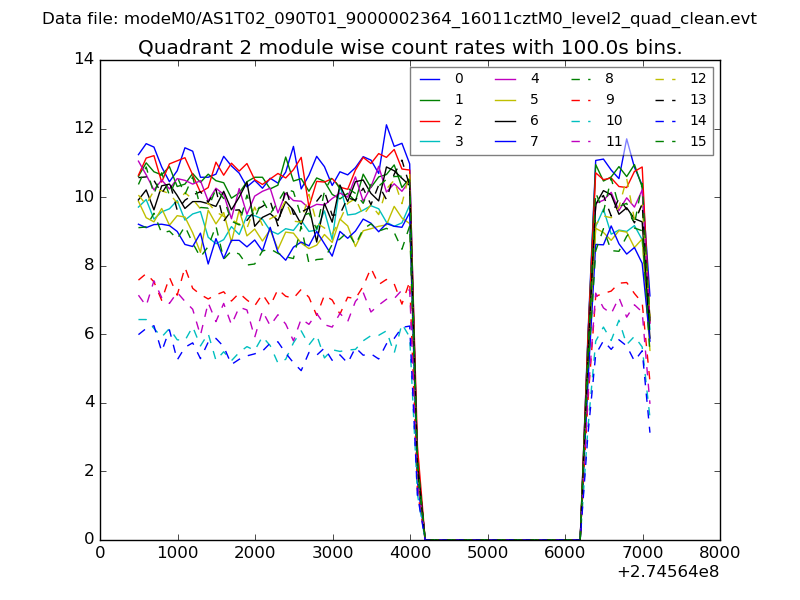
| Module-wise count rates for Quadrant B Data is divided into 100 sec bins |
 |
 |
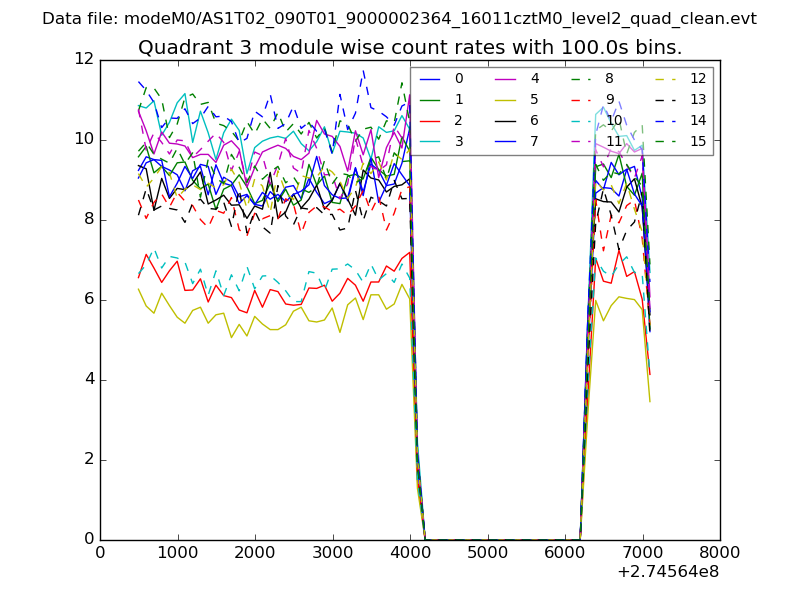
| Module-wise count rates for Quadrant C Data is divided into 100 sec bins |
 |
 |
| Module-wise count rates for Quadrant D Data is divided into 100 sec bins |
 |
 |
| Parameter | Plot |
|---|---|
| CZT HV Monitor | 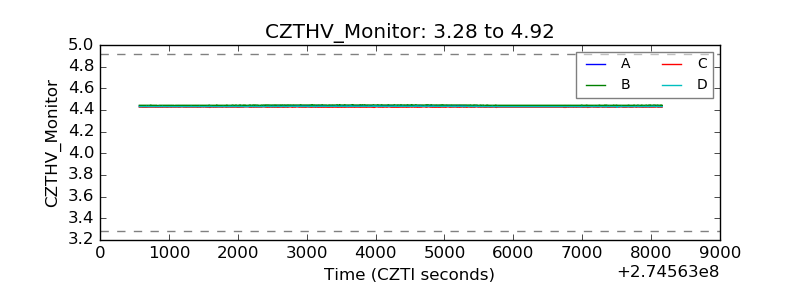 |
| D_VDD | 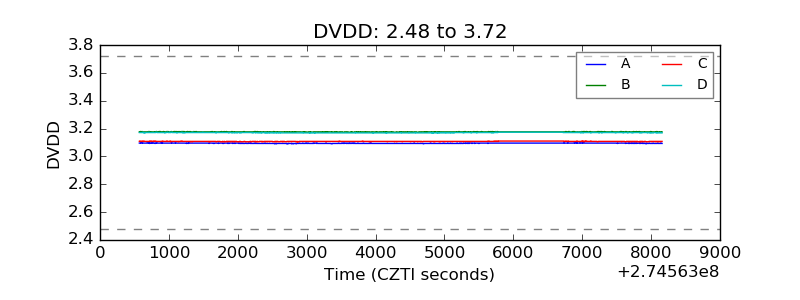 |
| Temperature 1 | 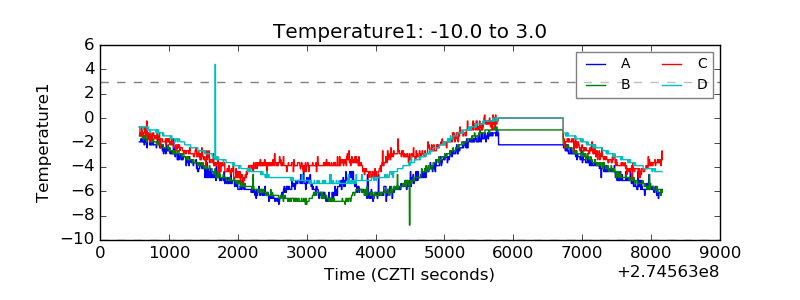 |
| Veto HV Monitor | 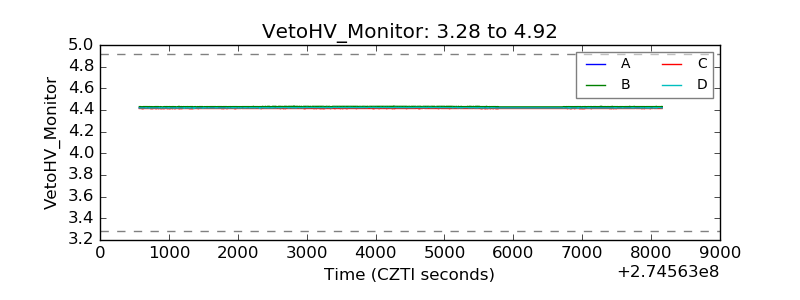 |
| Veto LLD | 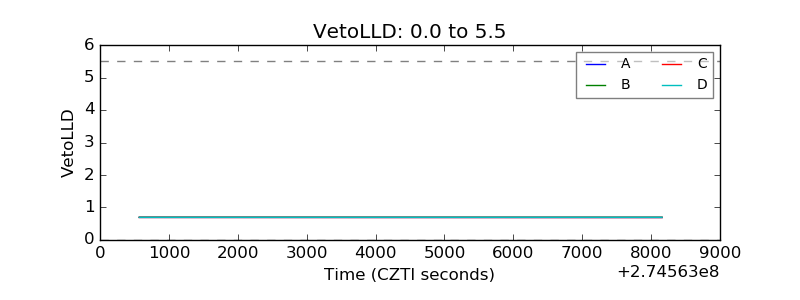 |
| Alpha Counter | 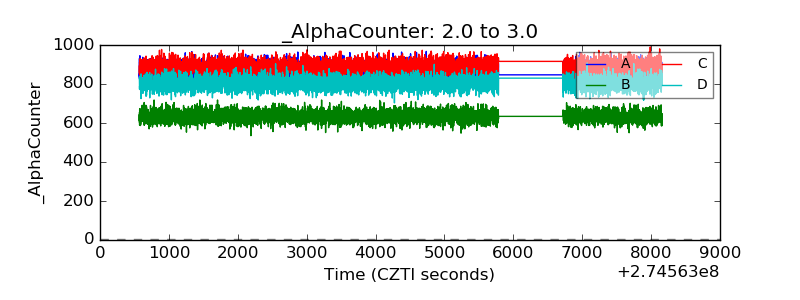 |
| _CPM_Rate | 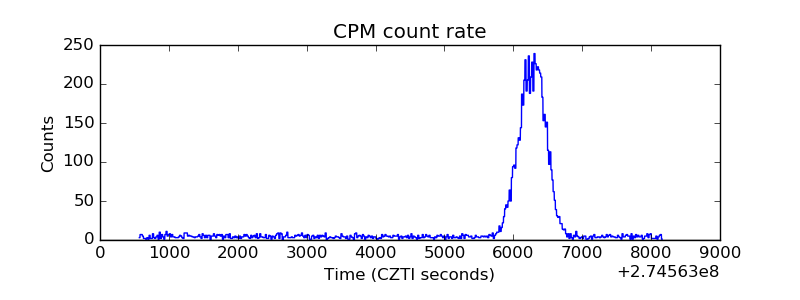 |
| CZT Counter | 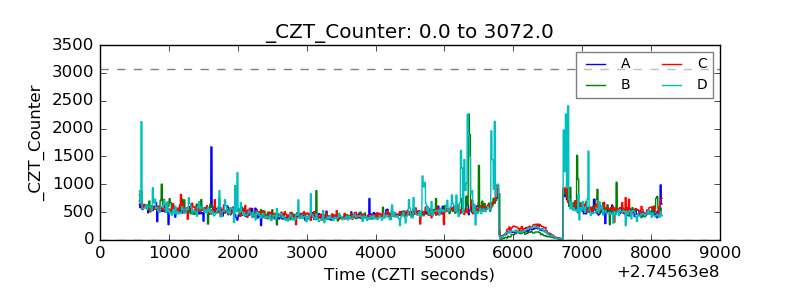 |
| +2.5 Volts monitor |  |
| +5 Volts monitor |  |
| _ROLL_ROT | 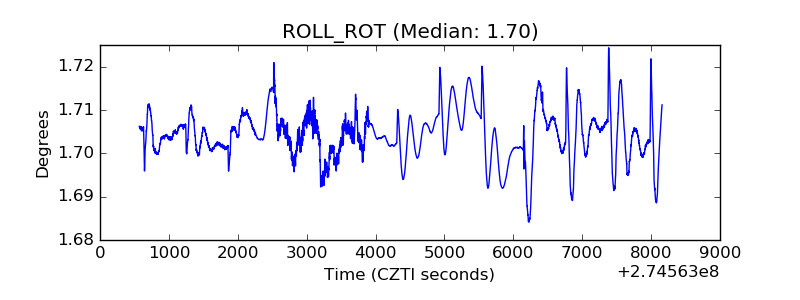 |
| _Roll_DEC | 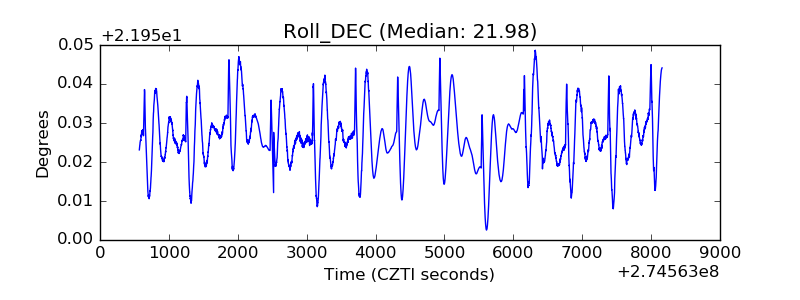 |
| _Roll_RA | 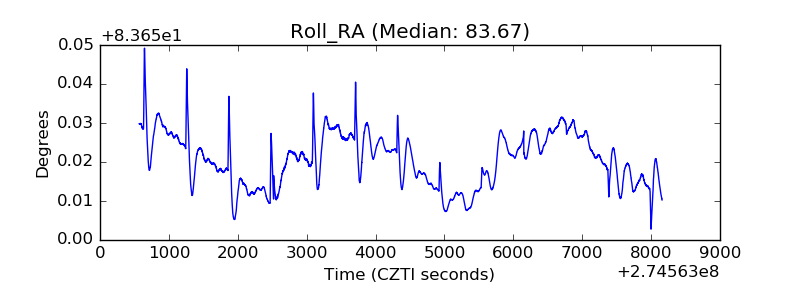 |
| Veto Counter | 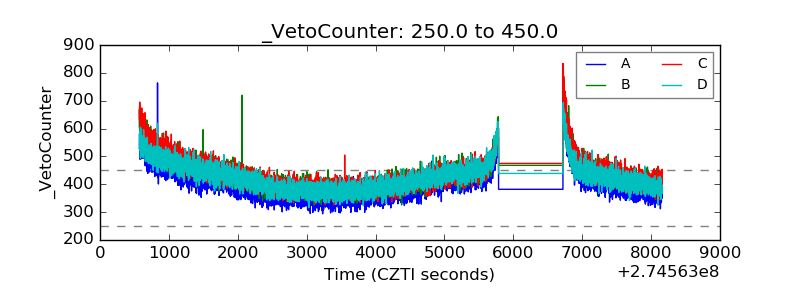 |