| Param | Original file | Final file |
|---|---|---|
| Filename | modeM0/AS1T02_091T01_9000002368cztM0_level2.fits | modeM0/AS1T02_091T01_9000002368cztM0_level2_quad_clean.evt |
| Size (bytes) | 802,872,000 | 819,936,000 |
| Size | 765.7 MB | 782.0 MB |
| Events in quadrant A | 4,914,998 | 5,021,682 |
| Events in quadrant B | 4,713,496 | 5,011,655 |
| Events in quadrant C | 4,848,384 | 4,809,393 |
| Events in quadrant D | 4,277,320 | 4,429,358 |
| Mode SS | |||
|---|---|---|---|
| Quadrant | BADHDUFLAG | Total packets | Discarded packets |
| A | 0 | 1648 | 0 |
| B | 0 | 1648 | 0 |
| C | 0 | 1648 | 0 |
| D | 0 | 1648 | 0 |
| Mode M9 | |||
|---|---|---|---|
| Quadrant | BADHDUFLAG | Total packets | Discarded packets |
| A | 0 | 127 | 0 |
| B | 0 | 127 | 0 |
| C | 0 | 127 | 0 |
| D | 0 | 127 | 0 |
| Mode M0 | |||
|---|---|---|---|
| Quadrant | BADHDUFLAG | Total packets | Discarded packets |
| A | 0 | 171328 | 0 |
| B | 0 | 181884 | 0 |
| C | 0 | 173328 | 0 |
| D | 0 | 173142 | 0 |
| Quadrant | Total seconds | Saturated seconds | Saturation percentage |
|---|---|---|---|
| A | 81130 | 981 | 1.209170% |
| B | 81130 | 1674 | 2.063355% |
| C | 81130 | 1320 | 1.627018% |
| D | 81130 | 816 | 1.005793% |
Noise dominated data is calculated using 1-second bins in cleaned event files. If a bin has >2000 counts, and if more than 50% of those come from <1% of pixels, then it is considered to be noise-dominated and hence unusable.
| Quadrant | # 1 sec bins | Bins with >0 counts | Bins with >2000 counts | High rate bins dominated by noise | Noise dominated (total time) | Noise dominated (detector-on time) | Marked lightcurve |
|---|---|---|---|---|---|---|---|
| A | 93540 | 81098 | 0 | 0 | 0.00% | 0.00% |  |
| B | 93540 | 81103 | 0 | 0 | 0.00% | 0.00% |  |
| C | 93540 | 81115 | 0 | 0 | 0.00% | 0.00% |  |
| D | 93540 | 81104 | 0 | 0 | 0.00% | 0.00% |  |
Top three noisy pixels from each quadrant. If the there are fewer than three noisy pixels in the level2.evt file, extra rows are filled as -1
| Pixel properties | Quadrant properties | ||||||
|---|---|---|---|---|---|---|---|
| Quadrant | DetID | PixID | Counts | Sigma | Mean | Median | Sigma |
| A | 0 | 29 | 4883 | 11.61 | 1281 | 1203 | 317.0 |
| A | 7 | 110 | 4020 | 8.89 | 1281 | 1203 | 317.0 |
| A | 0 | 30 | 3774 | 8.11 | 1281 | 1203 | 317.0 |
| B | 2 | 9 | 3756 | 10.49 | 1245 | 1186 | 245.1 |
| B | 2 | 8 | 3206 | 8.24 | 1245 | 1186 | 245.1 |
| B | 3 | 17 | 3121 | 7.9 | 1245 | 1186 | 245.1 |
| C | 2 | 191 | 3377 | 6.6 | 1282 | 1198 | 330.4 |
| C | 3 | 126 | 3287 | 6.32 | 1282 | 1198 | 330.4 |
| C | 12 | 241 | 3280 | 6.3 | 1282 | 1198 | 330.4 |
| D | 3 | 14 | 3031 | 5.94 | 1220 | 1111 | 323.0 |
| D | 6 | 231 | 2988 | 5.81 | 1220 | 1111 | 323.0 |
| D | 10 | 189 | 2968 | 5.75 | 1220 | 1111 | 323.0 |
Histogram calculated using DETX and DETY for each event in the final _common_clean file
| Quadrant A |  |
 |
Quadrant B |
|---|---|---|---|
| Quadrant D | 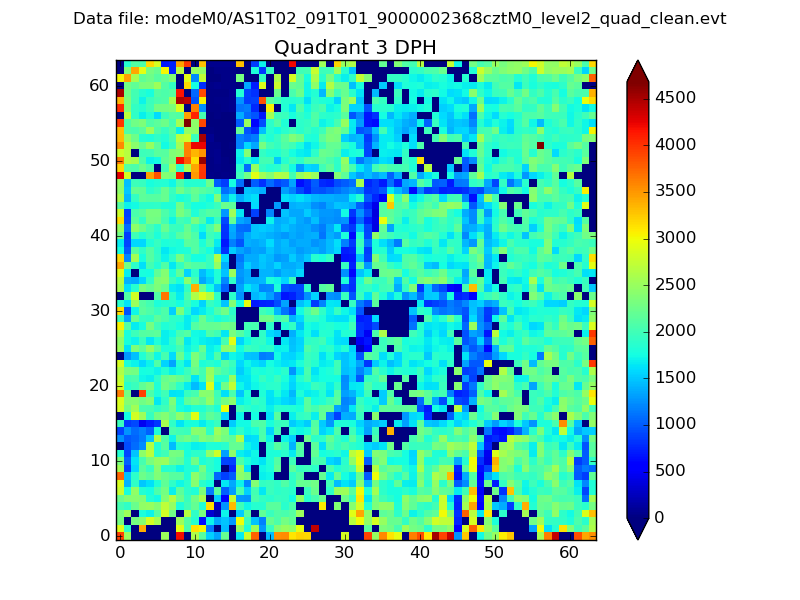 |
 |
Quadrant C |
| Plot type | Count rate plots | Images |
|---|---|---|
| Comparison with Poisson distribution Blue bars denote a histogram of data divided into 1 sec bins. Red curve is a Poisson curve with rate = median count rate of data. |
 |
 |
| Quadrant-wise count rates Data is divided into 100 sec bins |
 |
|
| Module-wise count rates for Quadrant A Data is divided into 100 sec bins |
 |
 |
| Module-wise count rates for Quadrant B Data is divided into 100 sec bins |
 |
 |
| Module-wise count rates for Quadrant C Data is divided into 100 sec bins |
 |
 |
| Module-wise count rates for Quadrant D Data is divided into 100 sec bins |
 |
 |
| Parameter | Plot |
|---|---|
| CZT HV Monitor |  |
| D_VDD |  |
| Temperature 1 |  |
| Veto HV Monitor |  |
| Veto LLD |  |
| Alpha Counter |  |
| _CPM_Rate |  |
| CZT Counter |  |
| +2.5 Volts monitor |  |
| +5 Volts monitor |  |
| _ROLL_ROT |  |
| _Roll_DEC |  |
| _Roll_RA |  |
| Veto Counter |  |