| Param | Original file | Final file |
|---|---|---|
| Filename | modeM0/AS1T02_091T01_9000002368_16016cztM0_level2.evt | modeM0/AS1T02_091T01_9000002368_16016cztM0_level2_quad_clean.evt |
| Size (bytes) | 85,746,240 | 25,237,440 |
| Size | 81.8 MB | 24.1 MB |
| Events in quadrant A | 623,081 | 169,572 |
| Events in quadrant B | 650,422 | 172,892 |
| Events in quadrant C | 636,774 | 166,278 |
| Events in quadrant D | 601,308 | 163,685 |
| Mode SS | |||
|---|---|---|---|
| Quadrant | BADHDUFLAG | Total packets | Discarded packets |
| A | 0 | 26 | 0 |
| B | 0 | 26 | 0 |
| C | 0 | 26 | 0 |
| D | 0 | 26 | 0 |
| Mode M9 | |||
|---|---|---|---|
| Quadrant | BADHDUFLAG | Total packets | Discarded packets |
| A | 0 | 5 | 0 |
| B | 0 | 5 | 0 |
| C | 0 | 5 | 0 |
| D | 0 | 5 | 0 |
| Mode M0 | |||
|---|---|---|---|
| Quadrant | BADHDUFLAG | Total packets | Discarded packets |
| A | 0 | 2679 | 2 |
| B | 0 | 2734 | 1 |
| C | 0 | 2686 | 1 |
| D | 0 | 2664 | 1 |
| Quadrant | Total seconds | Saturated seconds | Saturation percentage |
|---|---|---|---|
| A | 1209 | 50 | 4.135649% |
| B | 1209 | 64 | 5.293631% |
| C | 1209 | 69 | 5.707196% |
| D | 1209 | 38 | 3.143093% |
Noise dominated data is calculated using 1-second bins in cleaned event files. If a bin has >2000 counts, and if more than 50% of those come from <1% of pixels, then it is considered to be noise-dominated and hence unusable.
| Quadrant | # 1 sec bins | Bins with >0 counts | Bins with >2000 counts | High rate bins dominated by noise | Noise dominated (total time) | Noise dominated (detector-on time) | Marked lightcurve |
|---|---|---|---|---|---|---|---|
| A | 1655 | 1210 | 1 | 1 | 0.06% | 0.08% | 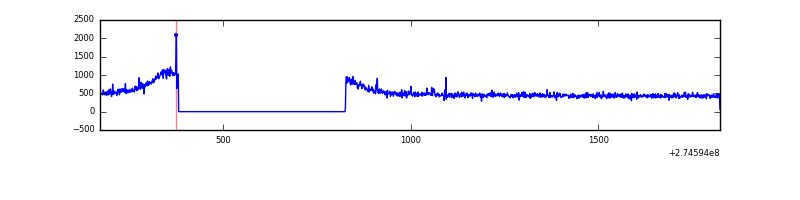 |
| B | 1655 | 1210 | 1 | 1 | 0.06% | 0.08% | 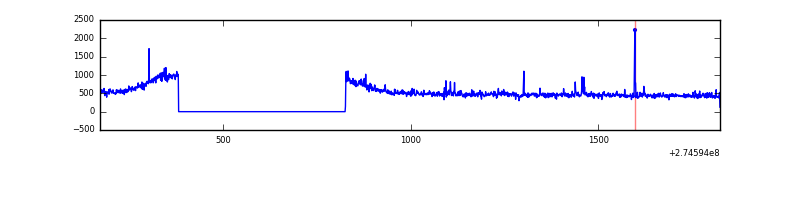 |
| C | 1655 | 1211 | 0 | 0 | 0.00% | 0.00% | 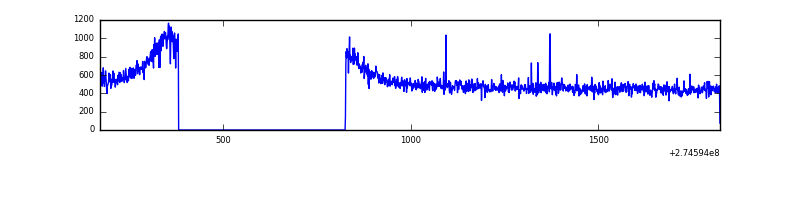 |
| D | 1655 | 1210 | 1 | 1 | 0.06% | 0.08% | 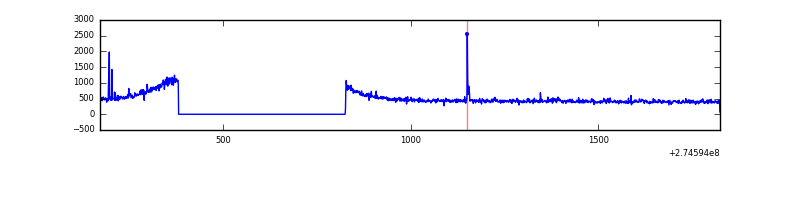 |
Top three noisy pixels from each quadrant. If the there are fewer than three noisy pixels in the level2.evt file, extra rows are filled as -1
| Pixel properties | Quadrant properties | ||||||
|---|---|---|---|---|---|---|---|
| Quadrant | DetID | PixID | Counts | Sigma | Mean | Median | Sigma |
| A | 14 | 239 | 2961 | 80.08 | 159 | 156 | 35.0 |
| A | 3 | 1 | 2013 | 53.01 | 159 | 156 | 35.0 |
| A | 12 | 96 | 1796 | 46.82 | 159 | 156 | 35.0 |
| B | 4 | 173 | 15528 | 448.13 | 162 | 158 | 34.3 |
| B | 12 | 111 | 3860 | 107.94 | 162 | 158 | 34.3 |
| B | 11 | 111 | 3162 | 87.59 | 162 | 158 | 34.3 |
| C | 14 | 238 | 23539 | 590.68 | 155 | 156 | 39.6 |
| C | 3 | 233 | 6476 | 159.65 | 155 | 156 | 39.6 |
| C | 10 | 22 | 1344 | 30.01 | 155 | 156 | 39.6 |
| D | 9 | 85 | 5149 | 120.74 | 155 | 150 | 41.4 |
| D | 2 | 152 | 4524 | 105.64 | 155 | 150 | 41.4 |
| D | 2 | 234 | 4194 | 97.67 | 155 | 150 | 41.4 |
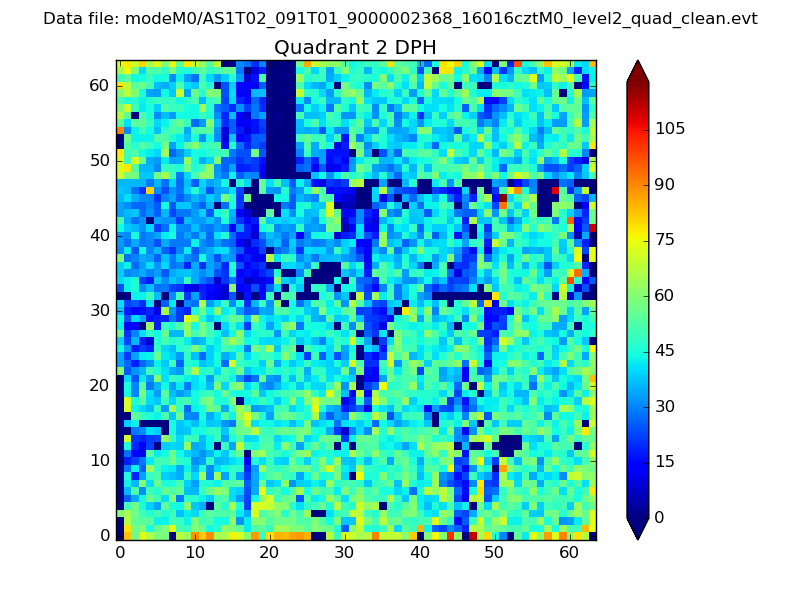
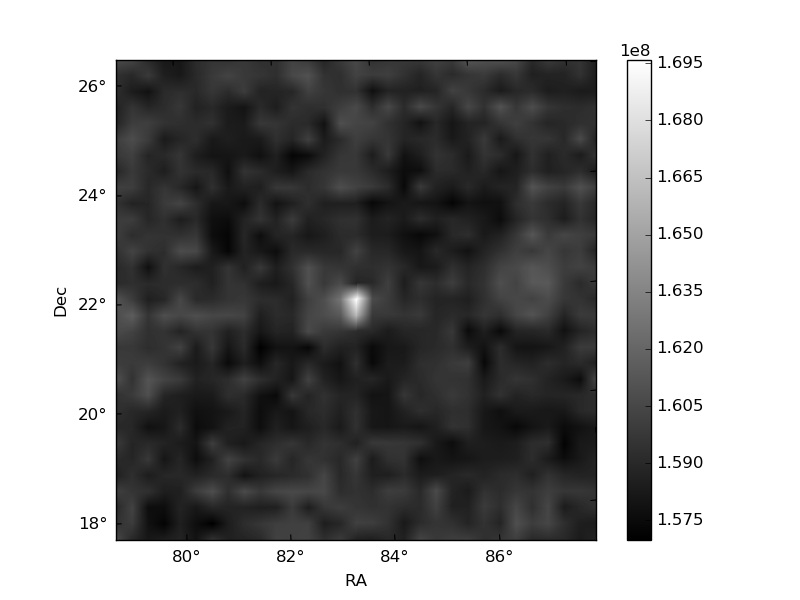
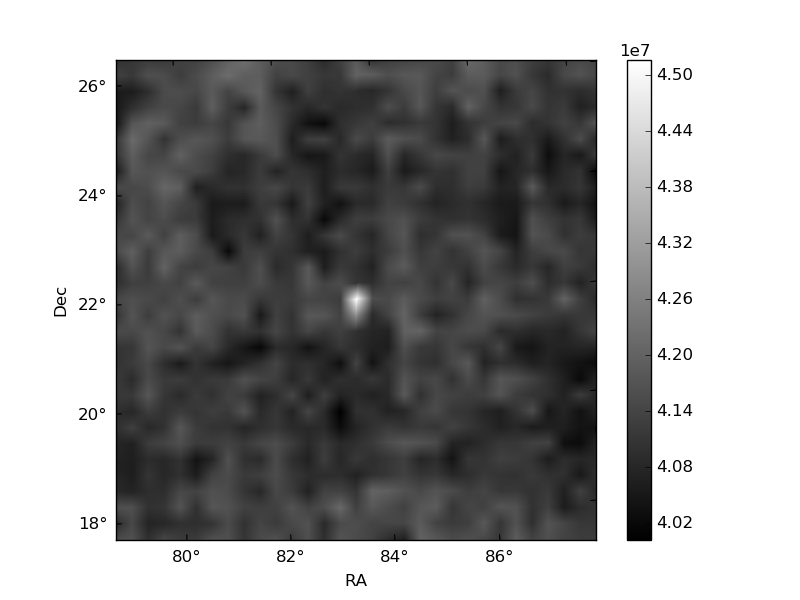
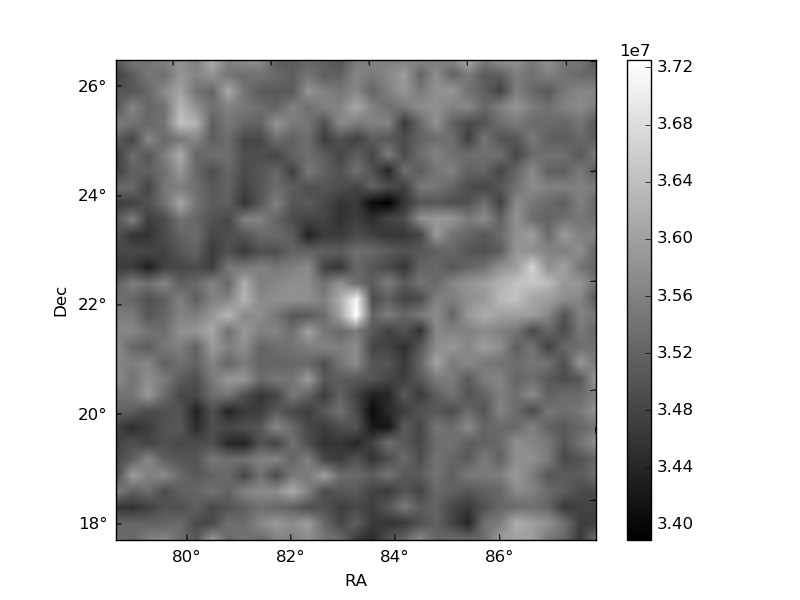
Histogram calculated using DETX and DETY for each event in the final _common_clean file
| Quadrant A | 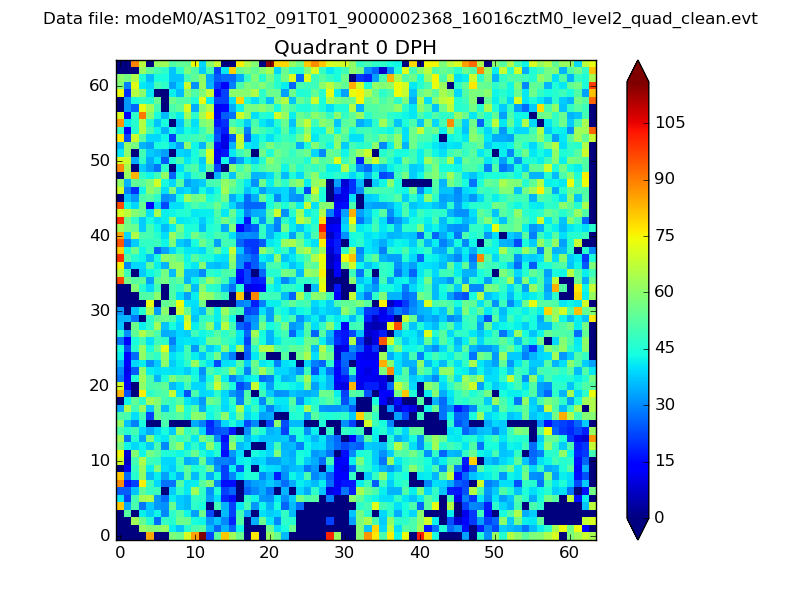 |
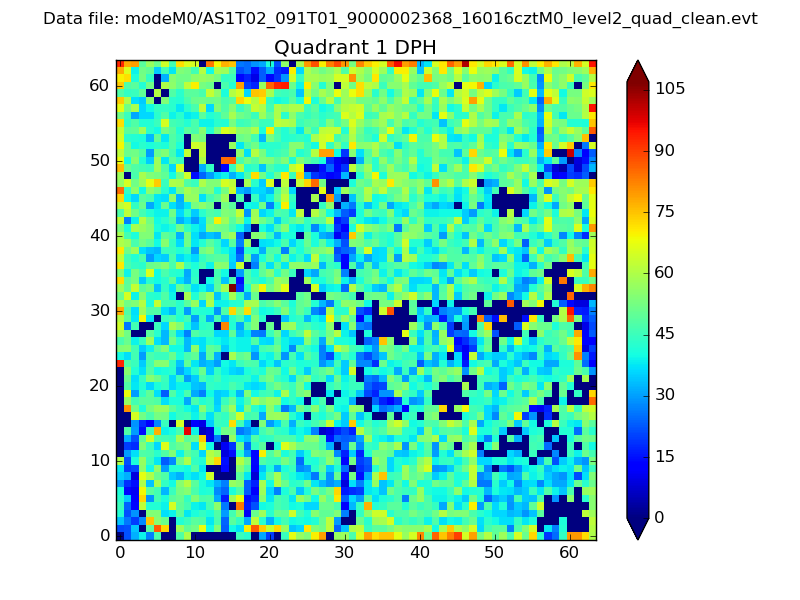 |
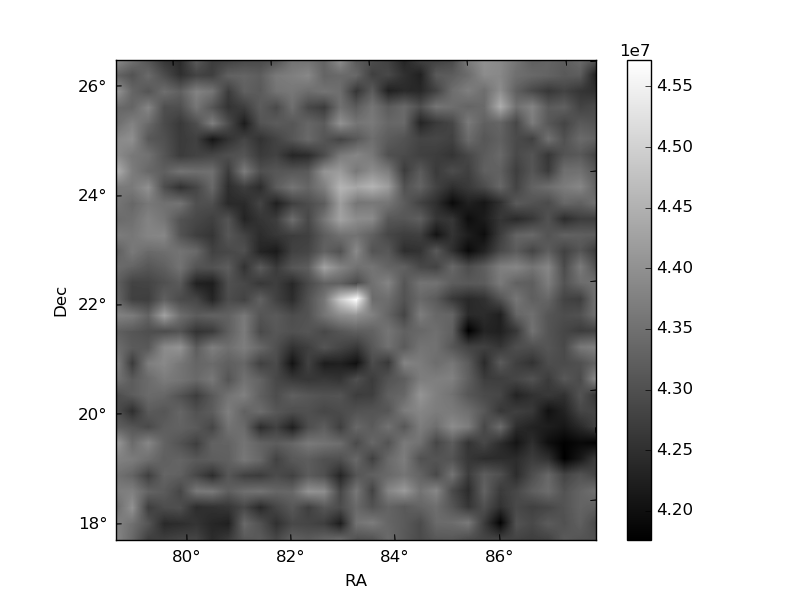
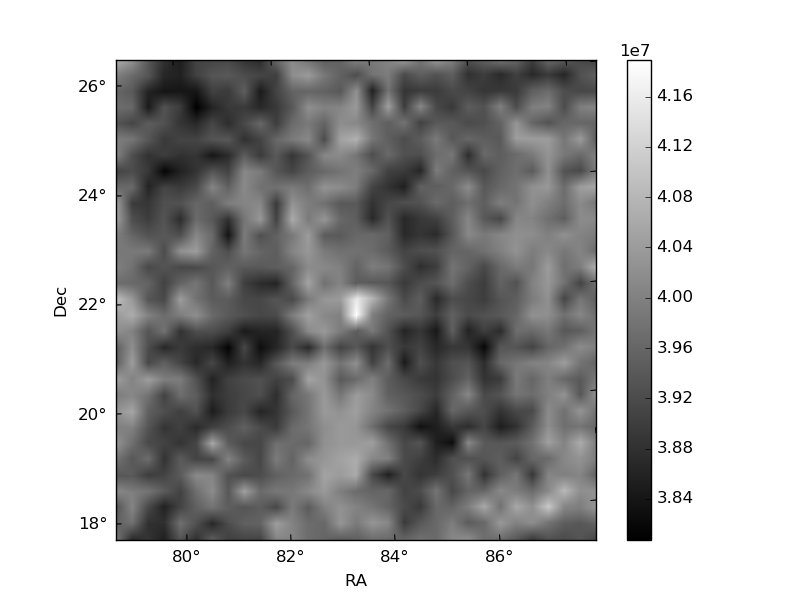
Quadrant B |
|---|---|---|---|
| Quadrant D | 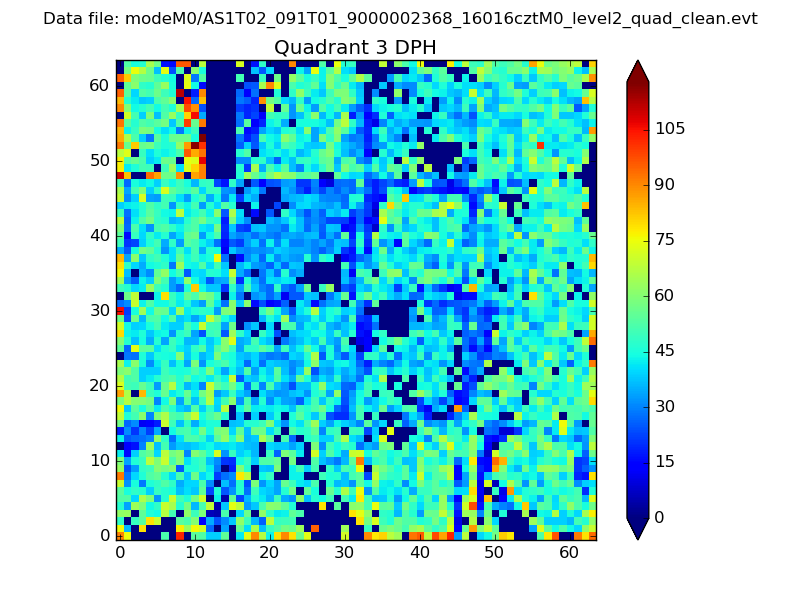 |
 |
Quadrant C |
| Plot type | Count rate plots | Images |
|---|---|---|
| Comparison with Poisson distribution Blue bars denote a histogram of data divided into 1 sec bins. Red curve is a Poisson curve with rate = median count rate of data. |
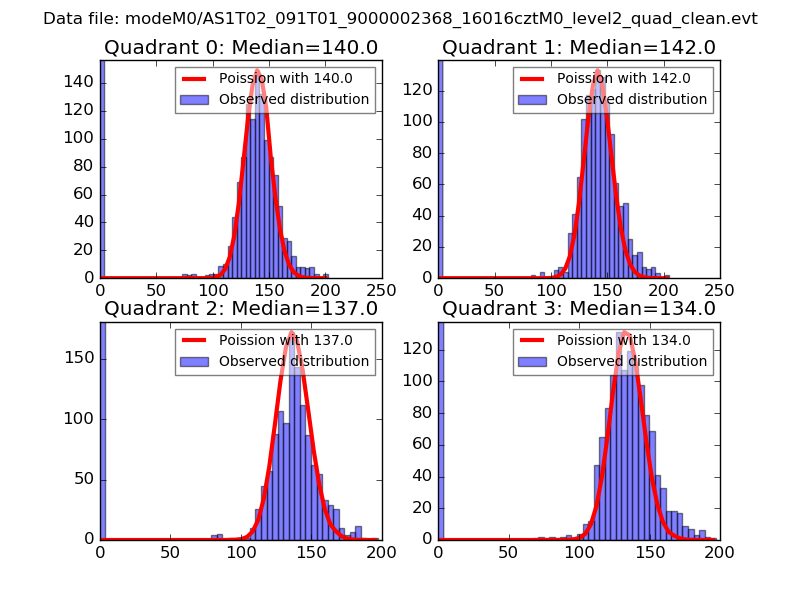 |
 |
| Quadrant-wise count rates Data is divided into 100 sec bins |
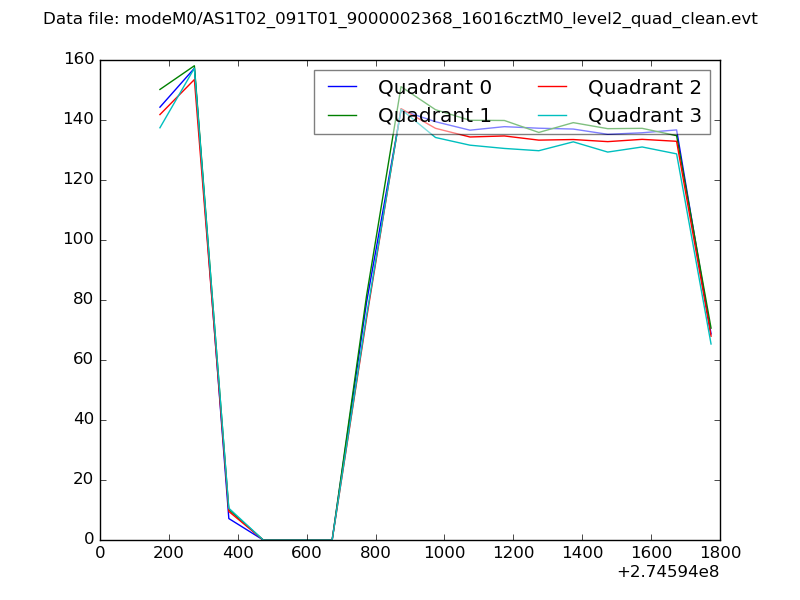 |
|
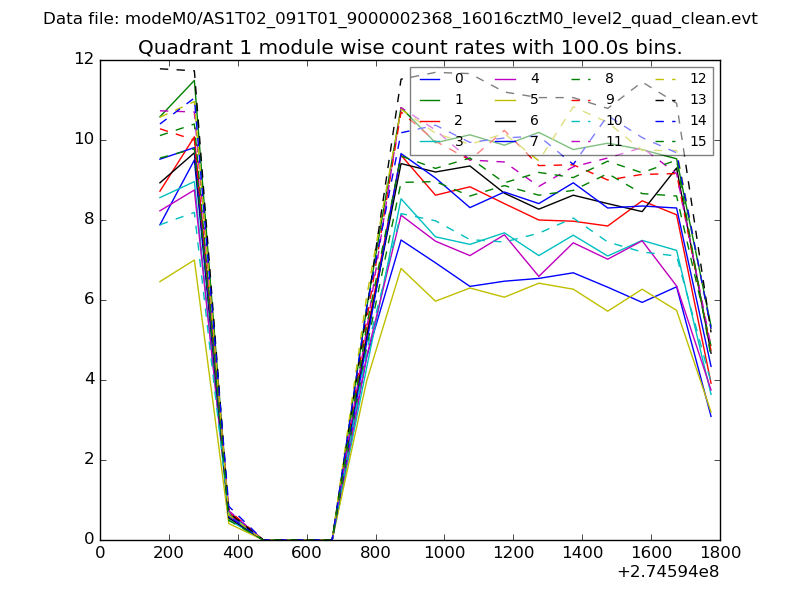
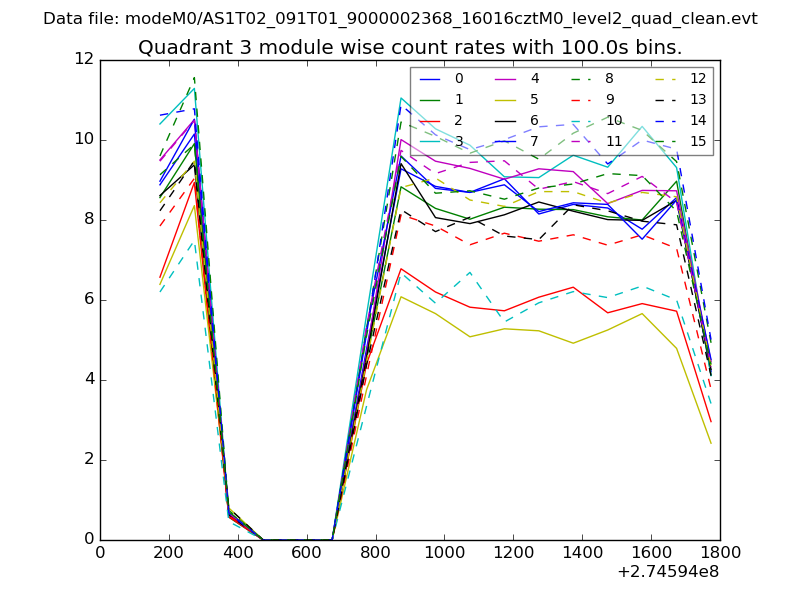
| Module-wise count rates for Quadrant A Data is divided into 100 sec bins |
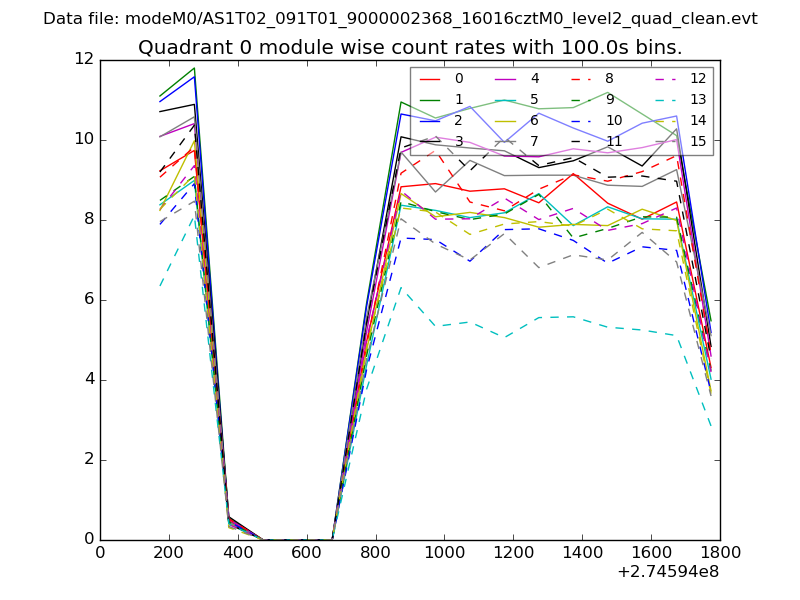 |
 |
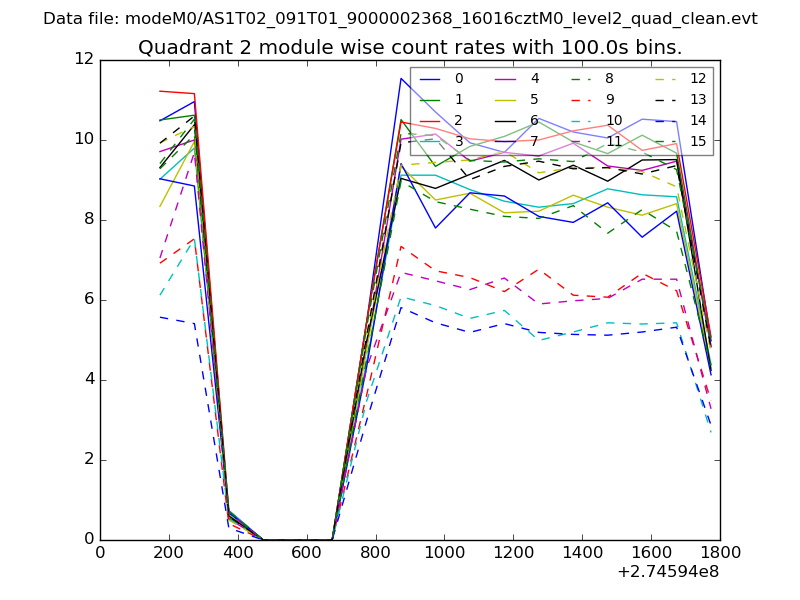
| Module-wise count rates for Quadrant B Data is divided into 100 sec bins |
 |
 |
| Module-wise count rates for Quadrant C Data is divided into 100 sec bins |
 |
 |
| Module-wise count rates for Quadrant D Data is divided into 100 sec bins |
 |
 |
| Parameter | Plot |
|---|---|
| CZT HV Monitor | 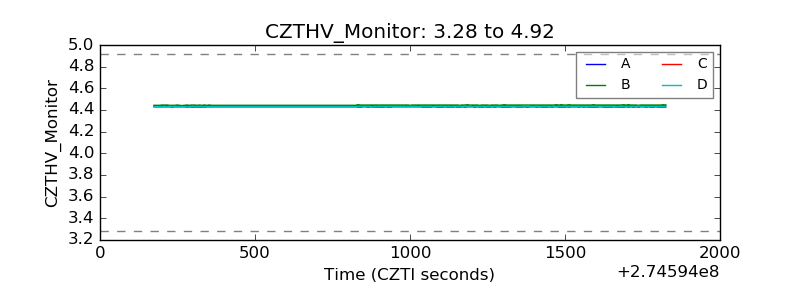 |
| D_VDD | 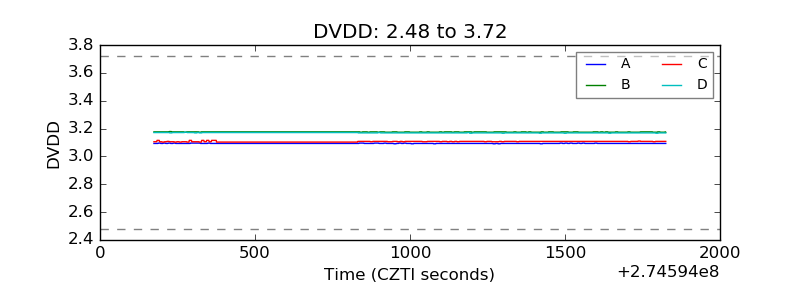 |
| Temperature 1 | 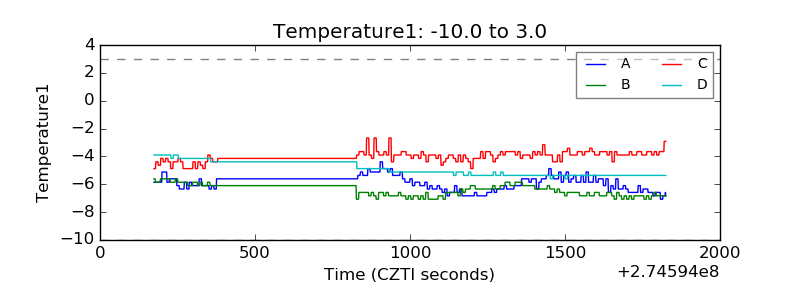 |
| Veto HV Monitor | 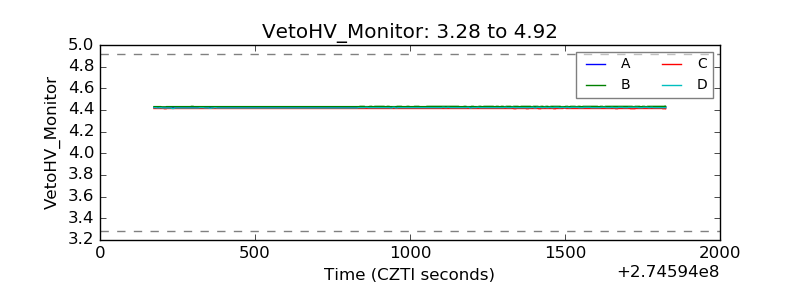 |
| Veto LLD | 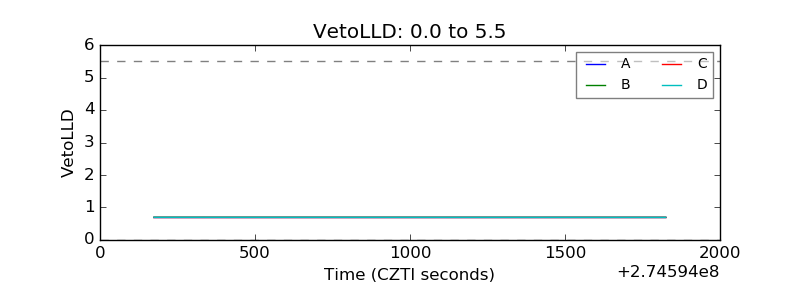 |
| Alpha Counter | 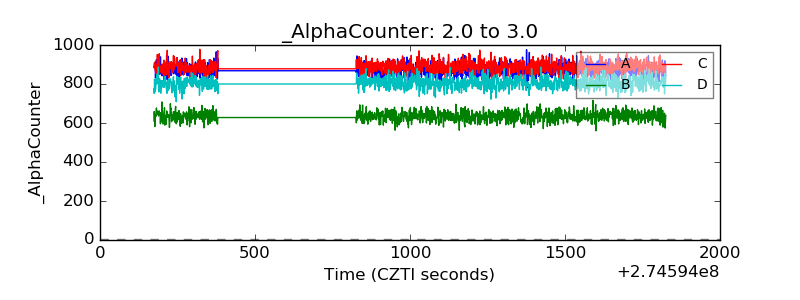 |
| _CPM_Rate | 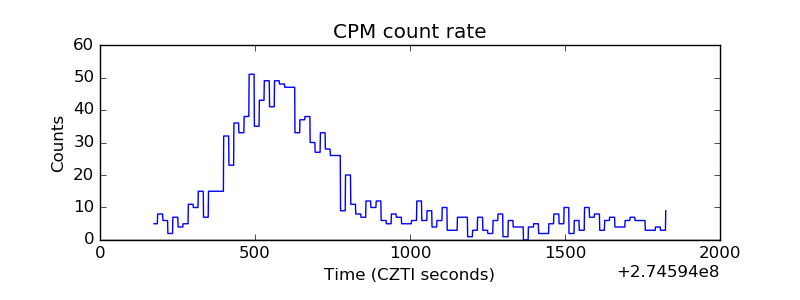 |
| CZT Counter | 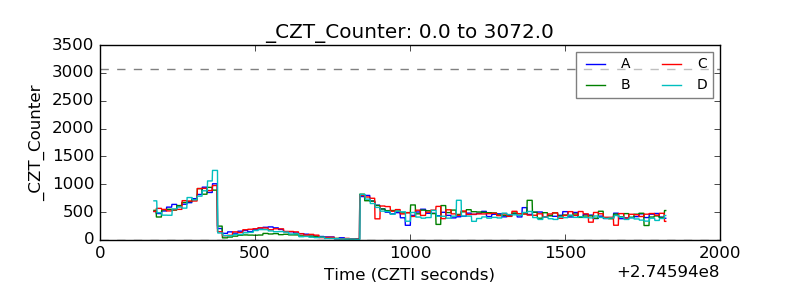 |
| +2.5 Volts monitor | 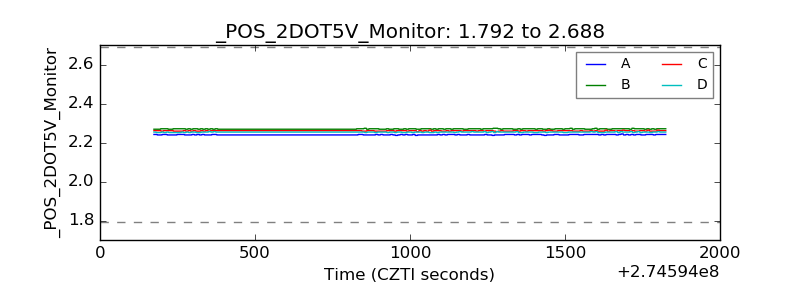 |
| +5 Volts monitor |  |
| _ROLL_ROT | 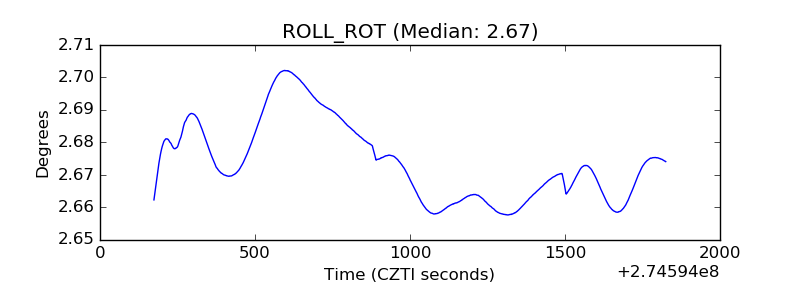 |
| _Roll_DEC | 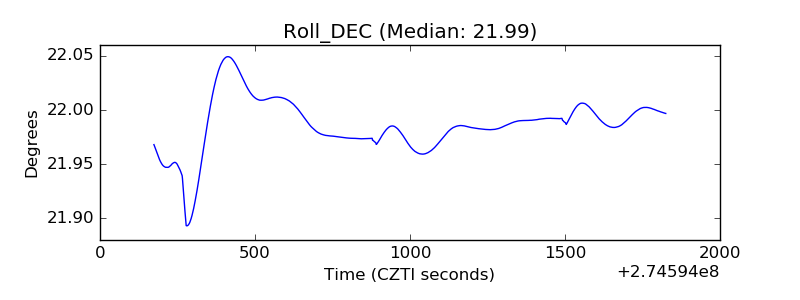 |
| _Roll_RA | 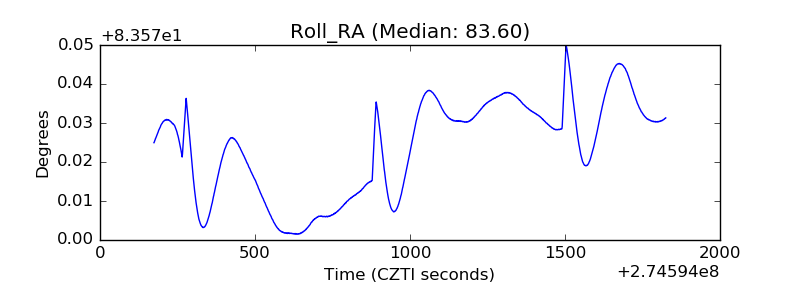 |
| Veto Counter | 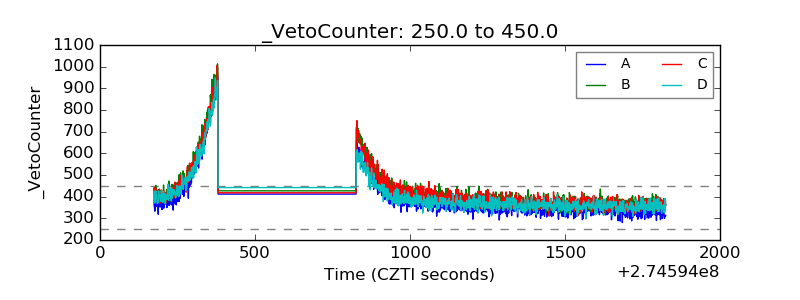 |