| Param | Original file | Final file |
|---|---|---|
| Filename | modeM0/AS1T02_091T01_9000002368_16018cztM0_level2.evt | modeM0/AS1T02_091T01_9000002368_16018cztM0_level2_quad_clean.evt |
| Size (bytes) | 411,508,800 | 83,730,240 |
| Size | 392.4 MB | 79.9 MB |
| Events in quadrant A | 2,968,732 | 535,503 |
| Events in quadrant B | 3,041,151 | 543,122 |
| Events in quadrant C | 3,148,108 | 519,442 |
| Events in quadrant D | 2,889,424 | 511,323 |
| Mode SS | |||
|---|---|---|---|
| Quadrant | BADHDUFLAG | Total packets | Discarded packets |
| A | 0 | 124 | 0 |
| B | 0 | 124 | 0 |
| C | 0 | 124 | 0 |
| D | 0 | 124 | 0 |
| Mode M9 | |||
|---|---|---|---|
| Quadrant | BADHDUFLAG | Total packets | Discarded packets |
| A | 0 | 10 | 0 |
| B | 0 | 10 | 0 |
| C | 0 | 10 | 0 |
| D | 0 | 10 | 0 |
| Mode M0 | |||
|---|---|---|---|
| Quadrant | BADHDUFLAG | Total packets | Discarded packets |
| A | 0 | 12533 | 2 |
| B | 0 | 12672 | 1 |
| C | 0 | 13014 | 1 |
| D | 0 | 12502 | 1 |
| Quadrant | Total seconds | Saturated seconds | Saturation percentage |
|---|---|---|---|
| A | 6105 | 46 | 0.753481% |
| B | 6105 | 49 | 0.802621% |
| C | 6105 | 72 | 1.179361% |
| D | 6105 | 31 | 0.507781% |
Noise dominated data is calculated using 1-second bins in cleaned event files. If a bin has >2000 counts, and if more than 50% of those come from <1% of pixels, then it is considered to be noise-dominated and hence unusable.
| Quadrant | # 1 sec bins | Bins with >0 counts | Bins with >2000 counts | High rate bins dominated by noise | Noise dominated (total time) | Noise dominated (detector-on time) | Marked lightcurve |
|---|---|---|---|---|---|---|---|
| A | 7091 | 6106 | 2 | 2 | 0.03% | 0.03% | 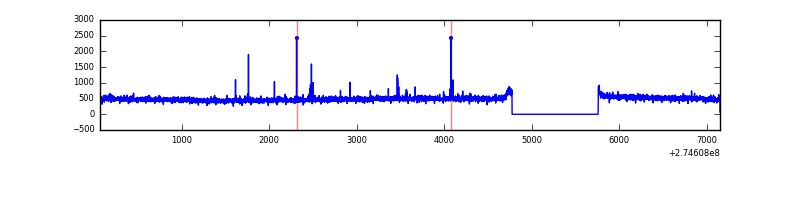 |
| B | 7091 | 6106 | 5 | 5 | 0.07% | 0.08% | 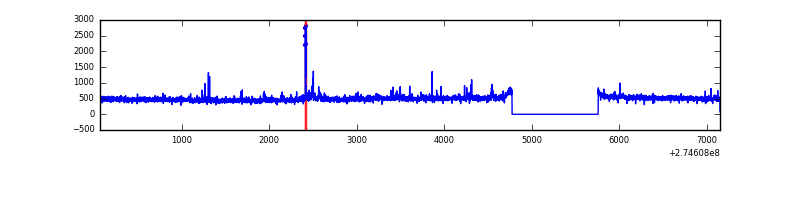 |
| C | 7091 | 6106 | 5 | 5 | 0.07% | 0.08% | 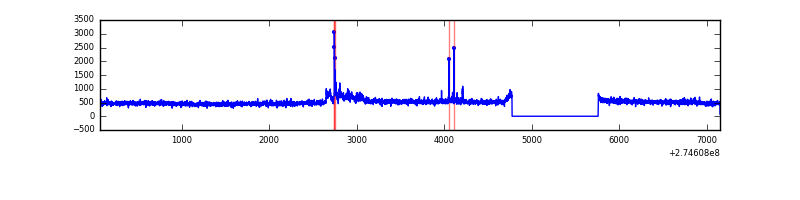 |
| D | 7091 | 6106 | 1 | 1 | 0.01% | 0.02% | 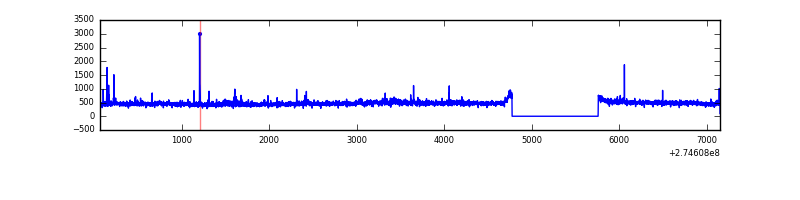 |
Top three noisy pixels from each quadrant. If the there are fewer than three noisy pixels in the level2.evt file, extra rows are filled as -1
| Pixel properties | Quadrant properties | ||||||
|---|---|---|---|---|---|---|---|
| Quadrant | DetID | PixID | Counts | Sigma | Mean | Median | Sigma |
| A | 12 | 96 | 16836 | 104.77 | 762 | 748 | 153.5 |
| A | 9 | 143 | 13044 | 80.08 | 762 | 748 | 153.5 |
| A | 0 | 226 | 6618 | 38.23 | 762 | 748 | 153.5 |
| B | 4 | 216 | 33395 | 224.14 | 755 | 738 | 145.7 |
| B | 12 | 111 | 16474 | 108.0 | 755 | 738 | 145.7 |
| B | 7 | 220 | 14504 | 94.48 | 755 | 738 | 145.7 |
| C | 3 | 233 | 197378 | 1157.51 | 722 | 729 | 169.9 |
| C | 14 | 238 | 112233 | 656.33 | 722 | 729 | 169.9 |
| C | 7 | 247 | 21384 | 121.58 | 722 | 729 | 169.9 |
| D | 2 | 152 | 57750 | 313.93 | 738 | 717 | 181.7 |
| D | 2 | 234 | 23431 | 125.03 | 738 | 717 | 181.7 |
| D | 2 | 14 | 21900 | 116.6 | 738 | 717 | 181.7 |
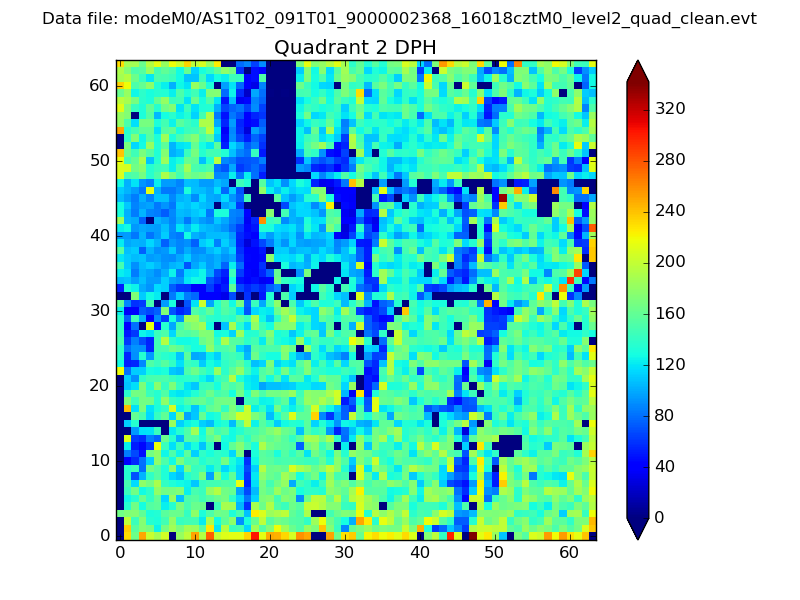
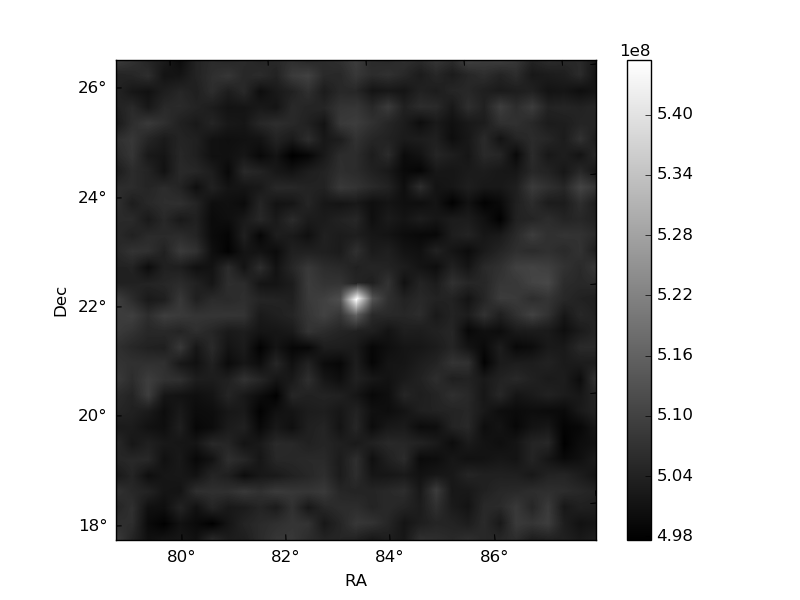
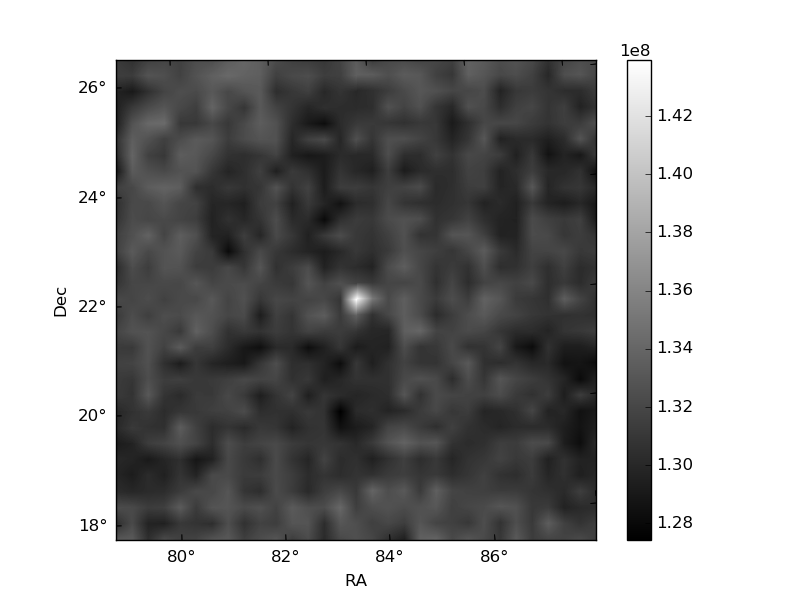
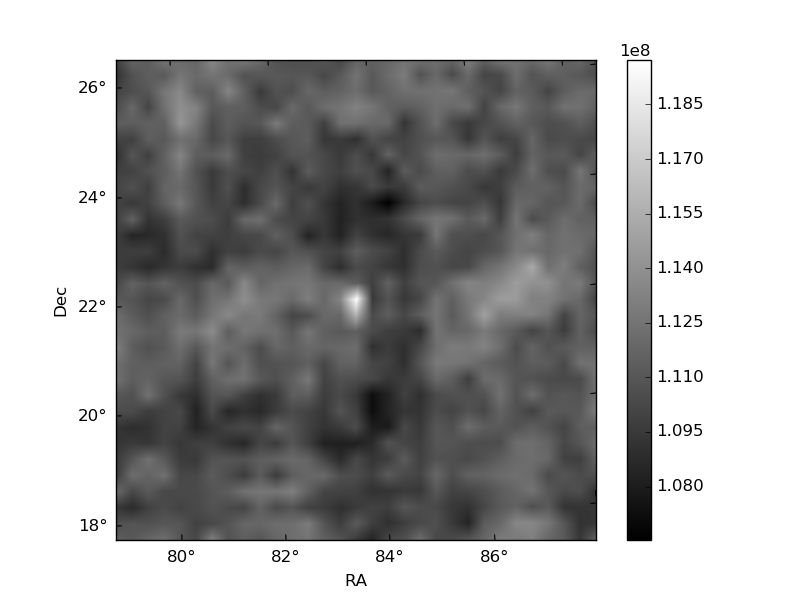
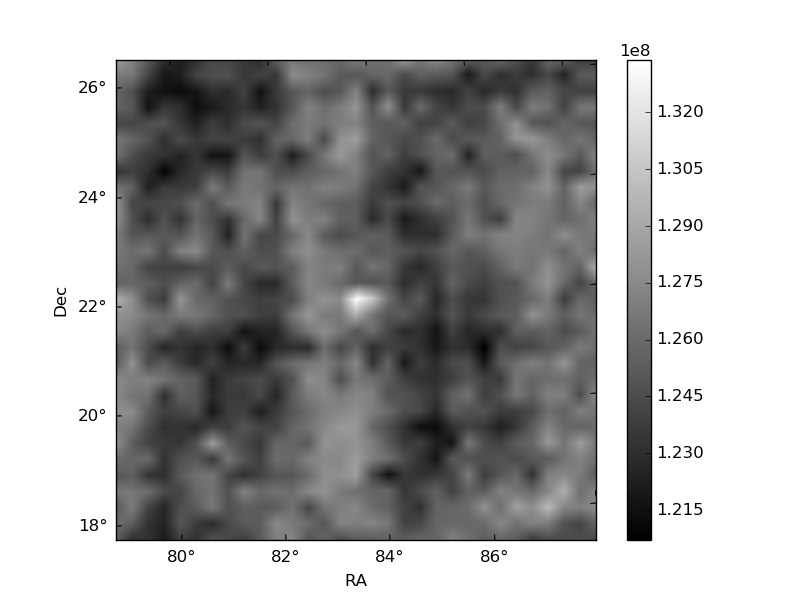
Histogram calculated using DETX and DETY for each event in the final _common_clean file
| Quadrant A | 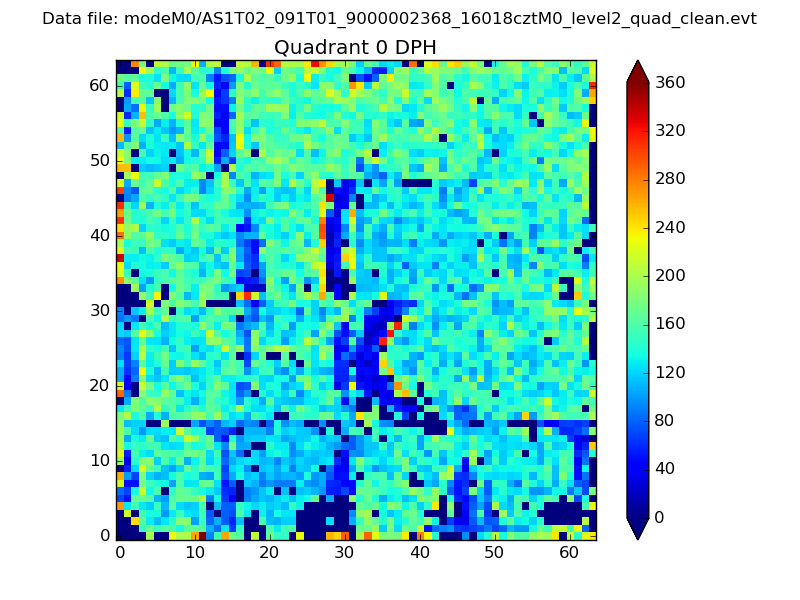 |
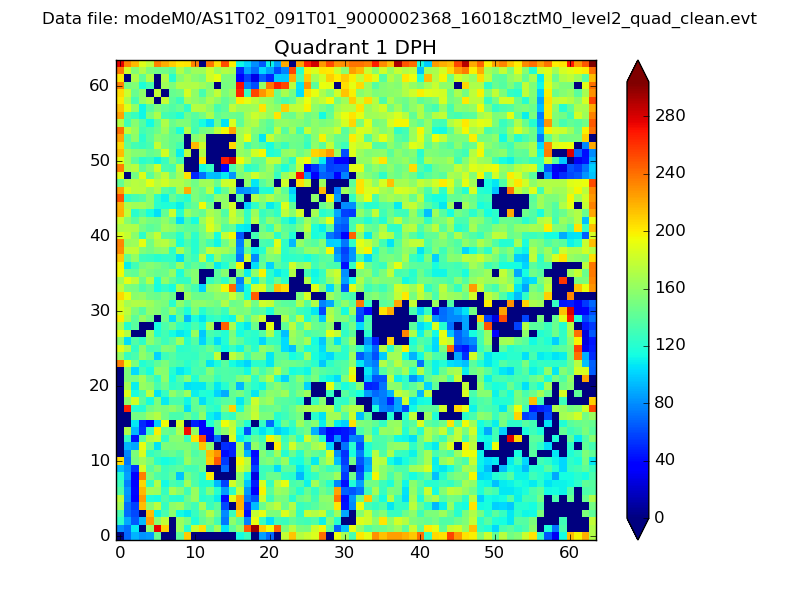 |
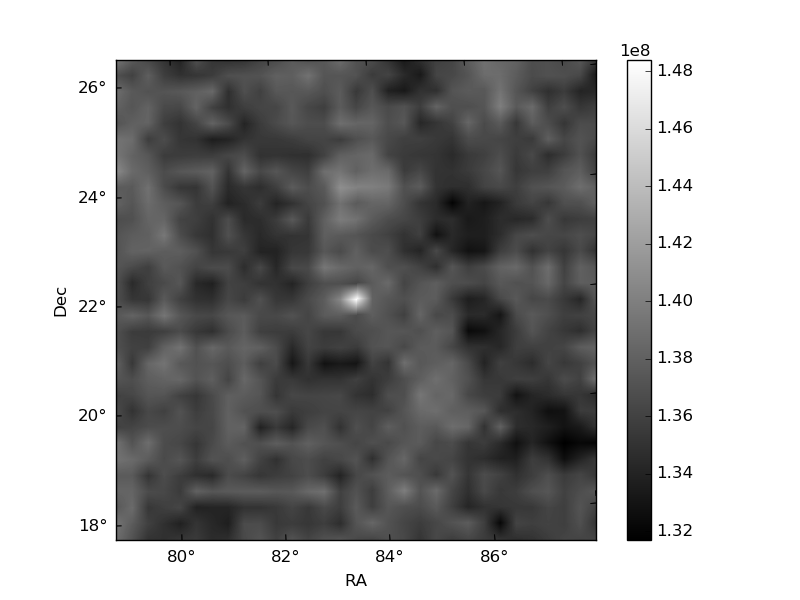
Quadrant B |
|---|---|---|---|
| Quadrant D | 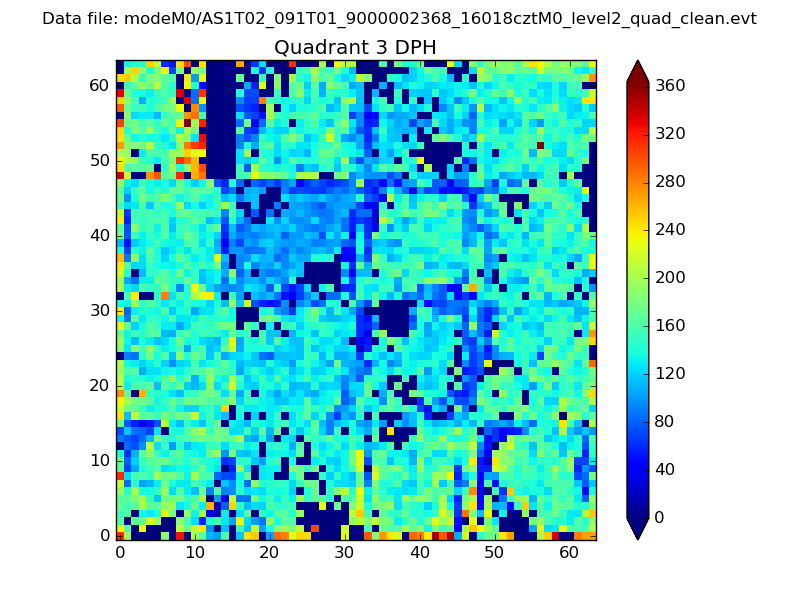 |
 |
Quadrant C |
| Plot type | Count rate plots | Images |
|---|---|---|
| Comparison with Poisson distribution Blue bars denote a histogram of data divided into 1 sec bins. Red curve is a Poisson curve with rate = median count rate of data. |
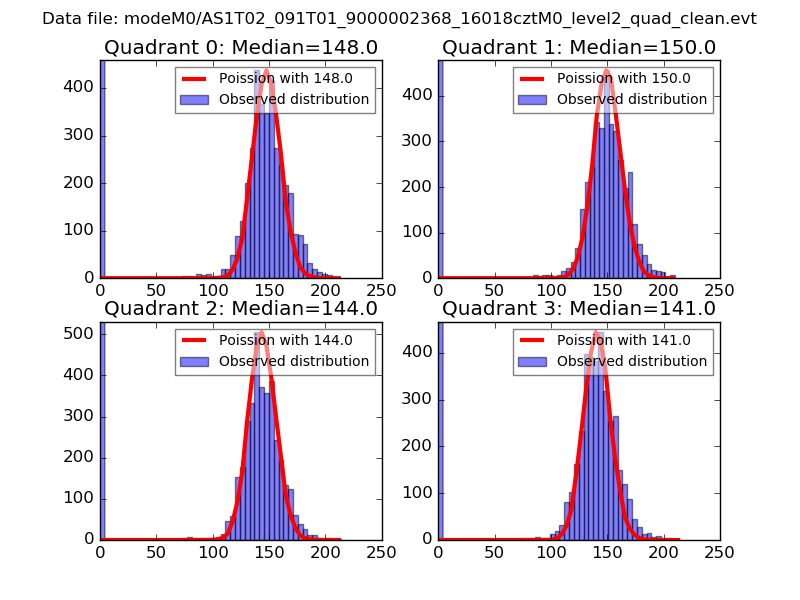 |
 |
| Quadrant-wise count rates Data is divided into 100 sec bins |
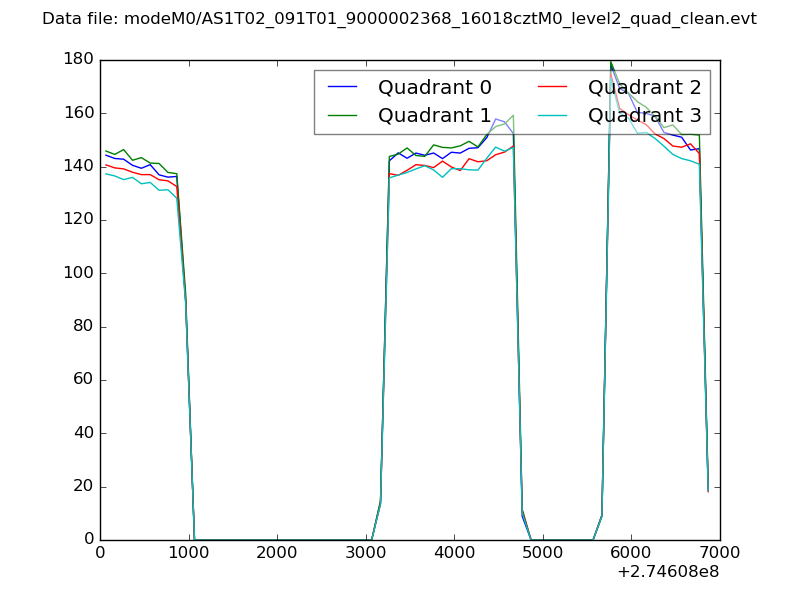 |
|
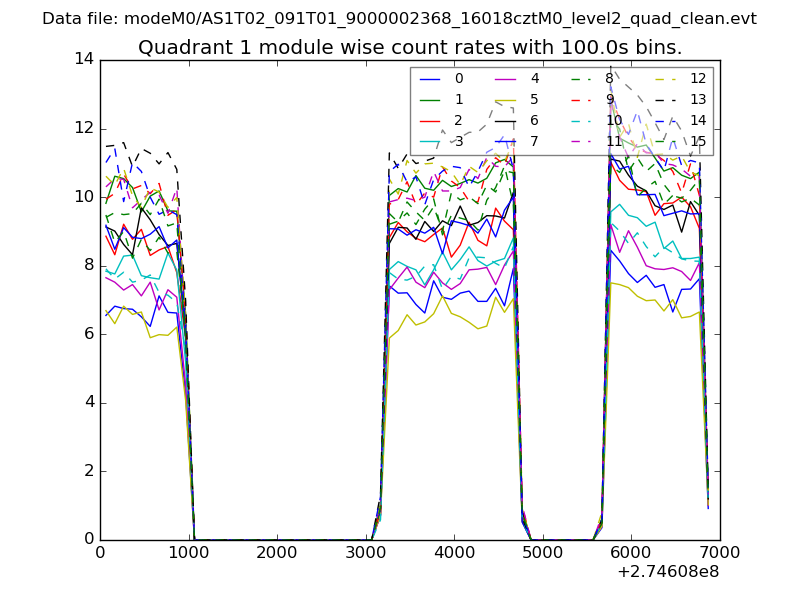
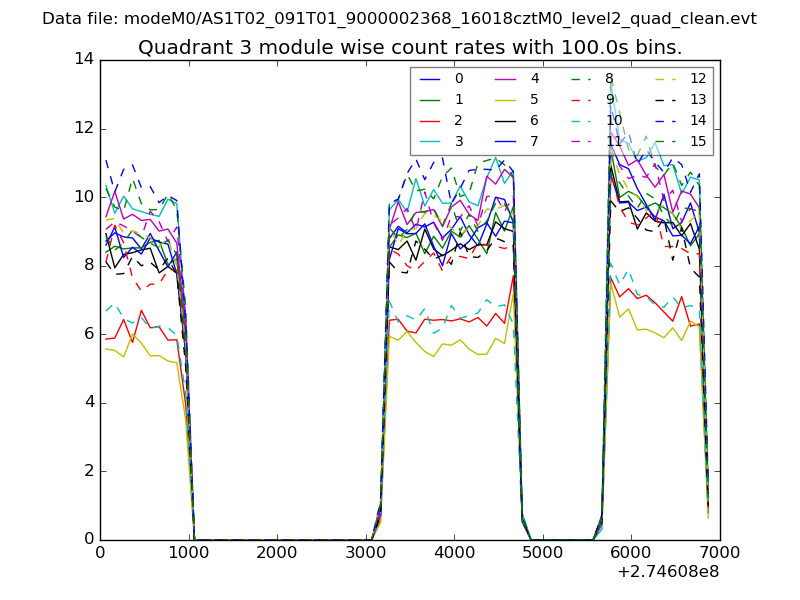
| Module-wise count rates for Quadrant A Data is divided into 100 sec bins |
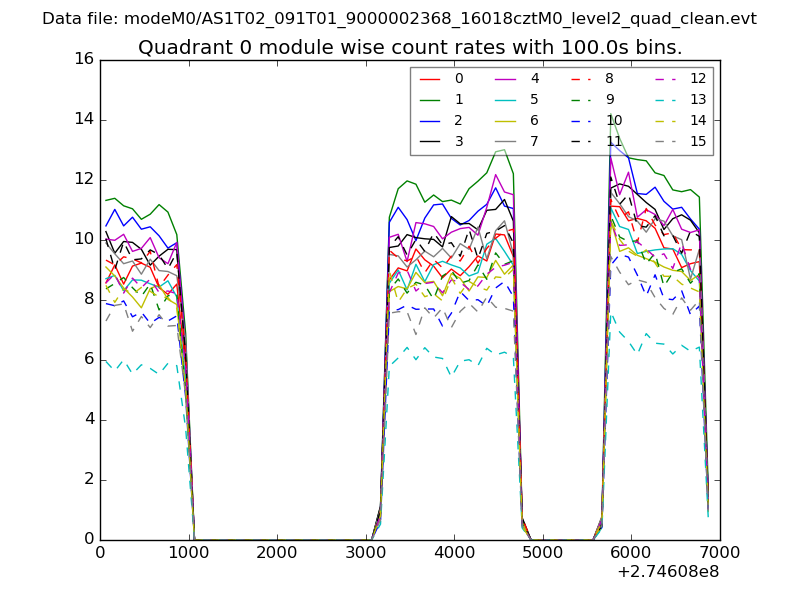 |
 |
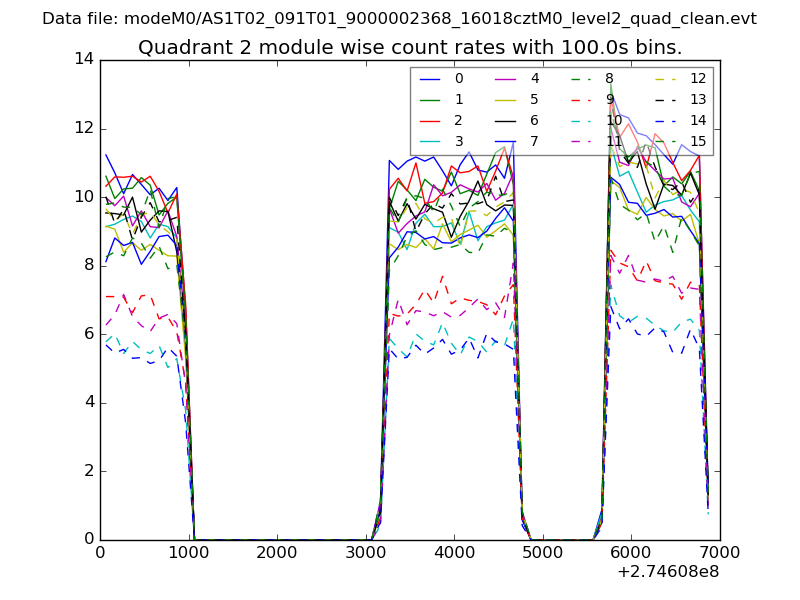
| Module-wise count rates for Quadrant B Data is divided into 100 sec bins |
 |
 |
| Module-wise count rates for Quadrant C Data is divided into 100 sec bins |
 |
 |
| Module-wise count rates for Quadrant D Data is divided into 100 sec bins |
 |
 |
| Parameter | Plot |
|---|---|
| CZT HV Monitor | 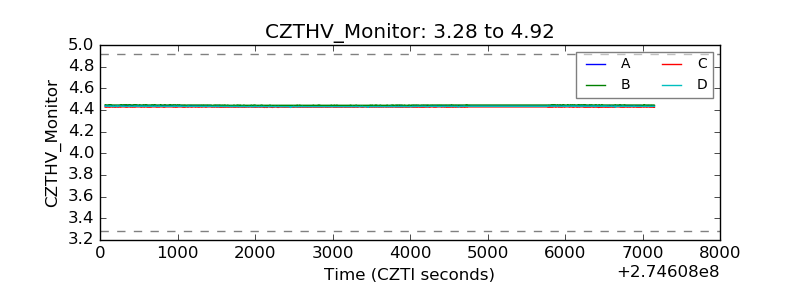 |
| D_VDD | 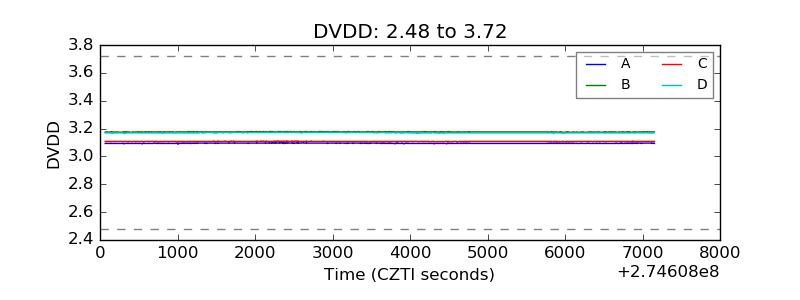 |
| Temperature 1 | 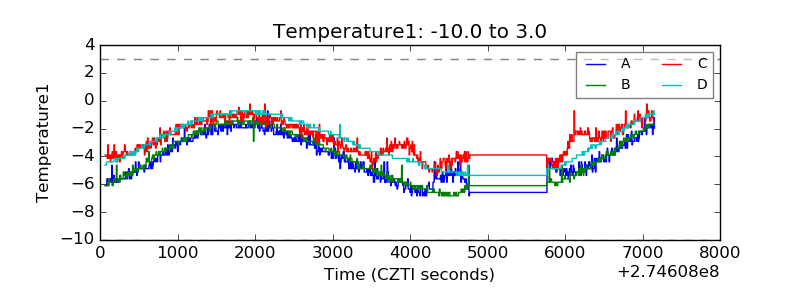 |
| Veto HV Monitor | 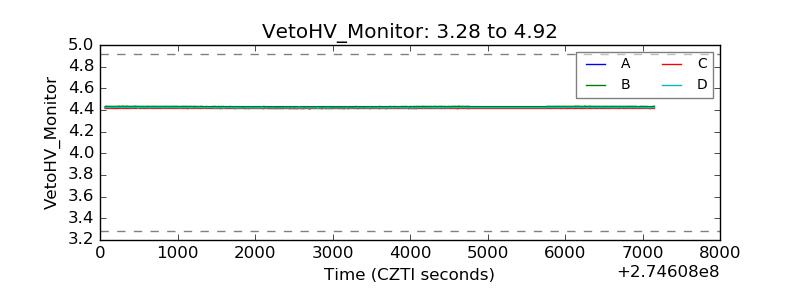 |
| Veto LLD |  |
| Alpha Counter | 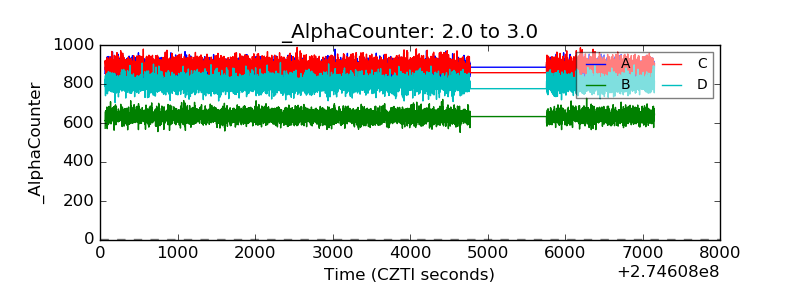 |
| _CPM_Rate | 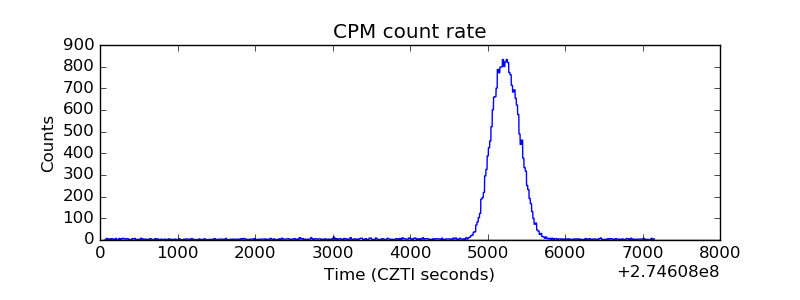 |
| CZT Counter | 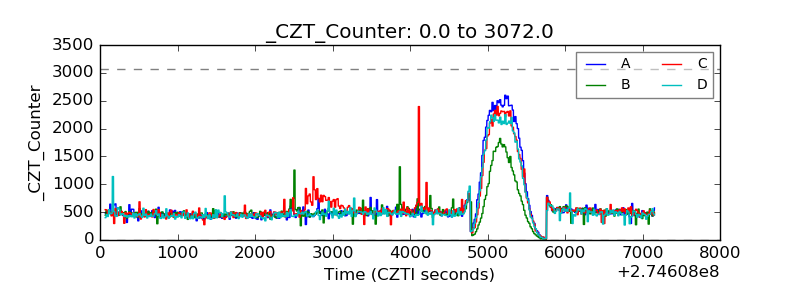 |
| +2.5 Volts monitor |  |
| +5 Volts monitor | 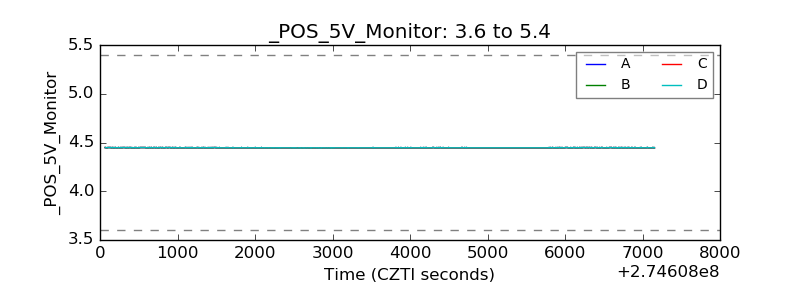 |
| _ROLL_ROT | 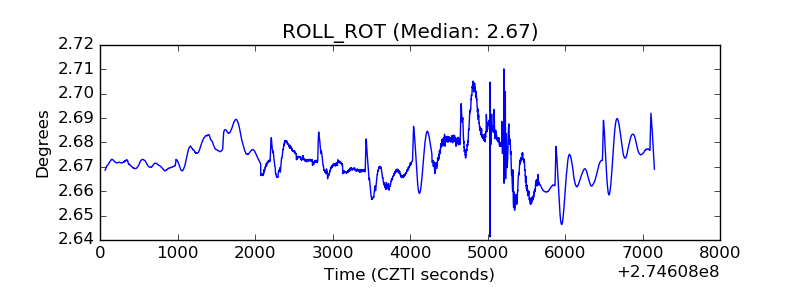 |
| _Roll_DEC | 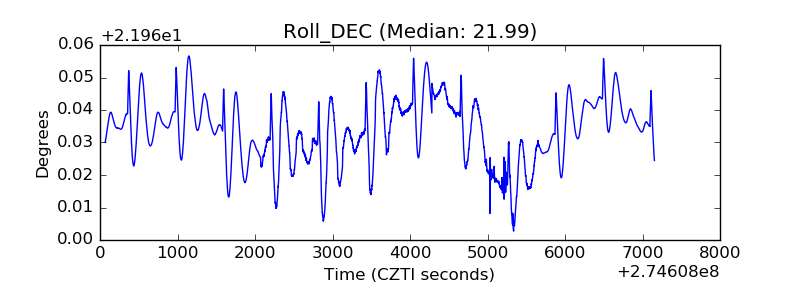 |
| _Roll_RA | 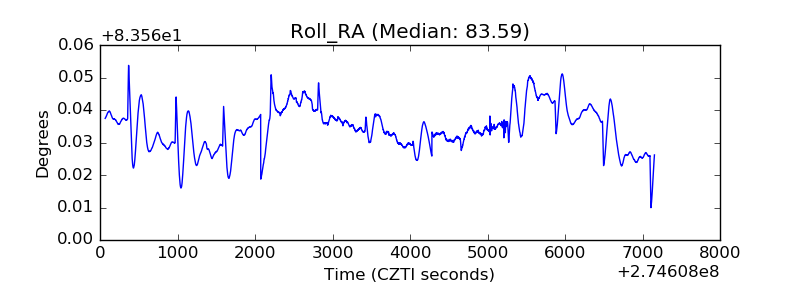 |
| Veto Counter | 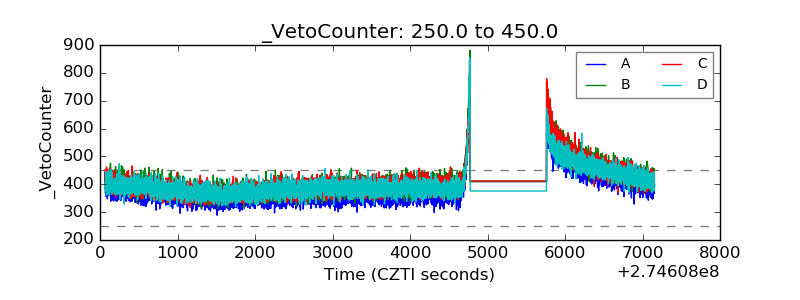 |