| Param | Original file | Final file |
|---|---|---|
| Filename | modeM0/AS1T02_091T01_9000002368_16020cztM0_level2.evt | modeM0/AS1T02_091T01_9000002368_16020cztM0_level2_quad_clean.evt |
| Size (bytes) | 419,169,600 | 76,884,480 |
| Size | 399.8 MB | 73.3 MB |
| Events in quadrant A | 2,990,638 | 485,256 |
| Events in quadrant B | 3,246,358 | 491,349 |
| Events in quadrant C | 3,081,245 | 470,432 |
| Events in quadrant D | 2,969,803 | 463,168 |
| Mode SS | |||
|---|---|---|---|
| Quadrant | BADHDUFLAG | Total packets | Discarded packets |
| A | 0 | 122 | 0 |
| B | 0 | 122 | 0 |
| C | 0 | 122 | 0 |
| D | 0 | 122 | 0 |
| Mode M9 | |||
|---|---|---|---|
| Quadrant | BADHDUFLAG | Total packets | Discarded packets |
| A | 0 | 11 | 0 |
| B | 0 | 11 | 0 |
| C | 0 | 11 | 0 |
| D | 0 | 11 | 0 |
| Mode M0 | |||
|---|---|---|---|
| Quadrant | BADHDUFLAG | Total packets | Discarded packets |
| A | 0 | 12532 | 2 |
| B | 0 | 13271 | 1 |
| C | 0 | 12666 | 1 |
| D | 0 | 12667 | 1 |
| Quadrant | Total seconds | Saturated seconds | Saturation percentage |
|---|---|---|---|
| A | 5980 | 41 | 0.685619% |
| B | 5980 | 85 | 1.421405% |
| C | 5980 | 74 | 1.237458% |
| D | 5980 | 30 | 0.501672% |
Noise dominated data is calculated using 1-second bins in cleaned event files. If a bin has >2000 counts, and if more than 50% of those come from <1% of pixels, then it is considered to be noise-dominated and hence unusable.
| Quadrant | # 1 sec bins | Bins with >0 counts | Bins with >2000 counts | High rate bins dominated by noise | Noise dominated (total time) | Noise dominated (detector-on time) | Marked lightcurve |
|---|---|---|---|---|---|---|---|
| A | 7096 | 5981 | 0 | 0 | 0.00% | 0.00% | 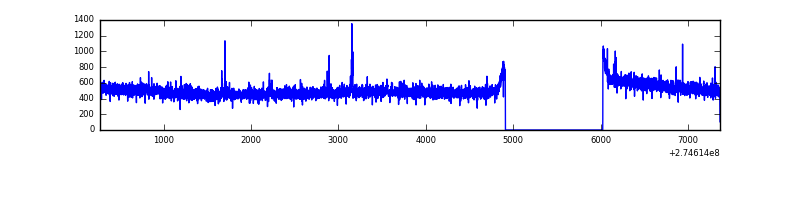 |
| B | 7096 | 5981 | 22 | 22 | 0.31% | 0.37% | 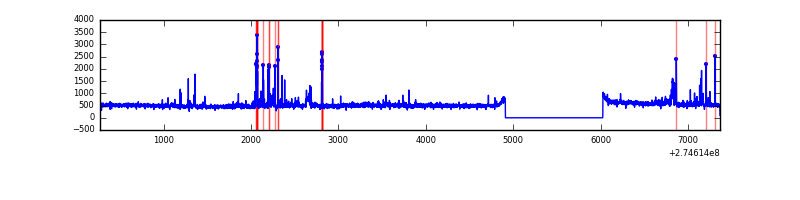 |
| C | 7096 | 5981 | 13 | 13 | 0.18% | 0.22% | 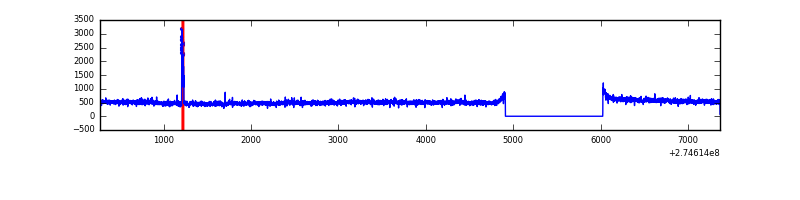 |
| D | 7096 | 5981 | 2 | 2 | 0.03% | 0.03% | 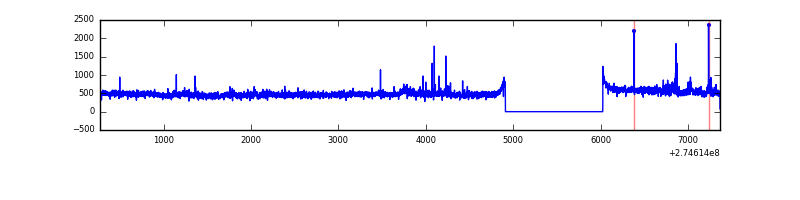 |
Top three noisy pixels from each quadrant. If the there are fewer than three noisy pixels in the level2.evt file, extra rows are filled as -1
| Pixel properties | Quadrant properties | ||||||
|---|---|---|---|---|---|---|---|
| Quadrant | DetID | PixID | Counts | Sigma | Mean | Median | Sigma |
| A | 0 | 226 | 6876 | 39.3 | 771 | 758 | 155.7 |
| A | 15 | 69 | 6594 | 37.48 | 771 | 758 | 155.7 |
| A | 12 | 96 | 6256 | 35.31 | 771 | 758 | 155.7 |
| B | 7 | 220 | 80182 | 546.36 | 764 | 746 | 145.4 |
| B | 15 | 222 | 63462 | 431.36 | 764 | 746 | 145.4 |
| B | 4 | 173 | 27877 | 186.61 | 764 | 746 | 145.4 |
| C | 14 | 238 | 114644 | 669.03 | 731 | 737 | 170.3 |
| C | 3 | 233 | 109738 | 640.21 | 731 | 737 | 170.3 |
| C | 13 | 61 | 5296 | 26.78 | 731 | 737 | 170.3 |
| D | 2 | 152 | 118528 | 597.72 | 745 | 728 | 197.1 |
| D | 2 | 234 | 24732 | 121.8 | 745 | 728 | 197.1 |
| D | 13 | 172 | 10260 | 48.37 | 745 | 728 | 197.1 |
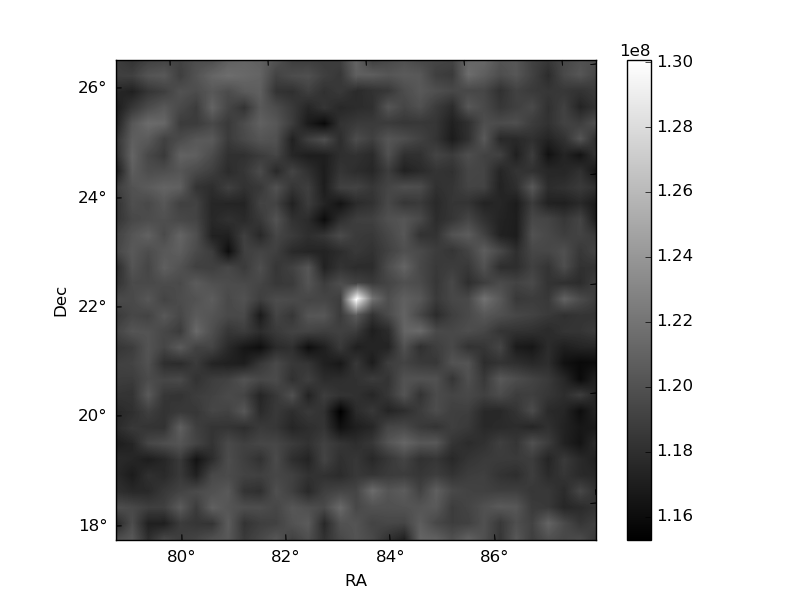
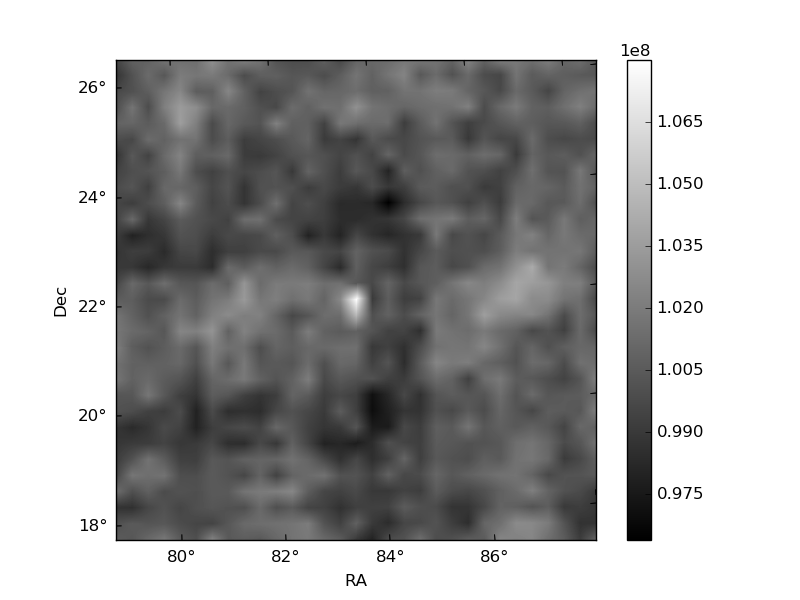
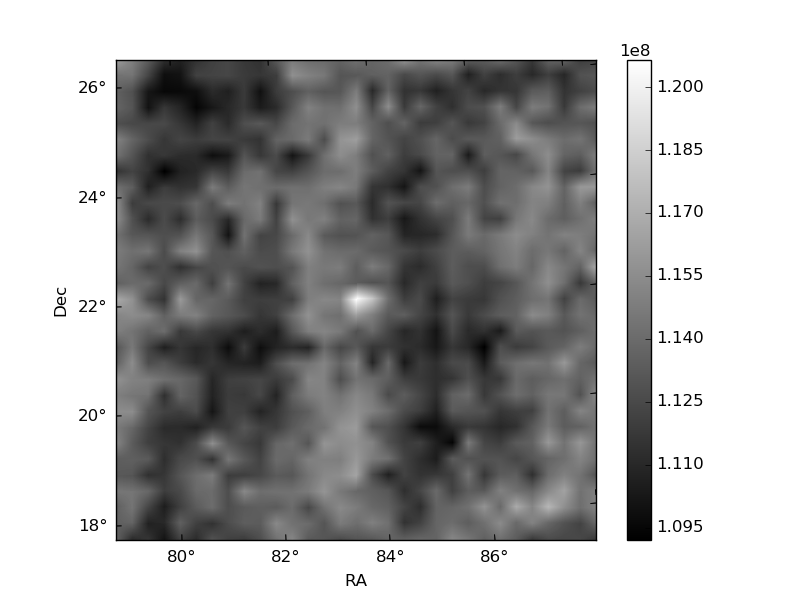
Histogram calculated using DETX and DETY for each event in the final _common_clean file
| Quadrant A |  |
 |
Quadrant B |
|---|---|---|---|
| Quadrant D | 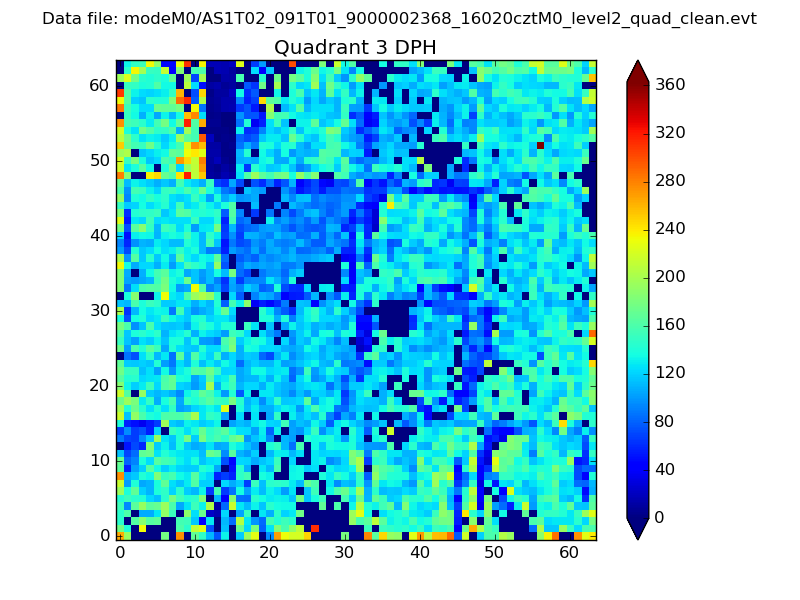 |
 |
Quadrant C |
| Plot type | Count rate plots | Images |
|---|---|---|
| Comparison with Poisson distribution Blue bars denote a histogram of data divided into 1 sec bins. Red curve is a Poisson curve with rate = median count rate of data. |
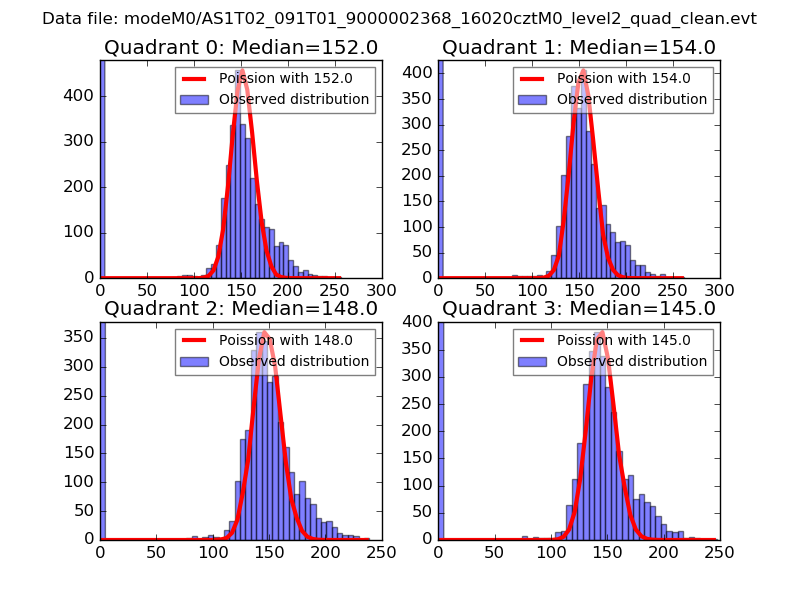 |
 |
| Quadrant-wise count rates Data is divided into 100 sec bins |
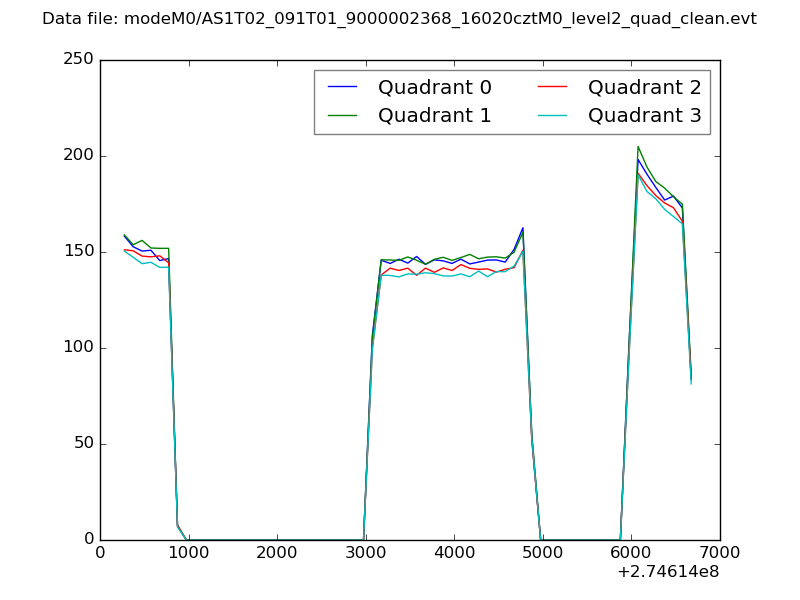 |
|
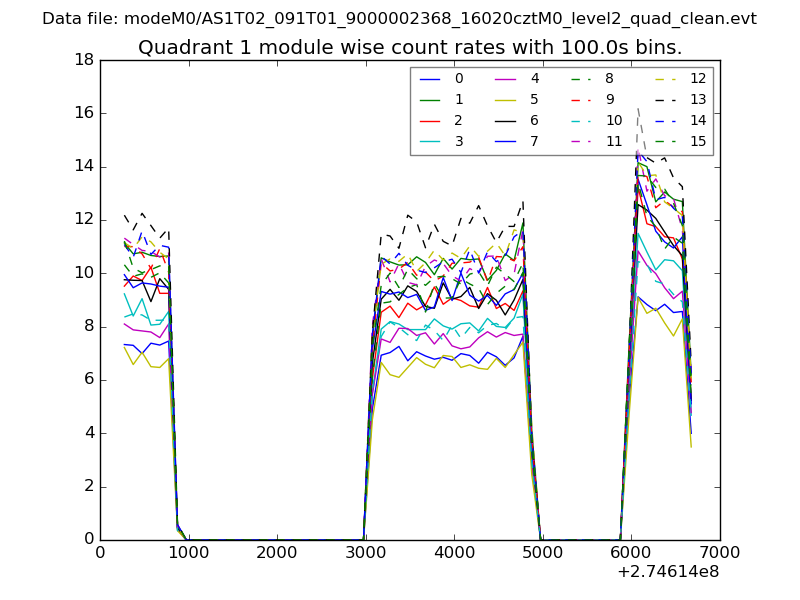
| Module-wise count rates for Quadrant A Data is divided into 100 sec bins |
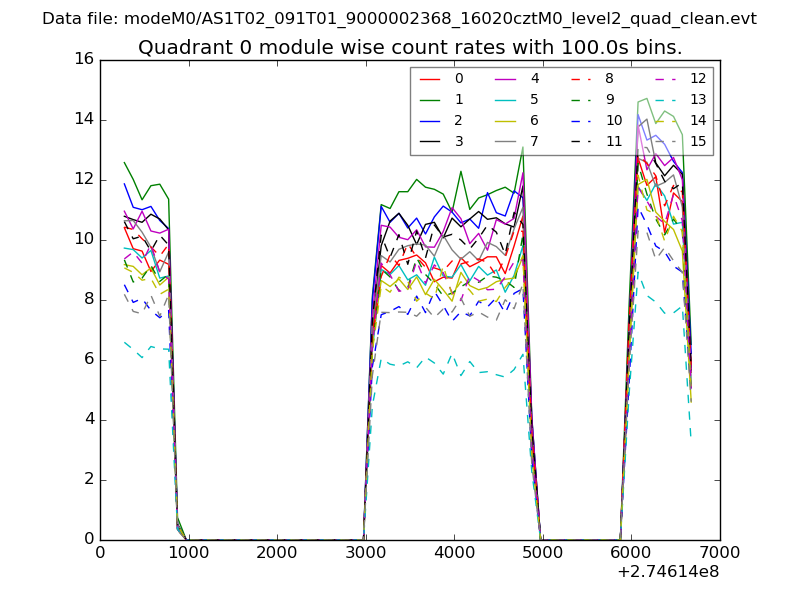 |
 |
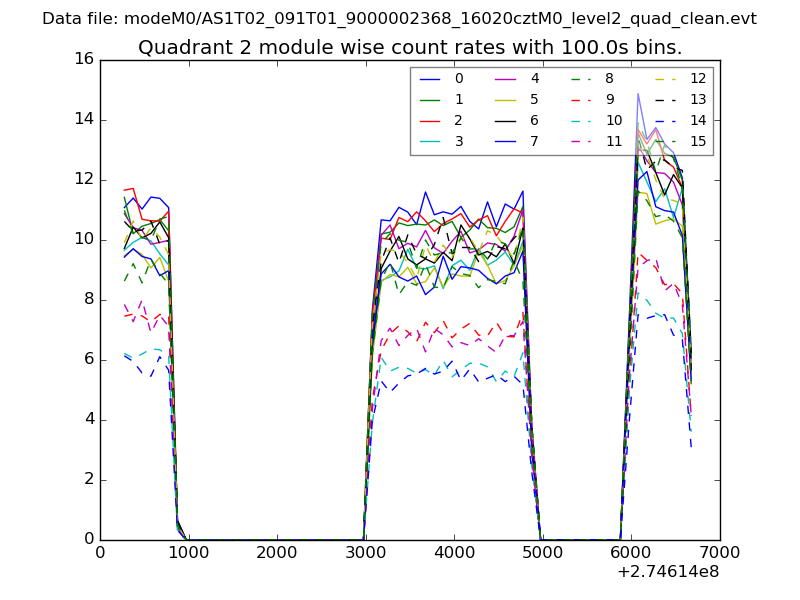
| Module-wise count rates for Quadrant B Data is divided into 100 sec bins |
 |
 |
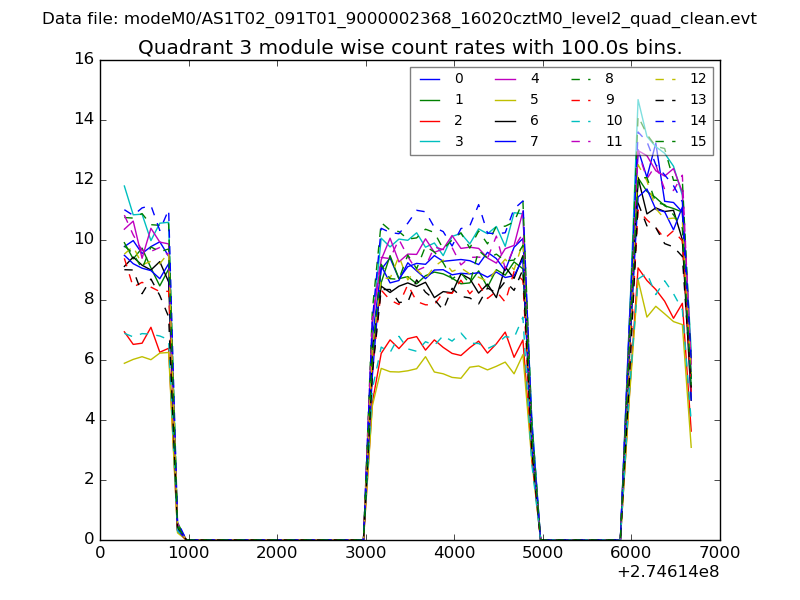
| Module-wise count rates for Quadrant C Data is divided into 100 sec bins |
 |
 |
| Module-wise count rates for Quadrant D Data is divided into 100 sec bins |
 |
 |
| Parameter | Plot |
|---|---|
| CZT HV Monitor | 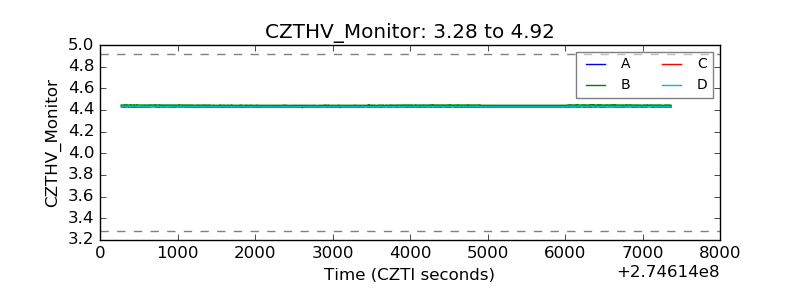 |
| D_VDD | 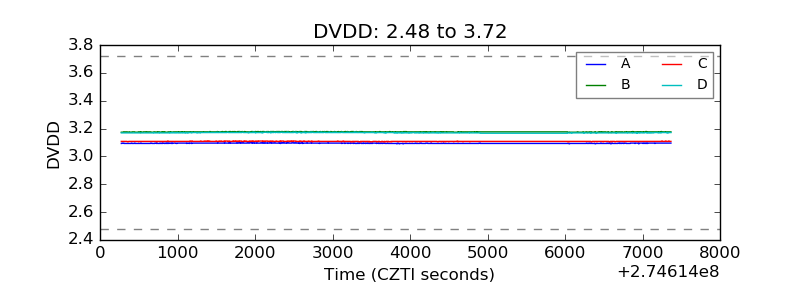 |
| Temperature 1 | 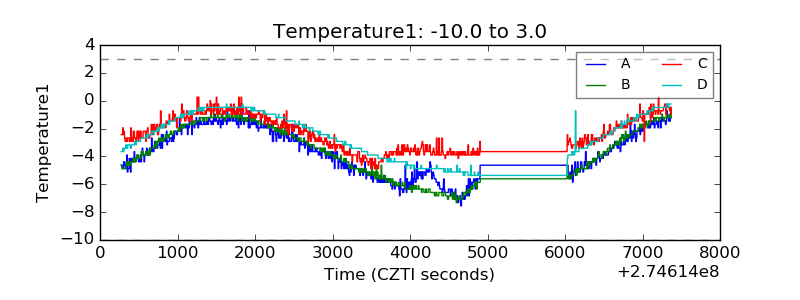 |
| Veto HV Monitor | 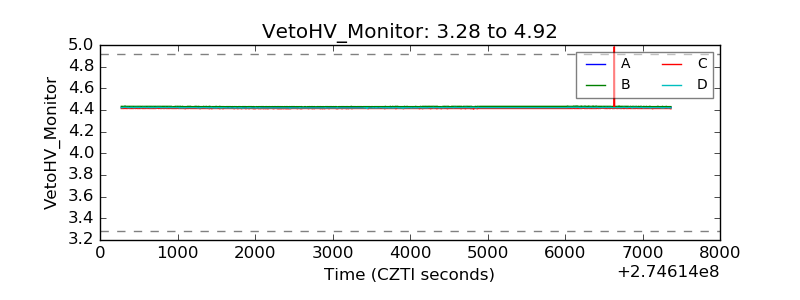 |
| Veto LLD | 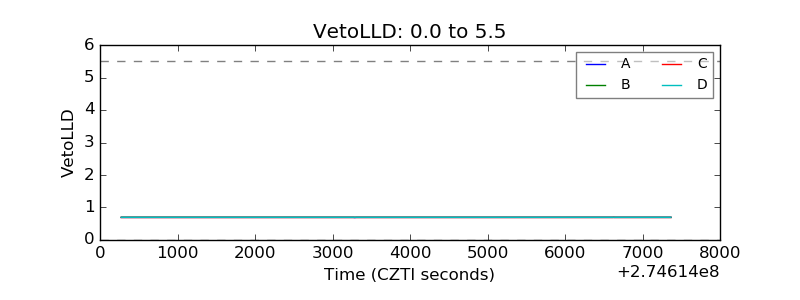 |
| Alpha Counter | 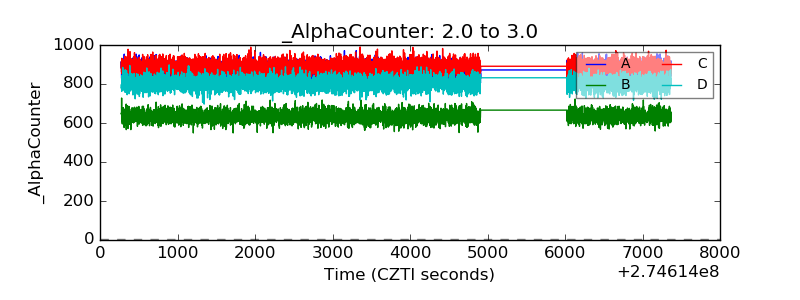 |
| _CPM_Rate | 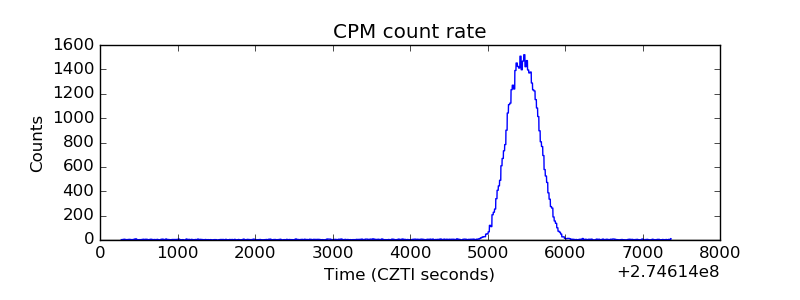 |
| CZT Counter | 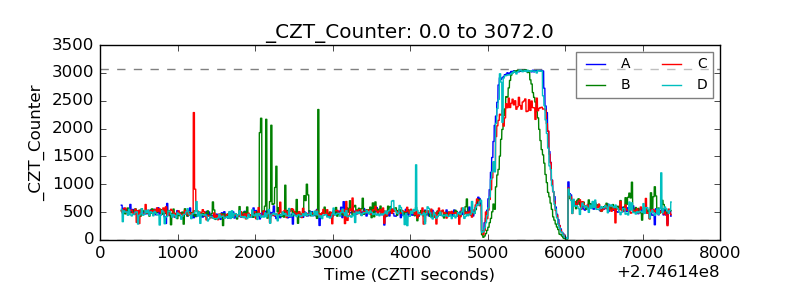 |
| +2.5 Volts monitor |  |
| +5 Volts monitor |  |
| _ROLL_ROT | 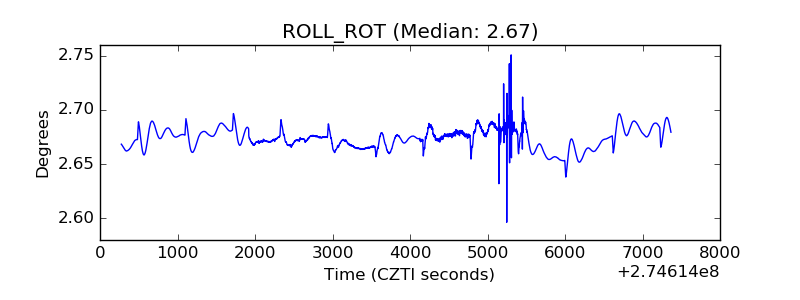 |
| _Roll_DEC | 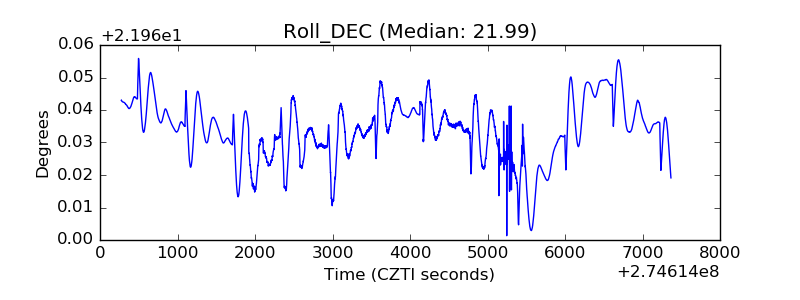 |
| _Roll_RA | 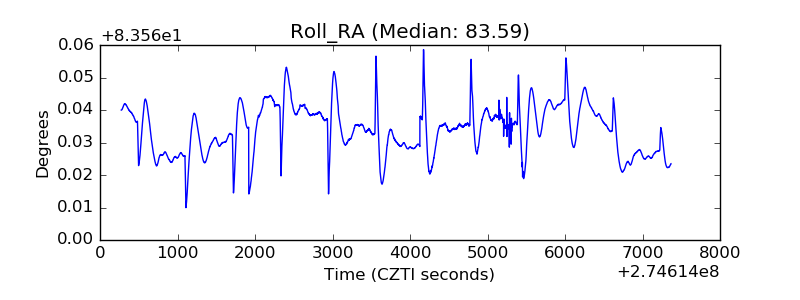 |
| Veto Counter | 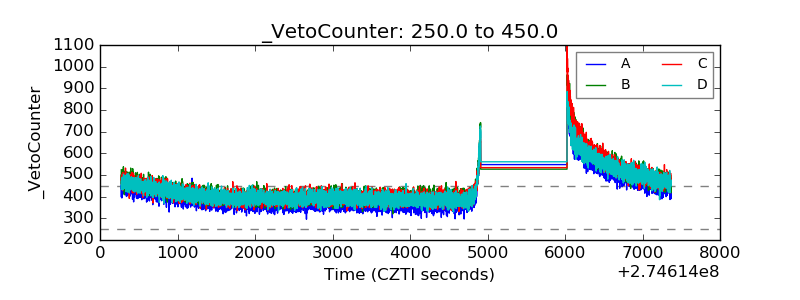 |