| Param | Original file | Final file |
|---|---|---|
| Filename | modeM0/AS1T02_091T01_9000002368_16022cztM0_level2.evt | modeM0/AS1T02_091T01_9000002368_16022cztM0_level2_quad_clean.evt |
| Size (bytes) | 468,403,200 | 66,340,800 |
| Size | 446.7 MB | 63.3 MB |
| Events in quadrant A | 3,391,648 | 402,244 |
| Events in quadrant B | 3,664,054 | 402,613 |
| Events in quadrant C | 3,437,584 | 389,409 |
| Events in quadrant D | 3,273,623 | 383,564 |
| Mode SS | |||
|---|---|---|---|
| Quadrant | BADHDUFLAG | Total packets | Discarded packets |
| A | 0 | 126 | 0 |
| B | 0 | 126 | 0 |
| C | 0 | 126 | 0 |
| D | 0 | 126 | 0 |
| Mode M9 | |||
|---|---|---|---|
| Quadrant | BADHDUFLAG | Total packets | Discarded packets |
| A | 0 | 13 | 0 |
| B | 0 | 13 | 0 |
| C | 0 | 13 | 0 |
| D | 0 | 13 | 0 |
| Mode M0 | |||
|---|---|---|---|
| Quadrant | BADHDUFLAG | Total packets | Discarded packets |
| A | 0 | 13859 | 2 |
| B | 0 | 14744 | 1 |
| C | 0 | 13950 | 1 |
| D | 0 | 13511 | 1 |
| Quadrant | Total seconds | Saturated seconds | Saturation percentage |
|---|---|---|---|
| A | 6167 | 101 | 1.637749% |
| B | 6167 | 146 | 2.367440% |
| C | 6167 | 114 | 1.848549% |
| D | 6167 | 81 | 1.313443% |
Noise dominated data is calculated using 1-second bins in cleaned event files. If a bin has >2000 counts, and if more than 50% of those come from <1% of pixels, then it is considered to be noise-dominated and hence unusable.
| Quadrant | # 1 sec bins | Bins with >0 counts | Bins with >2000 counts | High rate bins dominated by noise | Noise dominated (total time) | Noise dominated (detector-on time) | Marked lightcurve |
|---|---|---|---|---|---|---|---|
| A | 7448 | 6168 | 3 | 3 | 0.04% | 0.05% | 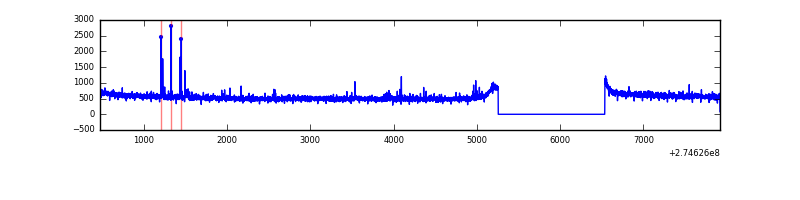 |
| B | 7448 | 6168 | 45 | 45 | 0.60% | 0.73% | 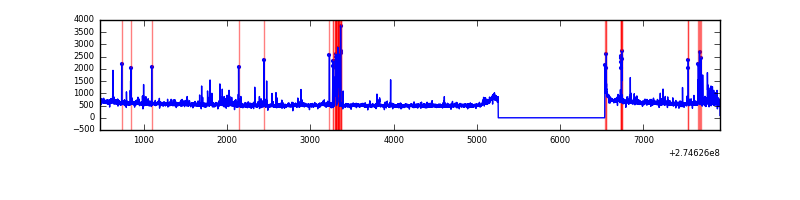 |
| C | 7448 | 6168 | 0 | 0 | 0.00% | 0.00% | 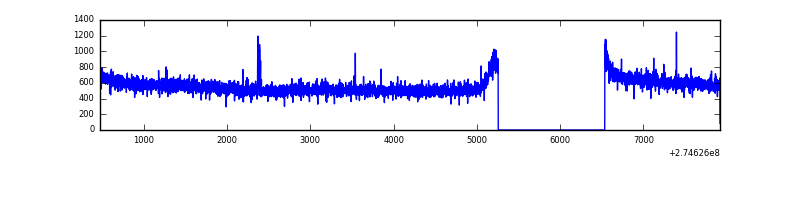 |
| D | 7448 | 6168 | 0 | 0 | 0.00% | 0.00% | 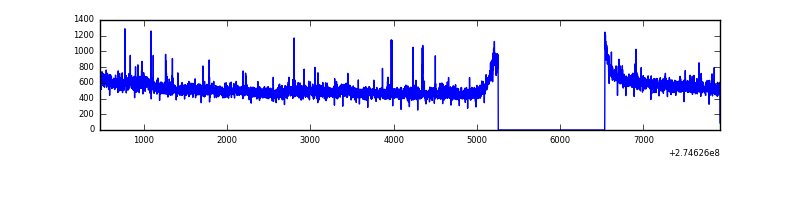 |
Top three noisy pixels from each quadrant. If the there are fewer than three noisy pixels in the level2.evt file, extra rows are filled as -1
| Pixel properties | Quadrant properties | ||||||
|---|---|---|---|---|---|---|---|
| Quadrant | DetID | PixID | Counts | Sigma | Mean | Median | Sigma |
| A | 12 | 96 | 32631 | 182.88 | 869 | 856 | 173.7 |
| A | 3 | 80 | 8747 | 45.42 | 869 | 856 | 173.7 |
| A | 15 | 239 | 7905 | 40.57 | 869 | 856 | 173.7 |
| B | 5 | 172 | 99928 | 624.12 | 856 | 841 | 158.8 |
| B | 7 | 220 | 79434 | 495.04 | 856 | 841 | 158.8 |
| B | 4 | 173 | 30382 | 186.07 | 856 | 841 | 158.8 |
| C | 14 | 238 | 130519 | 673.4 | 831 | 840 | 192.6 |
| C | 3 | 233 | 50897 | 259.94 | 831 | 840 | 192.6 |
| C | 10 | 22 | 15332 | 75.25 | 831 | 840 | 192.6 |
| D | 2 | 152 | 37892 | 180.26 | 850 | 829 | 205.6 |
| D | 2 | 234 | 28394 | 134.06 | 850 | 829 | 205.6 |
| D | 2 | 120 | 13499 | 61.62 | 850 | 829 | 205.6 |
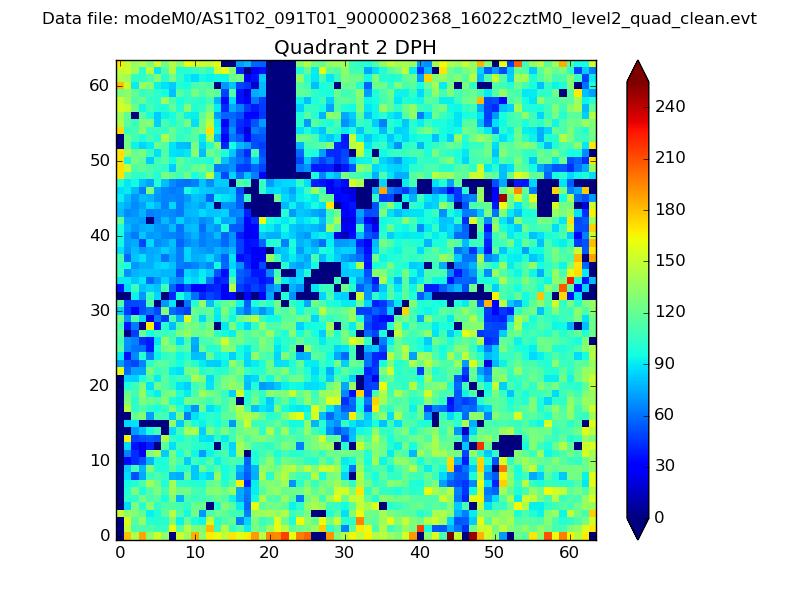
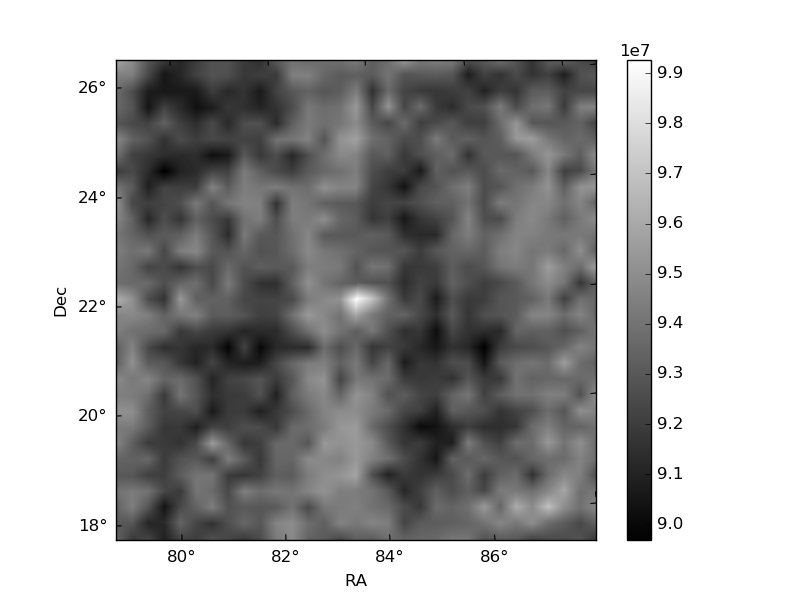
Histogram calculated using DETX and DETY for each event in the final _common_clean file
| Quadrant A | 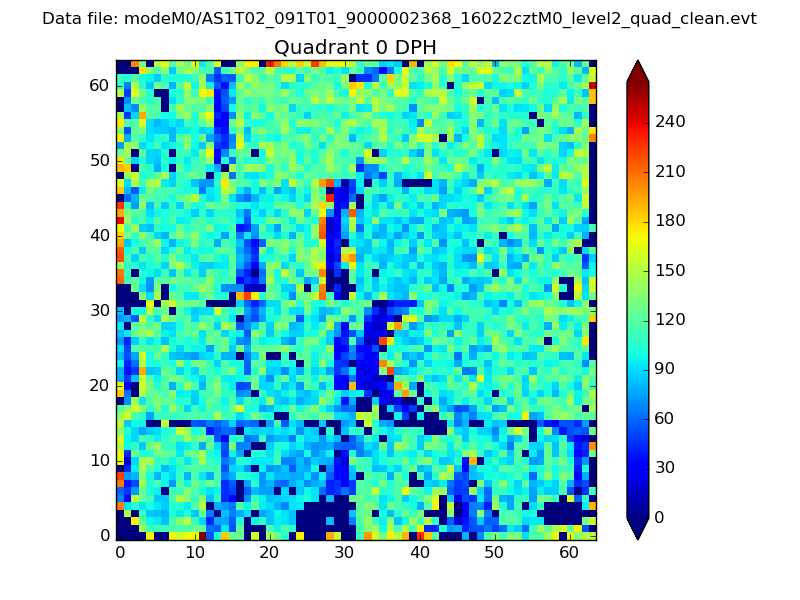 |
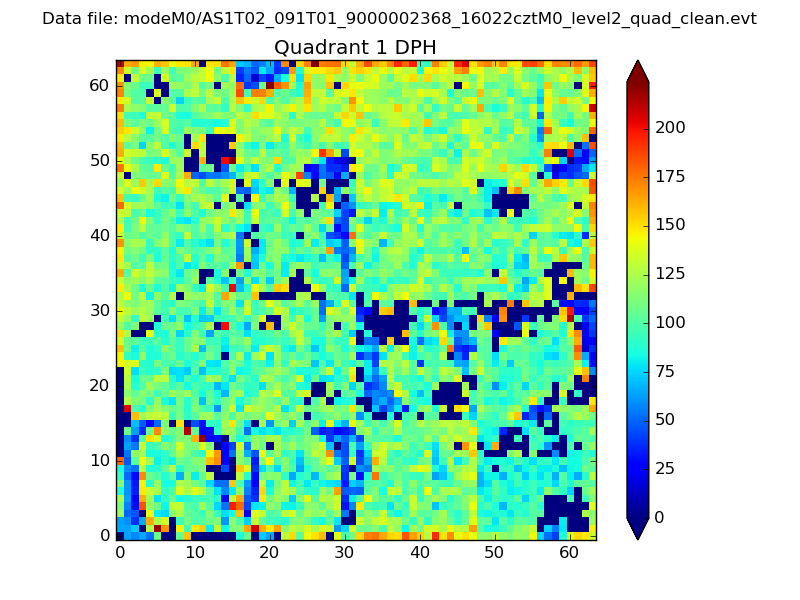 |
Quadrant B |
|---|---|---|---|
| Quadrant D | 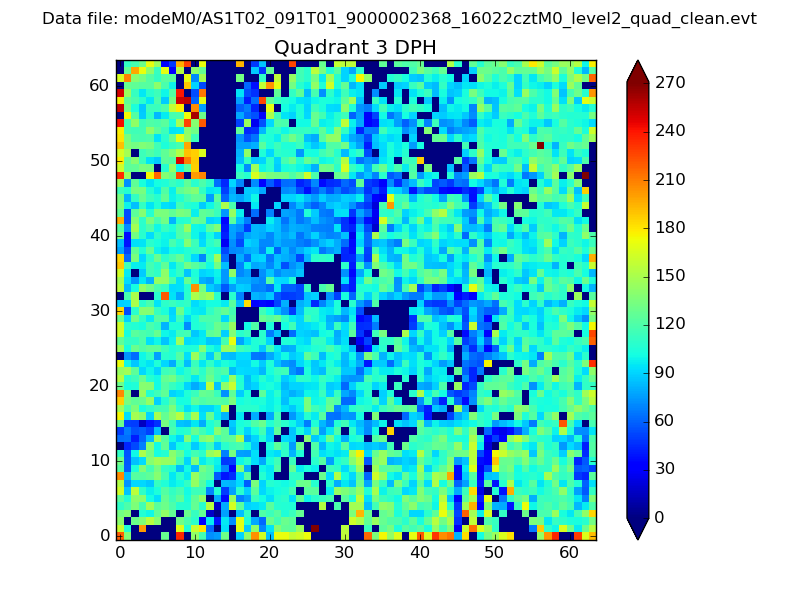 |
 |
Quadrant C |
| Plot type | Count rate plots | Images |
|---|---|---|
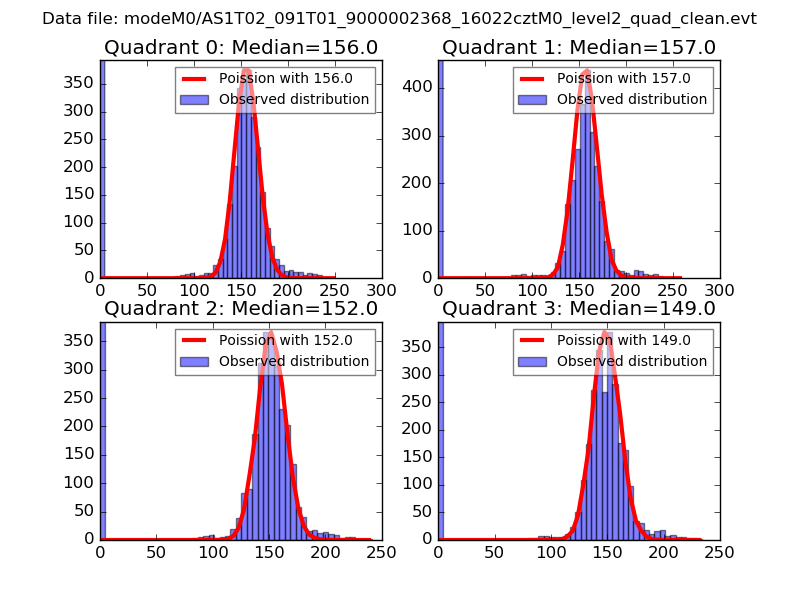
| Comparison with Poisson distribution Blue bars denote a histogram of data divided into 1 sec bins. Red curve is a Poisson curve with rate = median count rate of data. |
 |
 |
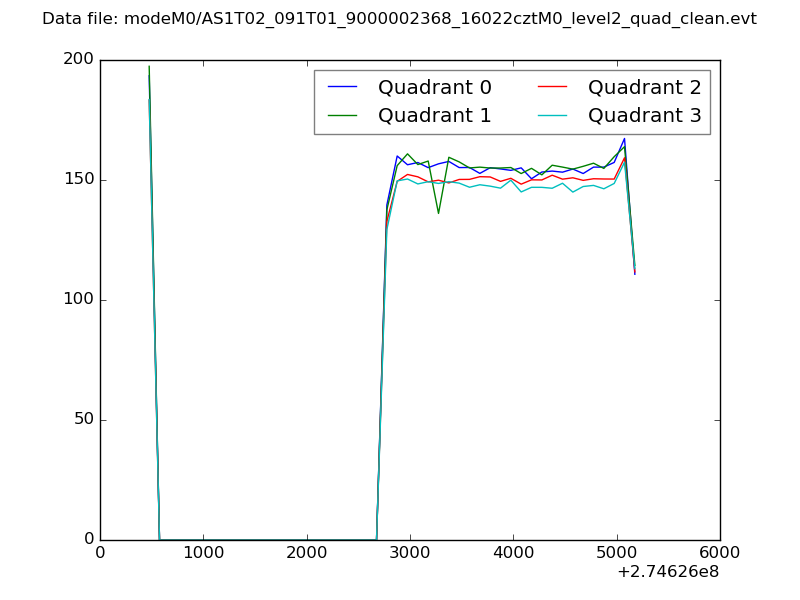
| Quadrant-wise count rates Data is divided into 100 sec bins |
 |
|
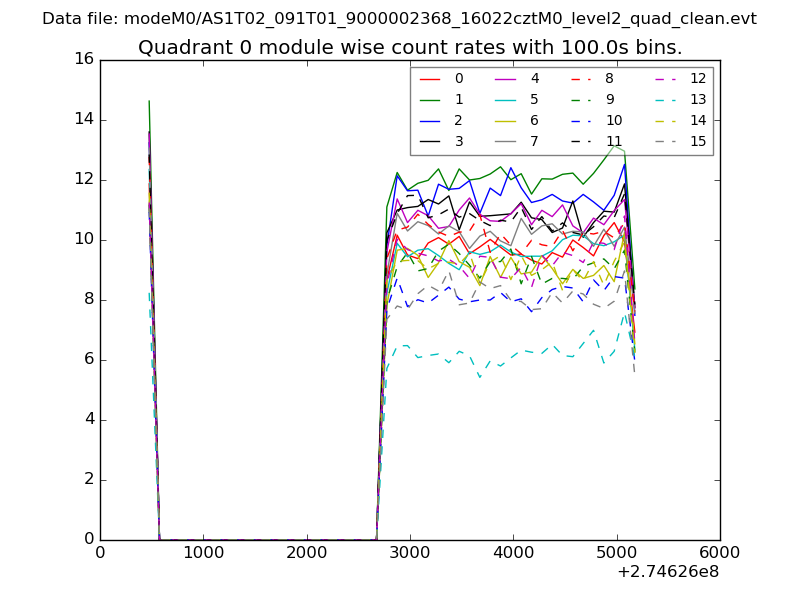
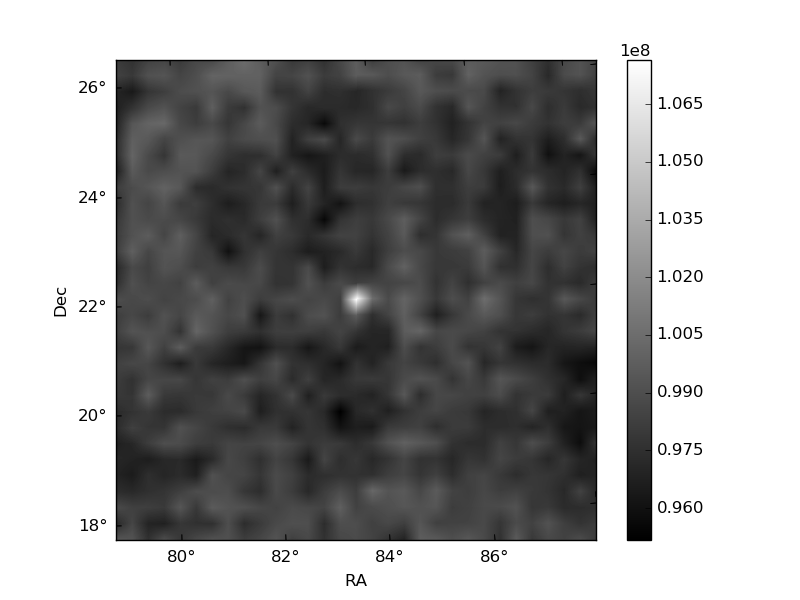
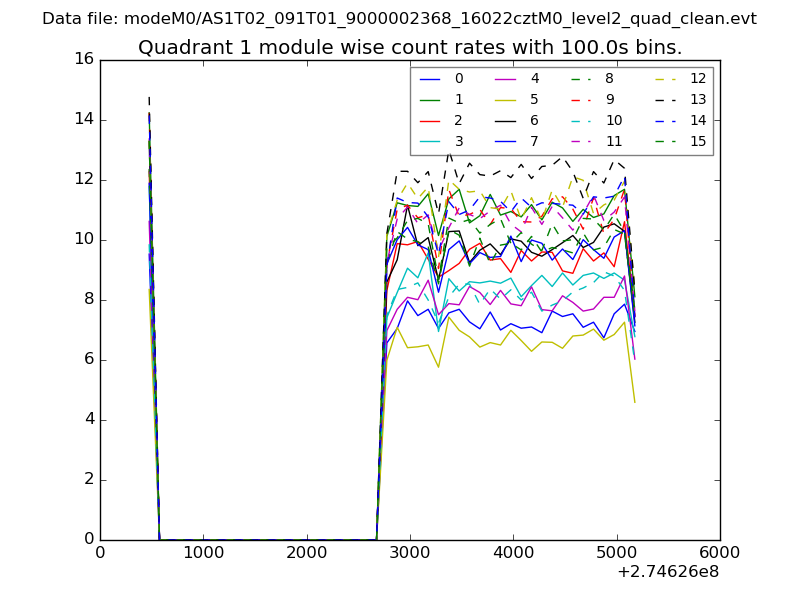
| Module-wise count rates for Quadrant A Data is divided into 100 sec bins |
 |
 |
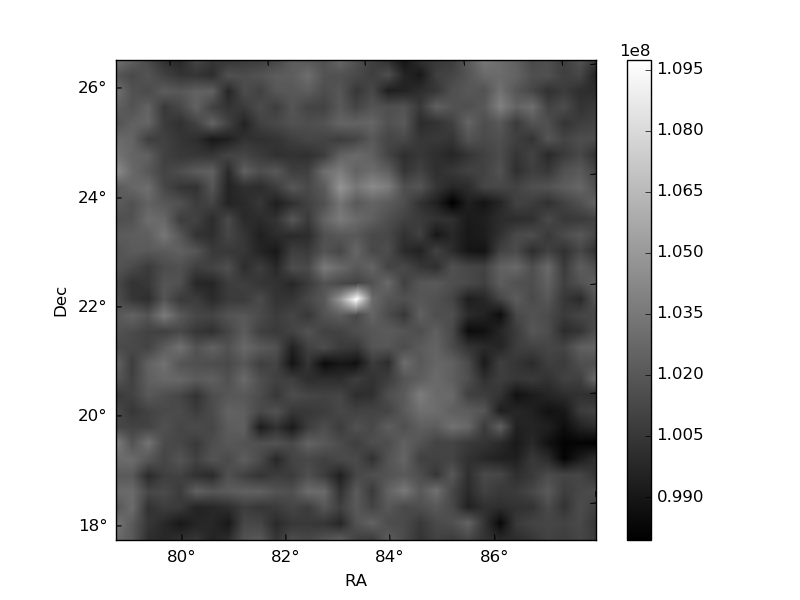
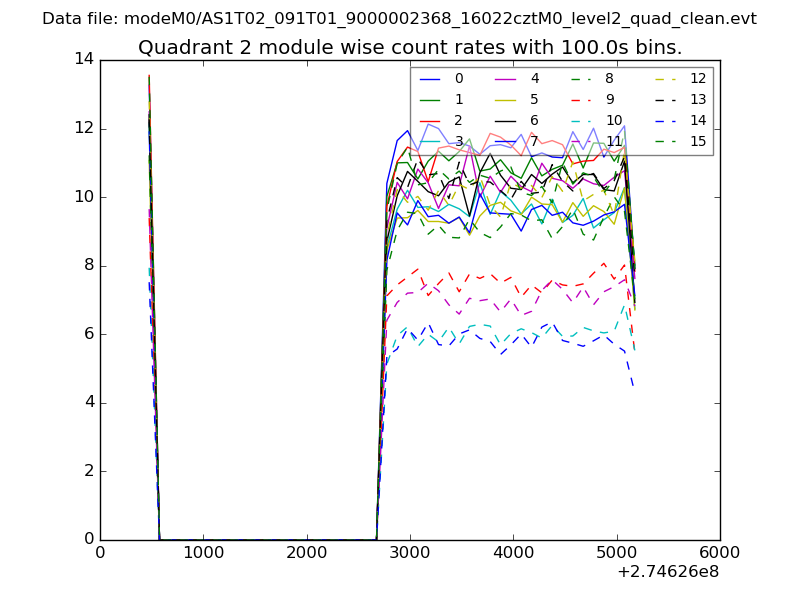
| Module-wise count rates for Quadrant B Data is divided into 100 sec bins |
 |
 |
| Module-wise count rates for Quadrant C Data is divided into 100 sec bins |
 |
 |
| Module-wise count rates for Quadrant D Data is divided into 100 sec bins |
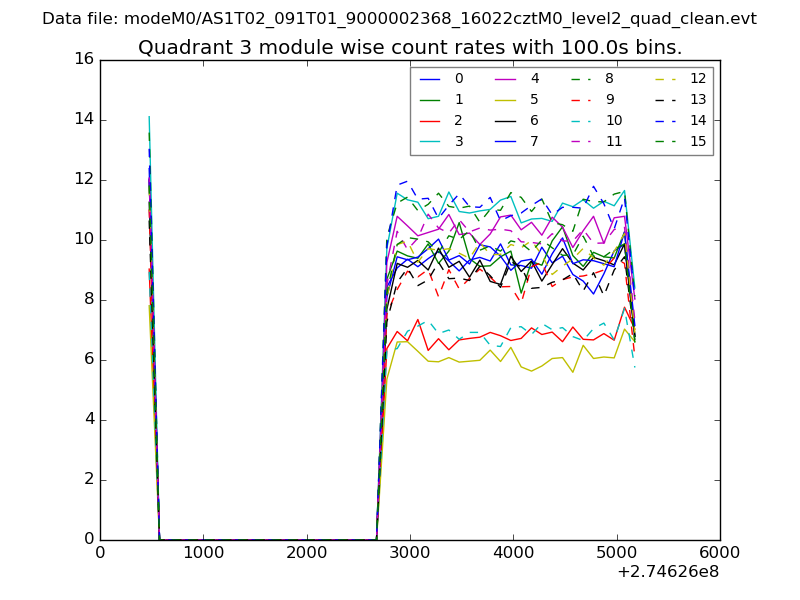 |
 |
| Parameter | Plot |
|---|---|
| CZT HV Monitor | 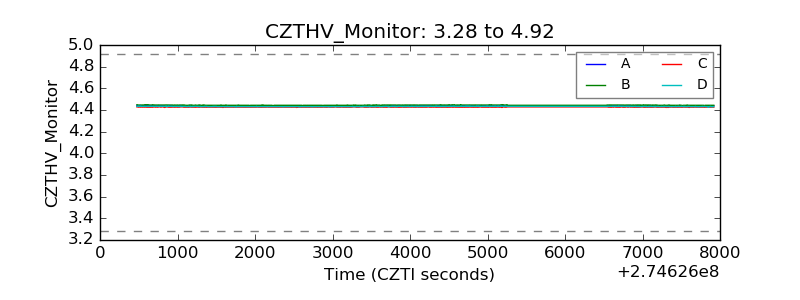 |
| D_VDD | 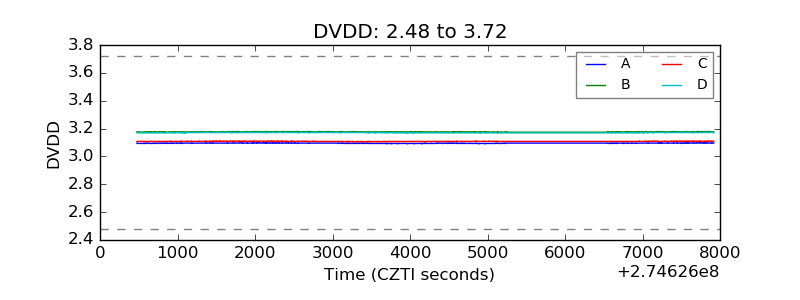 |
| Temperature 1 | 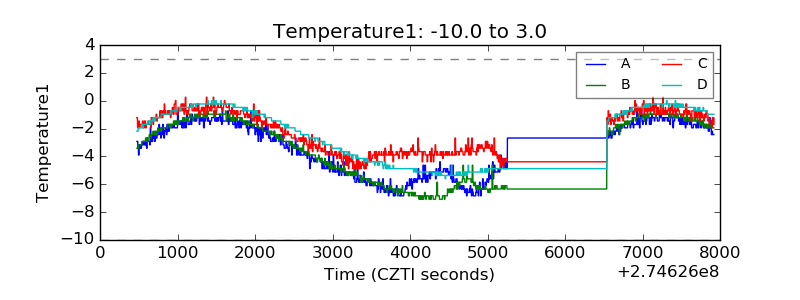 |
| Veto HV Monitor | 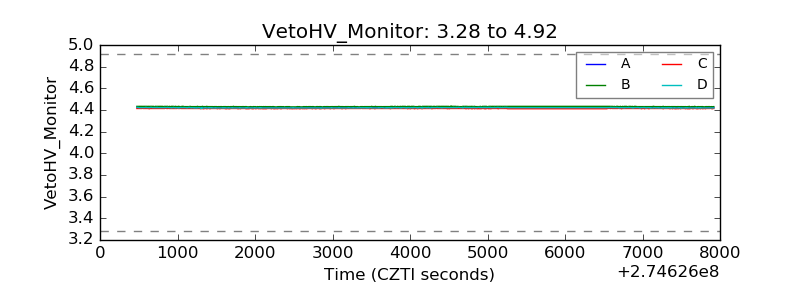 |
| Veto LLD | 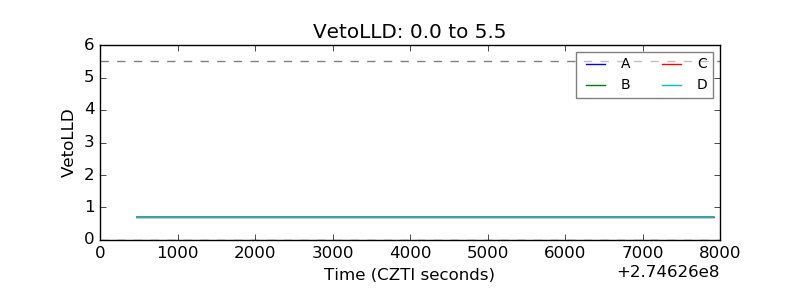 |
| Alpha Counter | 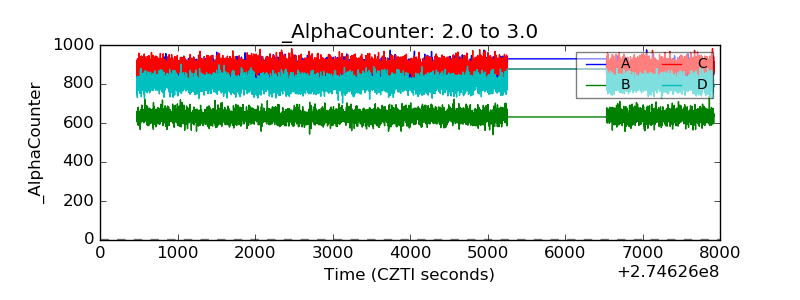 |
| _CPM_Rate | 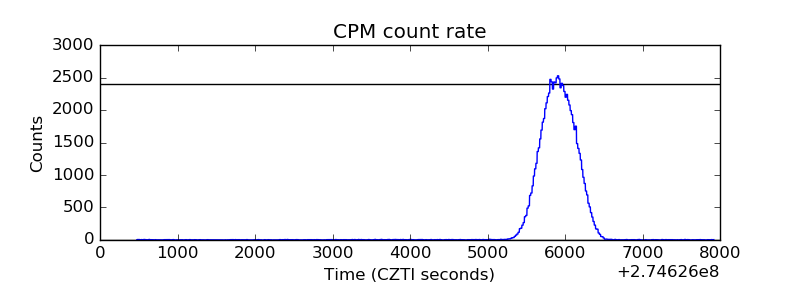 |
| CZT Counter | 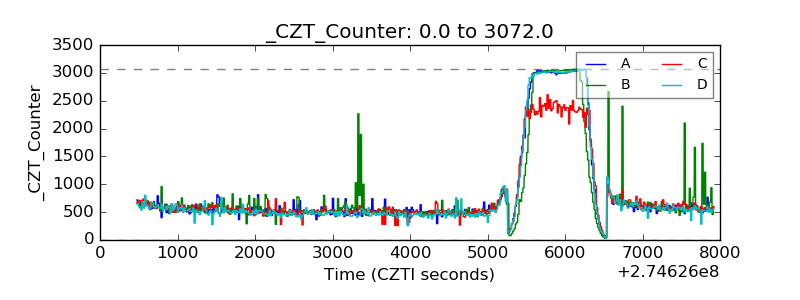 |
| +2.5 Volts monitor |  |
| +5 Volts monitor |  |
| _ROLL_ROT | 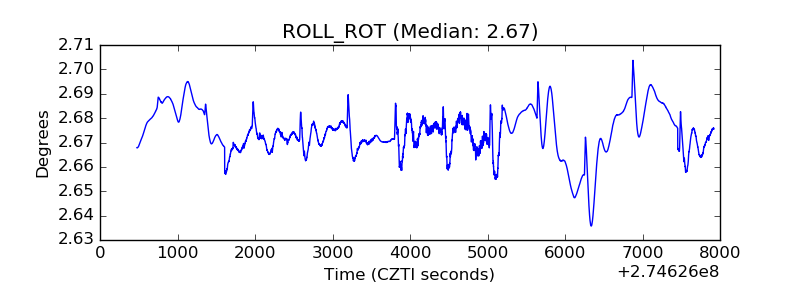 |
| _Roll_DEC | 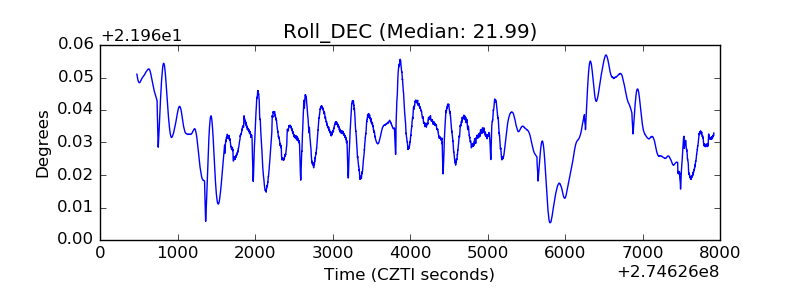 |
| _Roll_RA |  |
| Veto Counter | 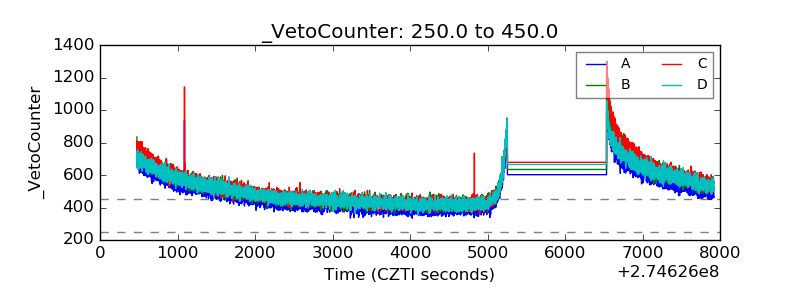 |