| Param | Original file | Final file |
|---|---|---|
| Filename | modeM0/AS1T02_091T01_9000002368_16023cztM0_level2.evt | modeM0/AS1T02_091T01_9000002368_16023cztM0_level2_quad_clean.evt |
| Size (bytes) | 478,958,400 | 72,308,160 |
| Size | 456.8 MB | 69.0 MB |
| Events in quadrant A | 3,423,340 | 447,625 |
| Events in quadrant B | 3,741,839 | 449,278 |
| Events in quadrant C | 3,537,520 | 433,926 |
| Events in quadrant D | 3,383,631 | 427,566 |
| Mode SS | |||
|---|---|---|---|
| Quadrant | BADHDUFLAG | Total packets | Discarded packets |
| A | 0 | 124 | 0 |
| B | 0 | 124 | 0 |
| C | 0 | 124 | 0 |
| D | 0 | 124 | 0 |
| Mode M9 | |||
|---|---|---|---|
| Quadrant | BADHDUFLAG | Total packets | Discarded packets |
| A | 0 | 17 | 0 |
| B | 0 | 17 | 0 |
| C | 0 | 17 | 0 |
| D | 0 | 18 | 0 |
| Mode M0 | |||
|---|---|---|---|
| Quadrant | BADHDUFLAG | Total packets | Discarded packets |
| A | 0 | 13999 | 3 |
| B | 0 | 15071 | 2 |
| C | 0 | 14373 | 2 |
| D | 0 | 13952 | 2 |
| Quadrant | Total seconds | Saturated seconds | Saturation percentage |
|---|---|---|---|
| A | 6178 | 101 | 1.634833% |
| B | 6178 | 166 | 2.686954% |
| C | 6178 | 148 | 2.395597% |
| D | 6178 | 86 | 1.392036% |
Noise dominated data is calculated using 1-second bins in cleaned event files. If a bin has >2000 counts, and if more than 50% of those come from <1% of pixels, then it is considered to be noise-dominated and hence unusable.
| Quadrant | # 1 sec bins | Bins with >0 counts | Bins with >2000 counts | High rate bins dominated by noise | Noise dominated (total time) | Noise dominated (detector-on time) | Marked lightcurve |
|---|---|---|---|---|---|---|---|
| A | 7524 | 6179 | 6 | 6 | 0.08% | 0.10% | 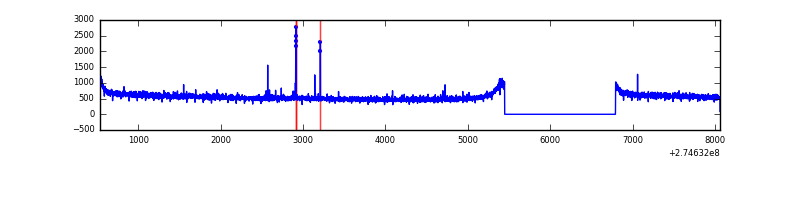 |
| B | 7524 | 6179 | 36 | 36 | 0.48% | 0.58% | 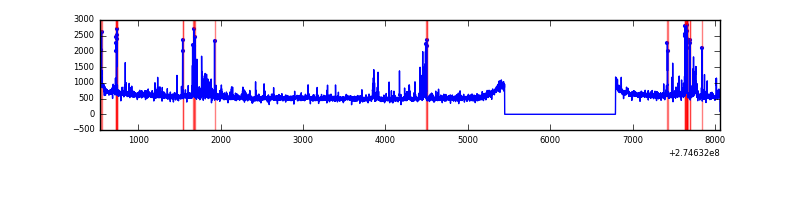 |
| C | 7524 | 6179 | 5 | 5 | 0.07% | 0.08% |  |
| D | 7524 | 6179 | 9 | 9 | 0.12% | 0.15% | 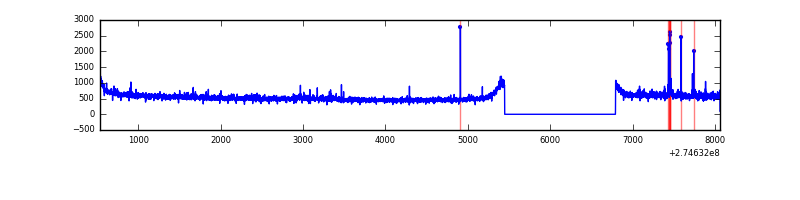 |
Top three noisy pixels from each quadrant. If the there are fewer than three noisy pixels in the level2.evt file, extra rows are filled as -1
| Pixel properties | Quadrant properties | ||||||
|---|---|---|---|---|---|---|---|
| Quadrant | DetID | PixID | Counts | Sigma | Mean | Median | Sigma |
| A | 15 | 69 | 15175 | 80.8 | 884 | 868 | 177.1 |
| A | 12 | 96 | 8135 | 41.04 | 884 | 868 | 177.1 |
| A | 0 | 226 | 7910 | 39.77 | 884 | 868 | 177.1 |
| B | 7 | 220 | 138296 | 841.59 | 876 | 859 | 163.3 |
| B | 4 | 173 | 83465 | 505.84 | 876 | 859 | 163.3 |
| B | 0 | 245 | 26106 | 154.6 | 876 | 859 | 163.3 |
| C | 14 | 238 | 134893 | 683.76 | 852 | 861 | 196.0 |
| C | 3 | 233 | 74051 | 373.38 | 852 | 861 | 196.0 |
| C | 10 | 22 | 7259 | 32.64 | 852 | 861 | 196.0 |
| D | 2 | 152 | 39720 | 184.95 | 869 | 848 | 210.2 |
| D | 12 | 233 | 28819 | 133.09 | 869 | 848 | 210.2 |
| D | 2 | 234 | 25245 | 116.08 | 869 | 848 | 210.2 |
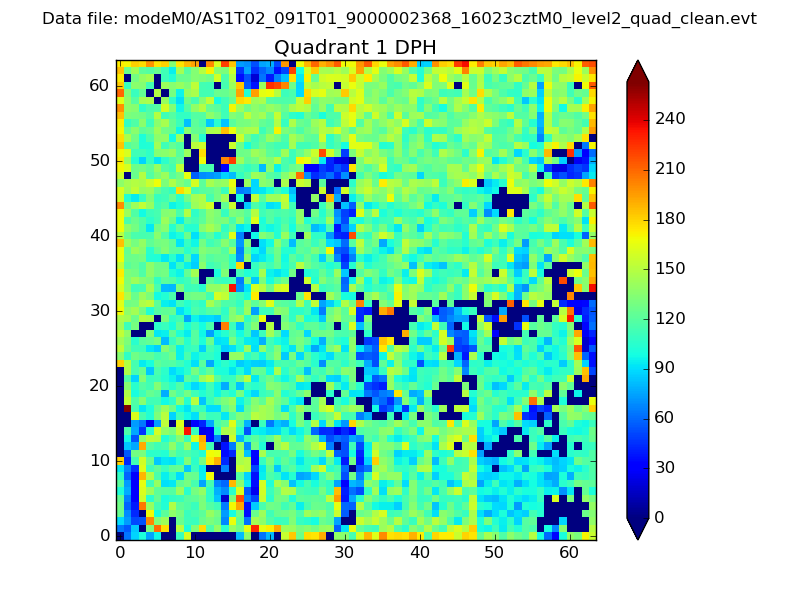
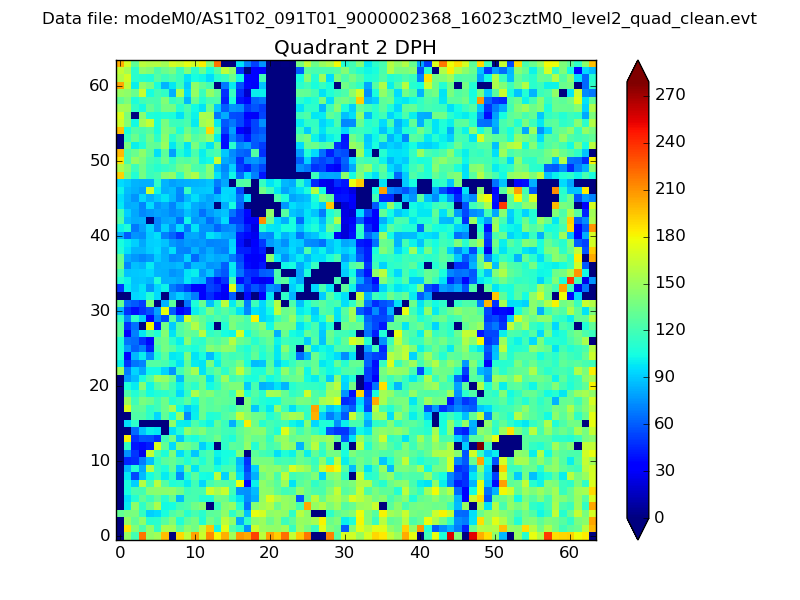
Histogram calculated using DETX and DETY for each event in the final _common_clean file
| Quadrant A | 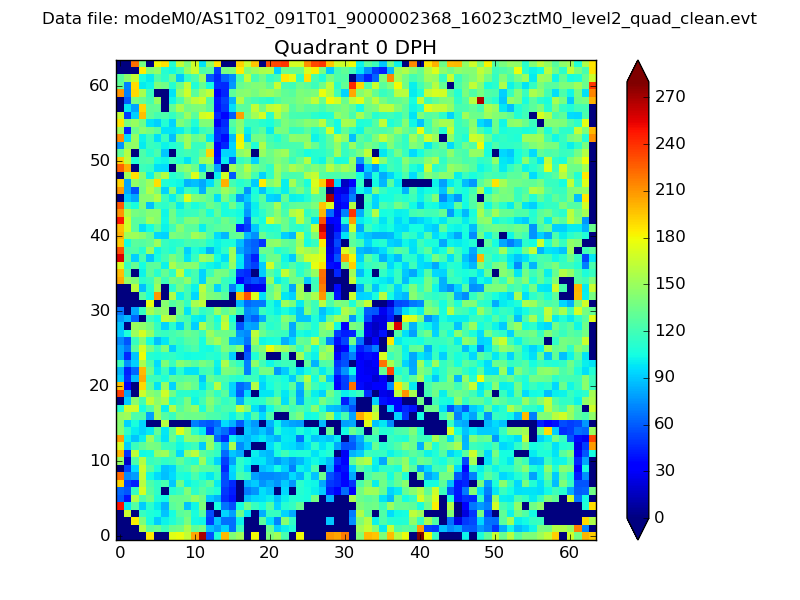 |
 |
Quadrant B |
|---|---|---|---|
| Quadrant D | 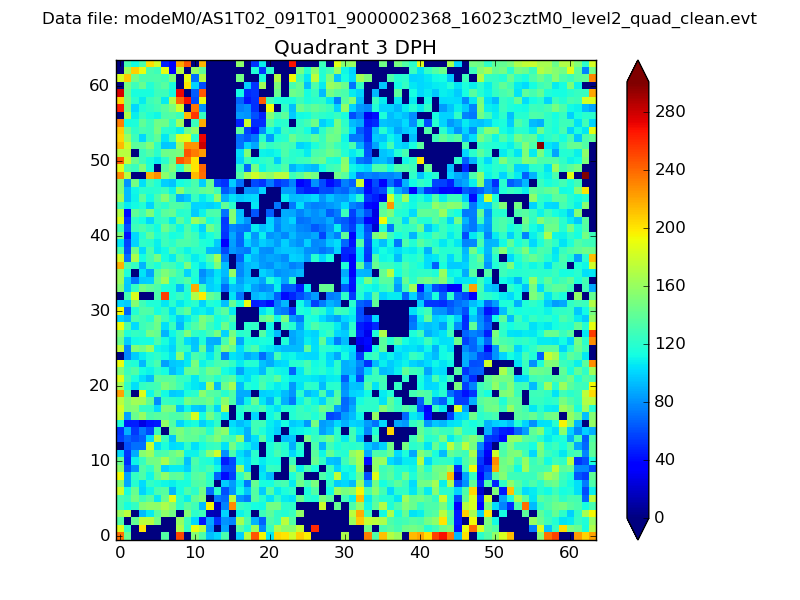 |
 |
Quadrant C |
| Plot type | Count rate plots | Images |
|---|---|---|
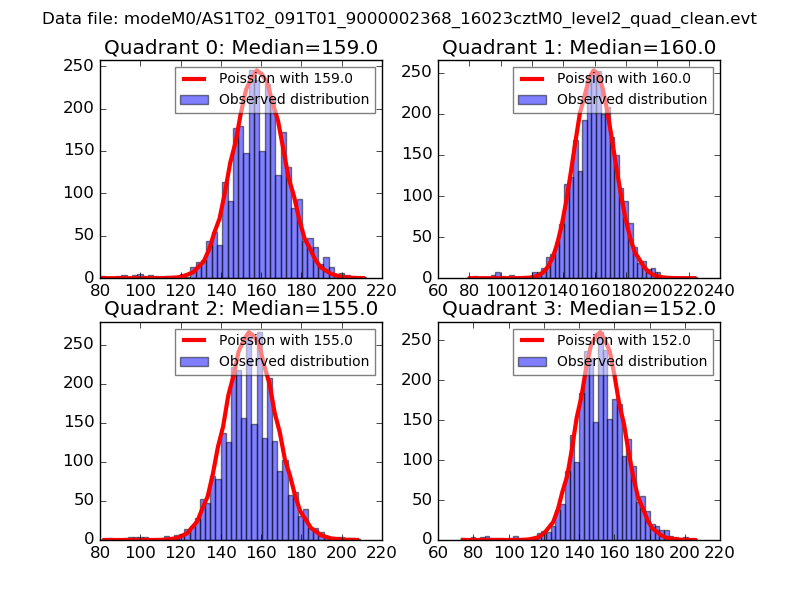
| Comparison with Poisson distribution Blue bars denote a histogram of data divided into 1 sec bins. Red curve is a Poisson curve with rate = median count rate of data. |
 |
 |
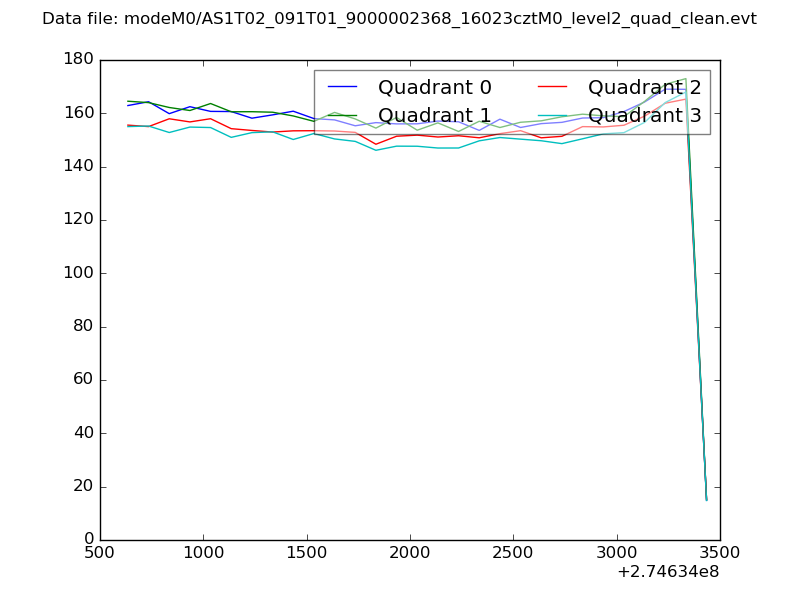
| Quadrant-wise count rates Data is divided into 100 sec bins |
 |
|
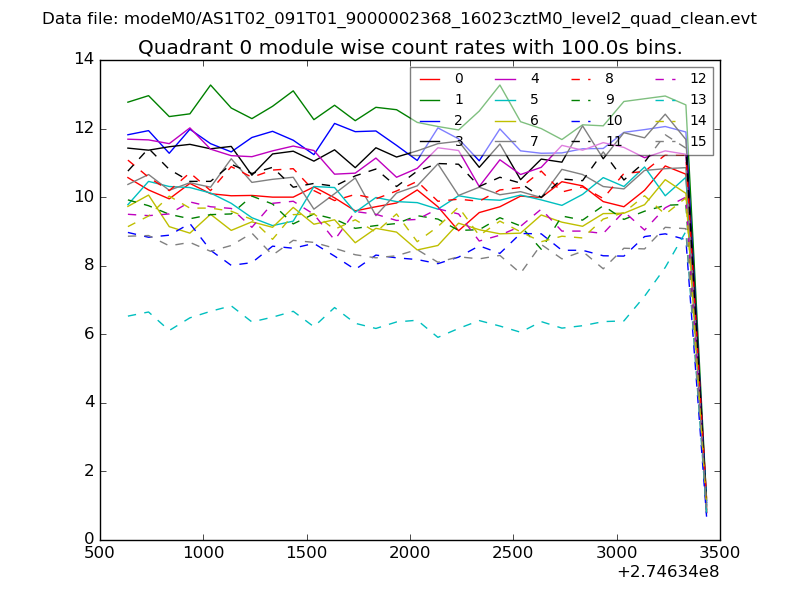
| Module-wise count rates for Quadrant A Data is divided into 100 sec bins |
 |
 |
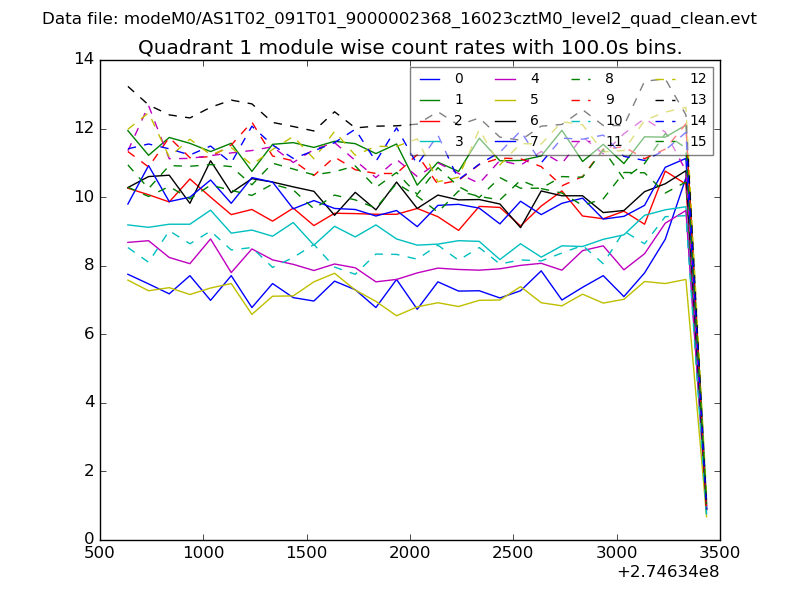
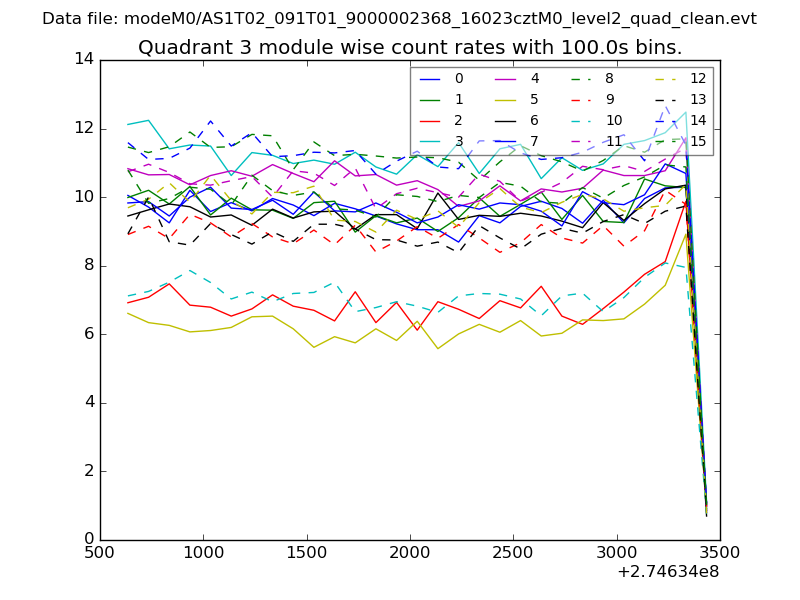
| Module-wise count rates for Quadrant B Data is divided into 100 sec bins |
 |
 |
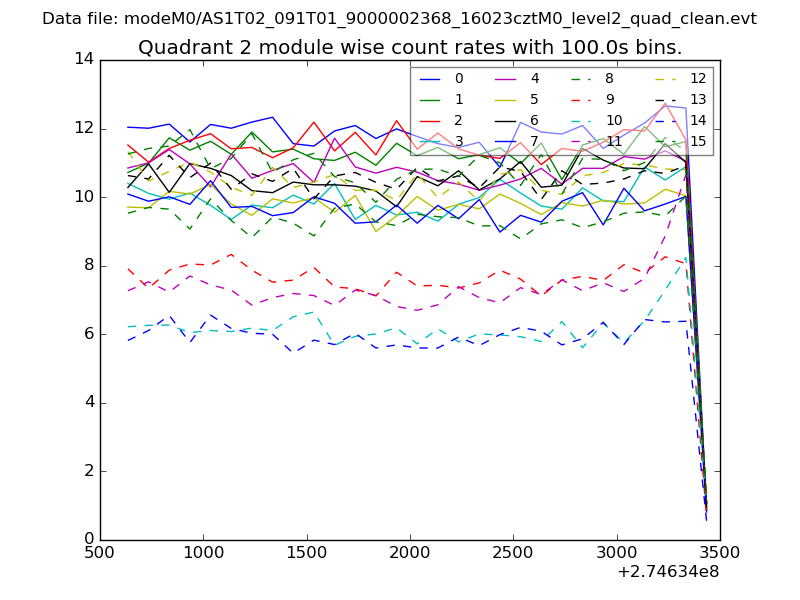
| Module-wise count rates for Quadrant C Data is divided into 100 sec bins |
 |
 |
| Module-wise count rates for Quadrant D Data is divided into 100 sec bins |
 |
 |
| Parameter | Plot |
|---|---|
| CZT HV Monitor | 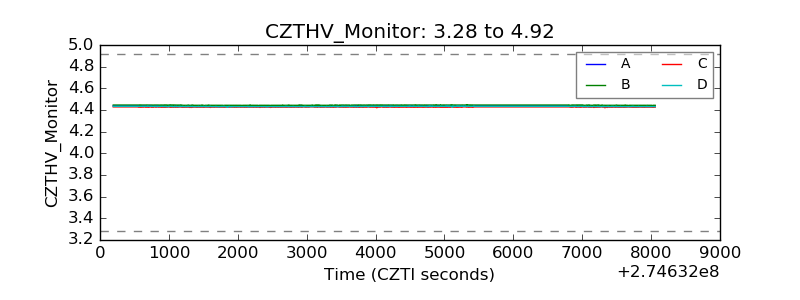 |
| D_VDD | 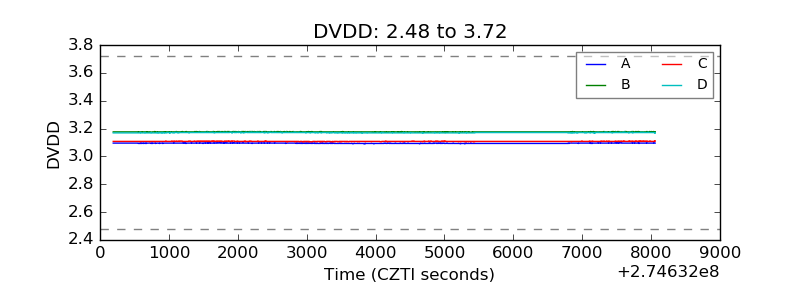 |
| Temperature 1 | 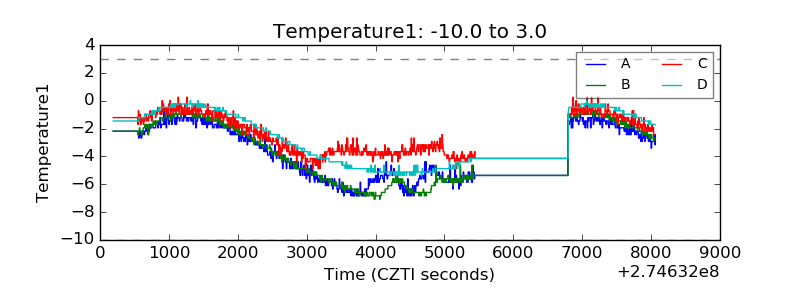 |
| Veto HV Monitor | 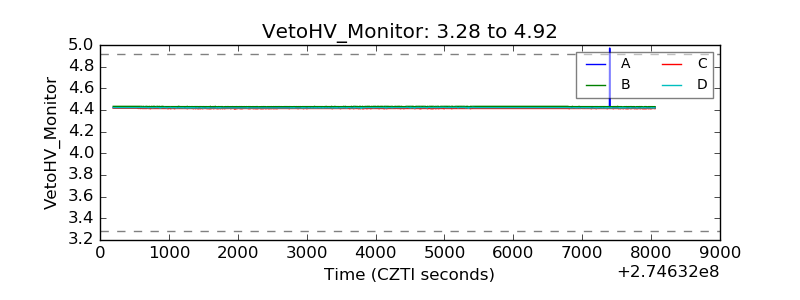 |
| Veto LLD | 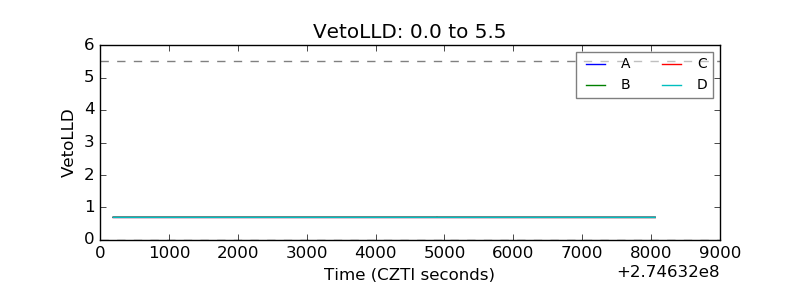 |
| Alpha Counter | 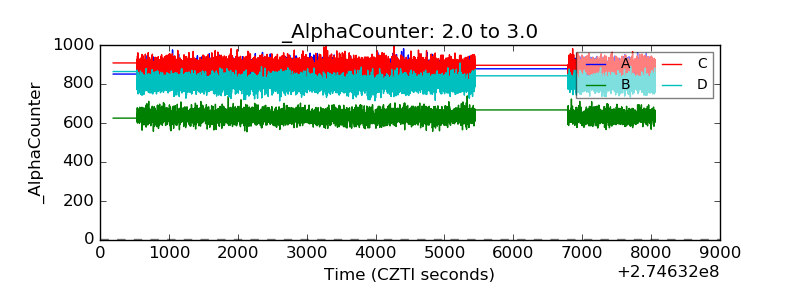 |
| _CPM_Rate | 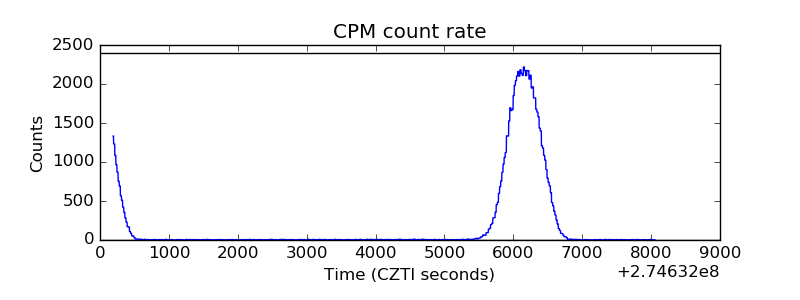 |
| CZT Counter |  |
| +2.5 Volts monitor |  |
| +5 Volts monitor |  |
| _ROLL_ROT | 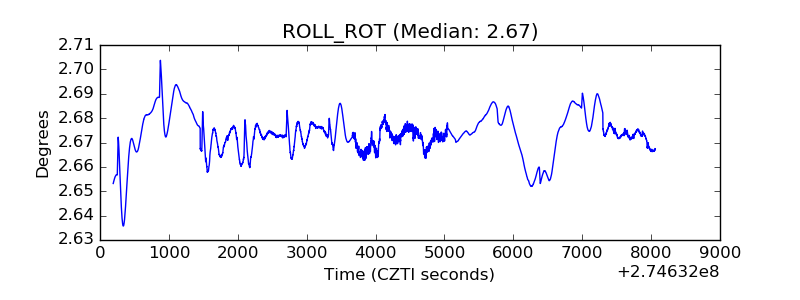 |
| _Roll_DEC | 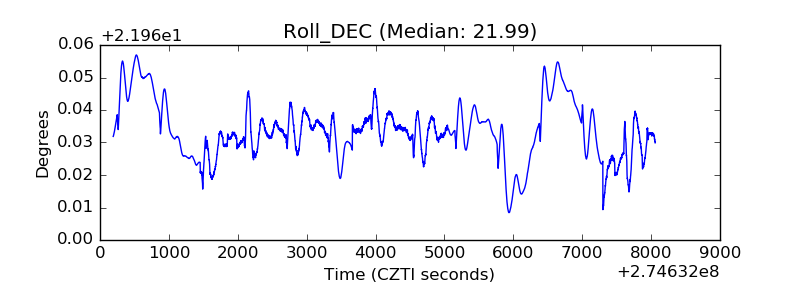 |
| _Roll_RA | 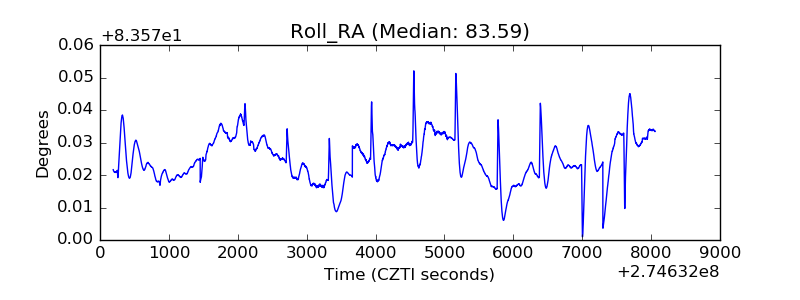 |
| Veto Counter | 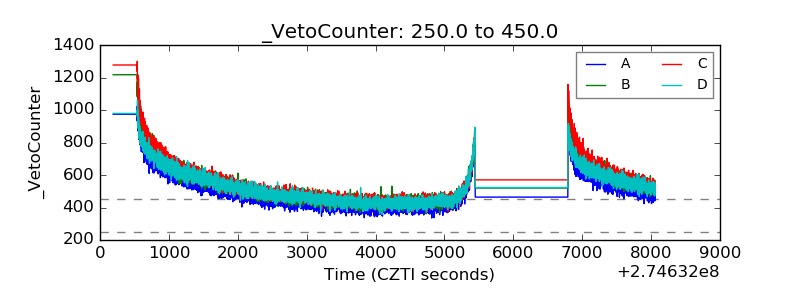 |