| Param | Original file | Final file |
|---|---|---|
| Filename | modeM0/AS1T02_091T01_9000002368_16026cztM0_level2.evt | modeM0/AS1T02_091T01_9000002368_16026cztM0_level2_quad_clean.evt |
| Size (bytes) | 488,905,920 | 100,817,280 |
| Size | 466.3 MB | 96.1 MB |
| Events in quadrant A | 3,509,549 | 647,659 |
| Events in quadrant B | 3,780,194 | 660,099 |
| Events in quadrant C | 3,565,210 | 637,626 |
| Events in quadrant D | 3,480,592 | 624,604 |
| Mode SS | |||
|---|---|---|---|
| Quadrant | BADHDUFLAG | Total packets | Discarded packets |
| A | 0 | 140 | 0 |
| B | 0 | 140 | 0 |
| C | 0 | 140 | 0 |
| D | 0 | 140 | 0 |
| Mode M9 | |||
|---|---|---|---|
| Quadrant | BADHDUFLAG | Total packets | Discarded packets |
| A | 0 | 9 | 0 |
| B | 0 | 9 | 0 |
| C | 0 | 9 | 0 |
| D | 0 | 10 | 0 |
| Mode M0 | |||
|---|---|---|---|
| Quadrant | BADHDUFLAG | Total packets | Discarded packets |
| A | 0 | 14704 | 3 |
| B | 0 | 15540 | 2 |
| C | 0 | 14794 | 2 |
| D | 0 | 14900 | 2 |
| Quadrant | Total seconds | Saturated seconds | Saturation percentage |
|---|---|---|---|
| A | 6939 | 80 | 1.152904% |
| B | 6939 | 118 | 1.700533% |
| C | 6939 | 107 | 1.542009% |
| D | 6939 | 74 | 1.066436% |
Noise dominated data is calculated using 1-second bins in cleaned event files. If a bin has >2000 counts, and if more than 50% of those come from <1% of pixels, then it is considered to be noise-dominated and hence unusable.
| Quadrant | # 1 sec bins | Bins with >0 counts | Bins with >2000 counts | High rate bins dominated by noise | Noise dominated (total time) | Noise dominated (detector-on time) | Marked lightcurve |
|---|---|---|---|---|---|---|---|
| A | 7645 | 6940 | 29 | 29 | 0.38% | 0.42% | 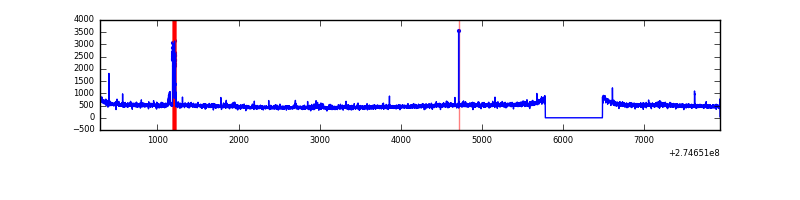 |
| B | 7645 | 6941 | 14 | 14 | 0.18% | 0.20% | 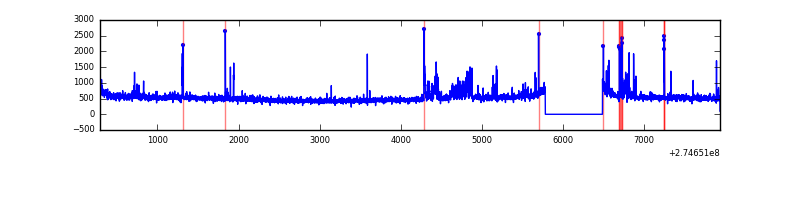 |
| C | 7645 | 6941 | 0 | 0 | 0.00% | 0.00% | 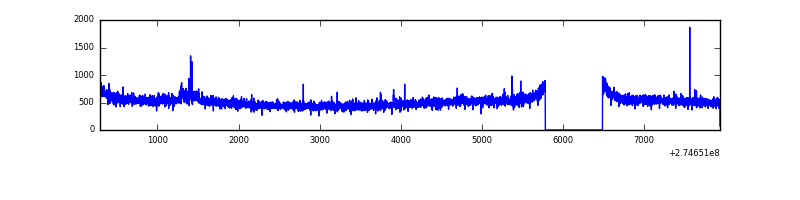 |
| D | 7645 | 6940 | 11 | 11 | 0.14% | 0.16% | 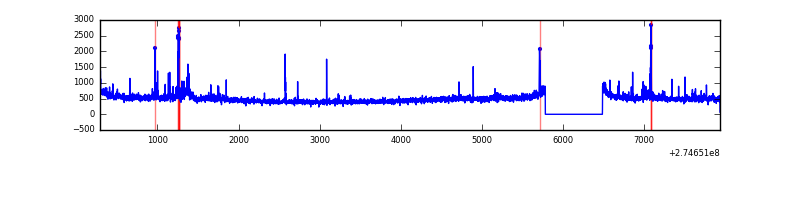 |
Top three noisy pixels from each quadrant. If the there are fewer than three noisy pixels in the level2.evt file, extra rows are filled as -1
| Pixel properties | Quadrant properties | ||||||
|---|---|---|---|---|---|---|---|
| Quadrant | DetID | PixID | Counts | Sigma | Mean | Median | Sigma |
| A | 15 | 69 | 84171 | 469.14 | 879 | 862 | 177.6 |
| A | 12 | 96 | 16019 | 85.35 | 879 | 862 | 177.6 |
| A | 9 | 143 | 10395 | 53.68 | 879 | 862 | 177.6 |
| B | 15 | 222 | 81668 | 480.91 | 884 | 863 | 168.0 |
| B | 10 | 245 | 56259 | 329.69 | 884 | 863 | 168.0 |
| B | 7 | 220 | 55533 | 325.37 | 884 | 863 | 168.0 |
| C | 14 | 238 | 133364 | 664.3 | 851 | 860 | 199.5 |
| C | 3 | 233 | 107203 | 533.15 | 851 | 860 | 199.5 |
| C | 13 | 61 | 6016 | 25.85 | 851 | 860 | 199.5 |
| D | 2 | 152 | 129358 | 595.96 | 861 | 839 | 215.7 |
| D | 2 | 16 | 54020 | 246.61 | 861 | 839 | 215.7 |
| D | 2 | 234 | 25762 | 115.57 | 861 | 839 | 215.7 |
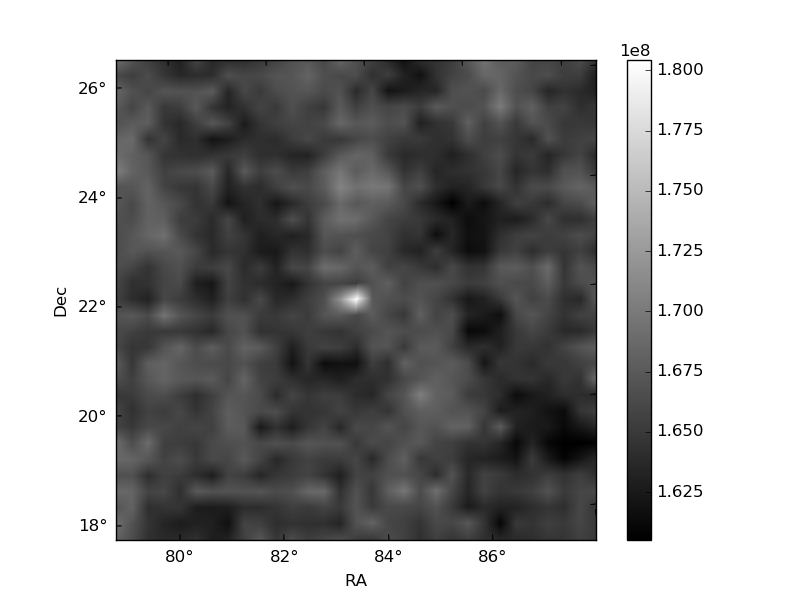
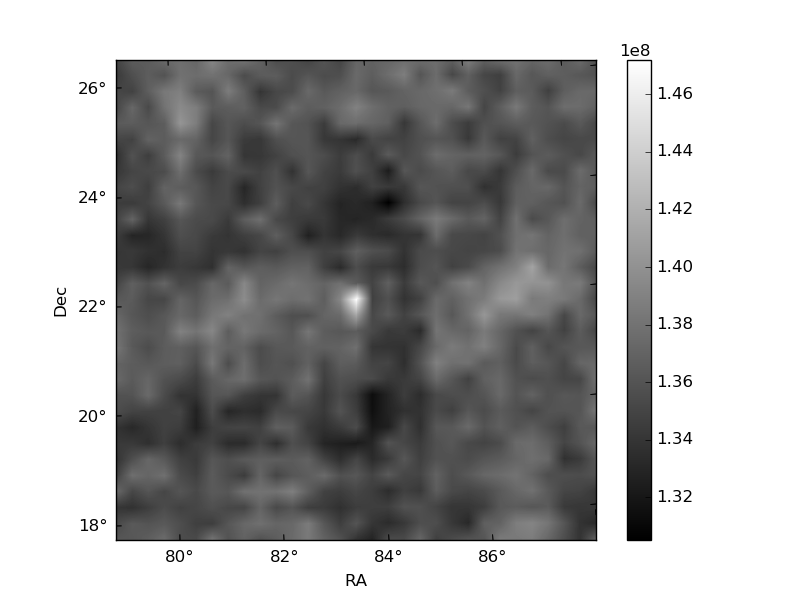
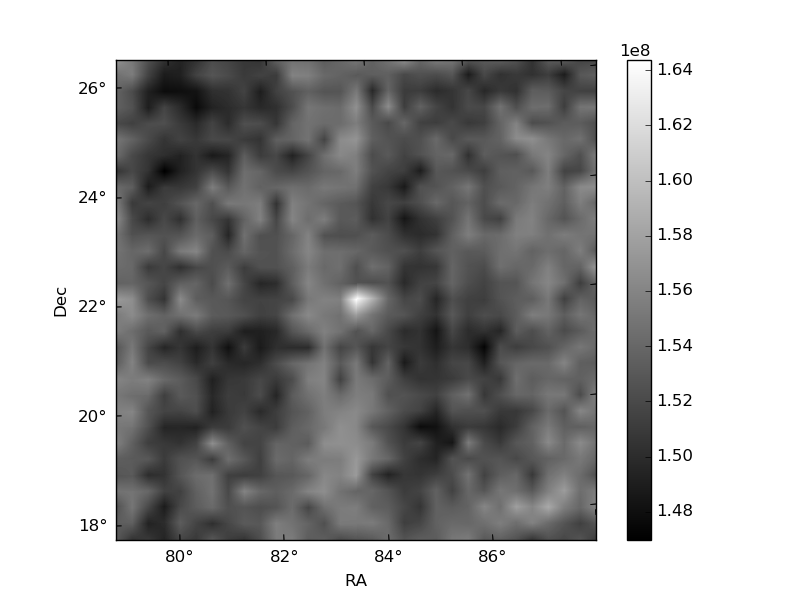
Histogram calculated using DETX and DETY for each event in the final _common_clean file
| Quadrant A | 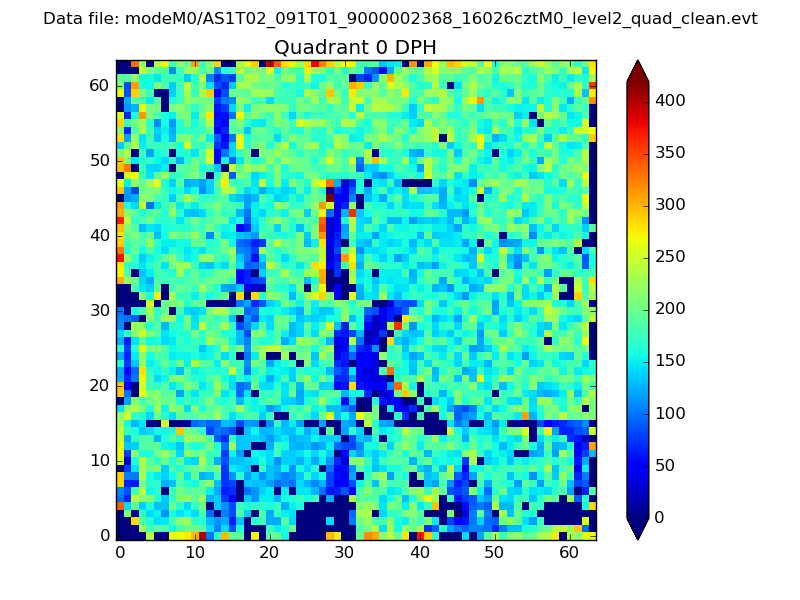 |
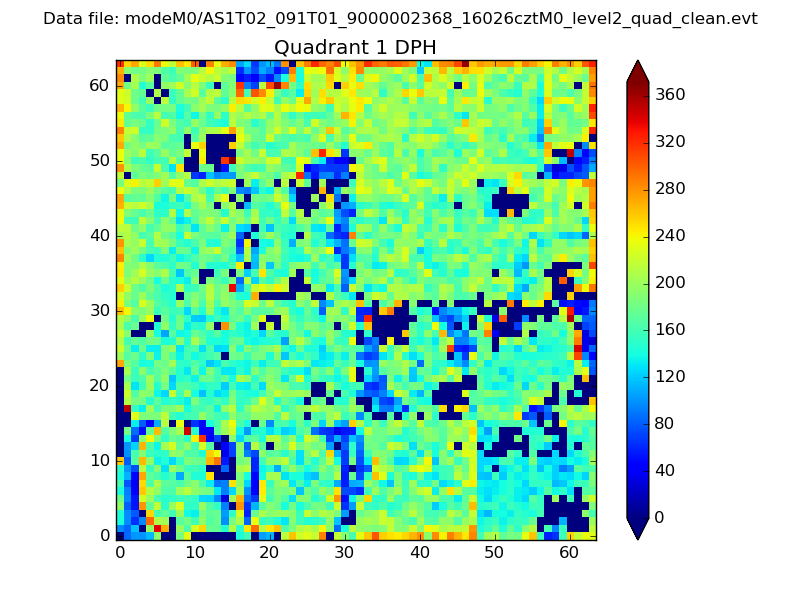 |
Quadrant B |
|---|---|---|---|
| Quadrant D | 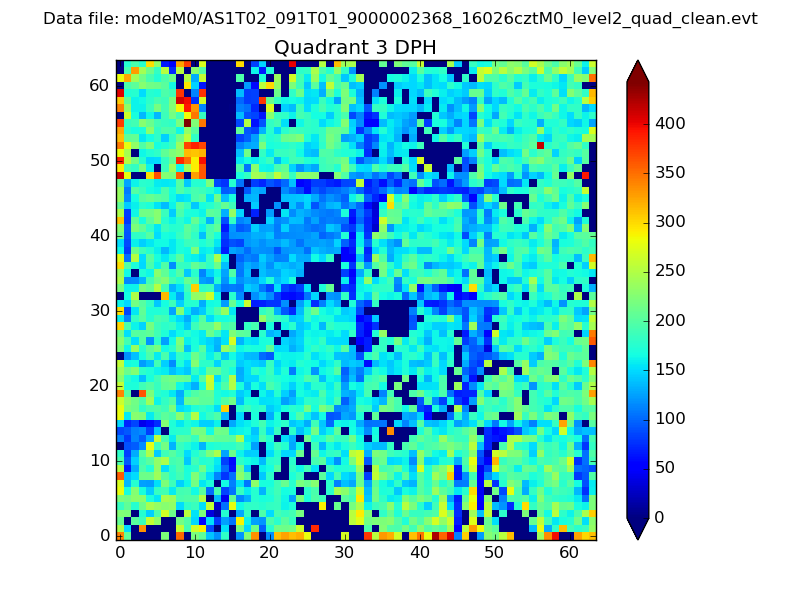 |
 |
Quadrant C |
| Plot type | Count rate plots | Images |
|---|---|---|
| Comparison with Poisson distribution Blue bars denote a histogram of data divided into 1 sec bins. Red curve is a Poisson curve with rate = median count rate of data. |
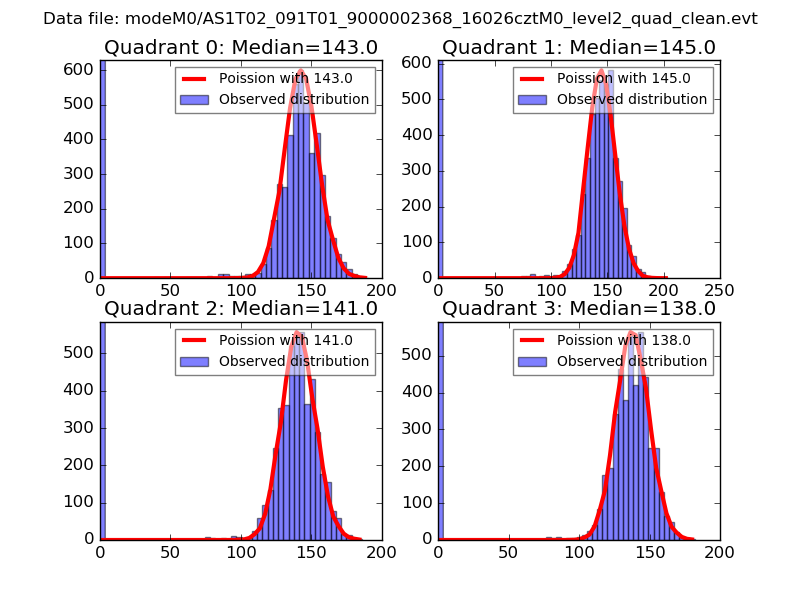 |
 |
| Quadrant-wise count rates Data is divided into 100 sec bins |
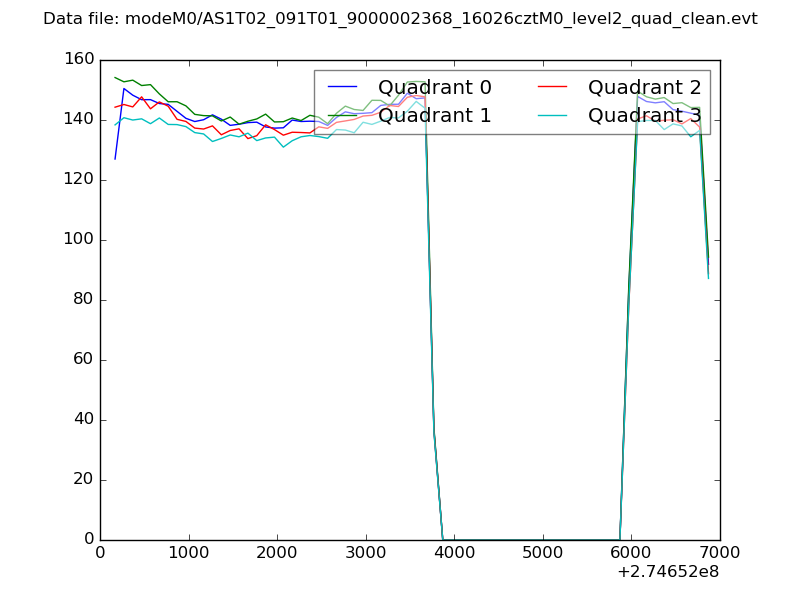 |
|
| Module-wise count rates for Quadrant A Data is divided into 100 sec bins |
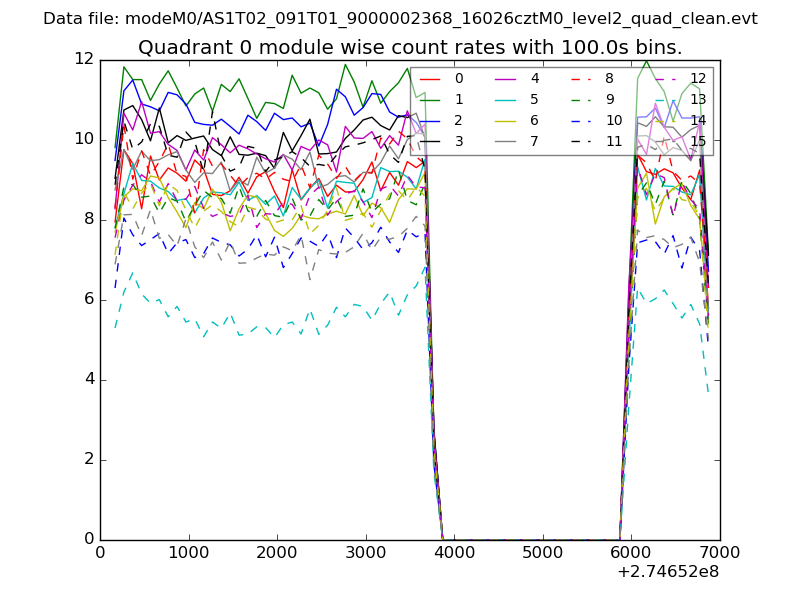 |
 |
| Module-wise count rates for Quadrant B Data is divided into 100 sec bins |
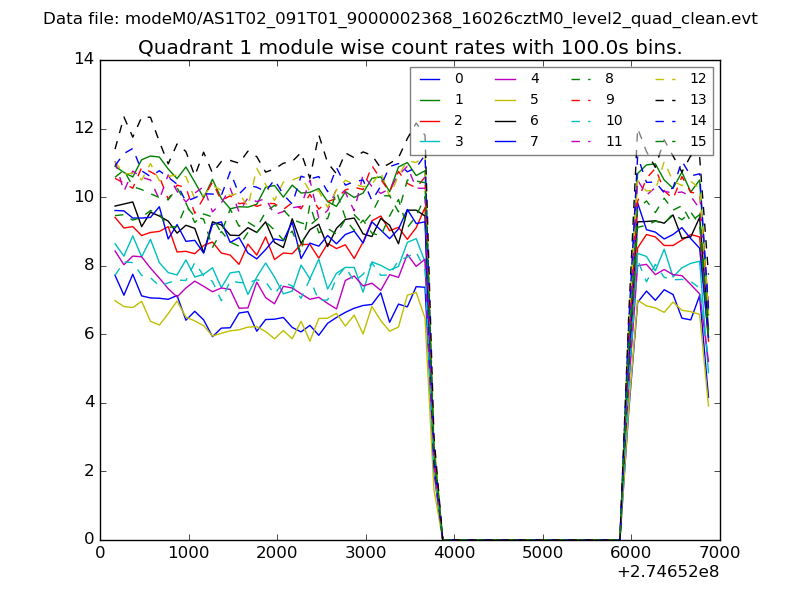 |
 |
| Module-wise count rates for Quadrant C Data is divided into 100 sec bins |
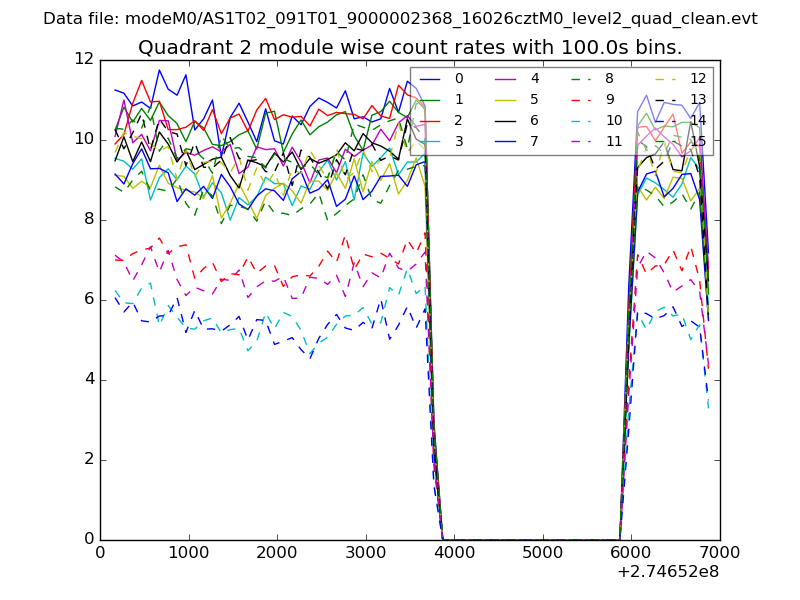 |
 |
| Module-wise count rates for Quadrant D Data is divided into 100 sec bins |
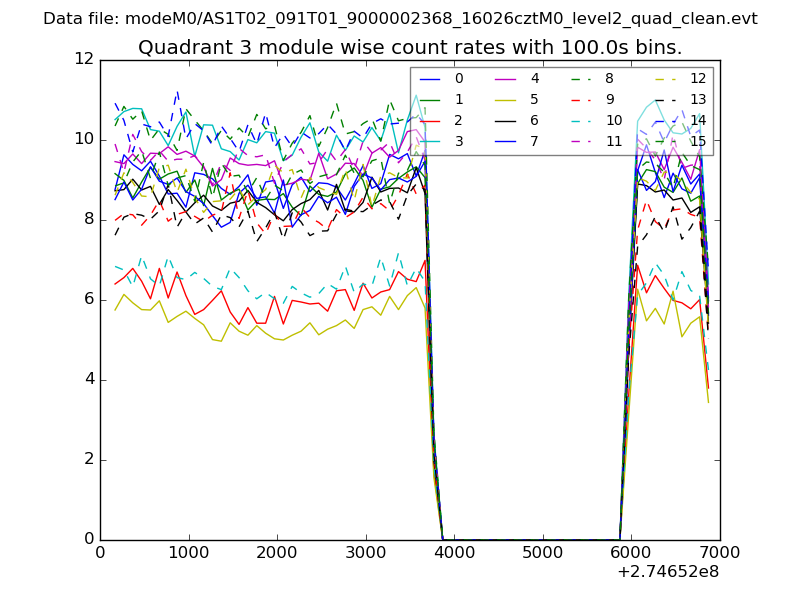 |
 |
| Parameter | Plot |
|---|---|
| CZT HV Monitor | 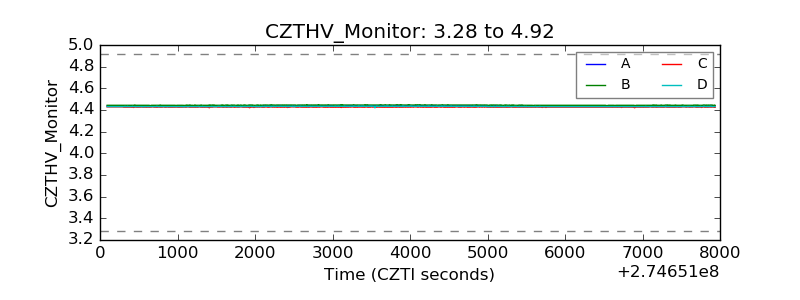 |
| D_VDD | 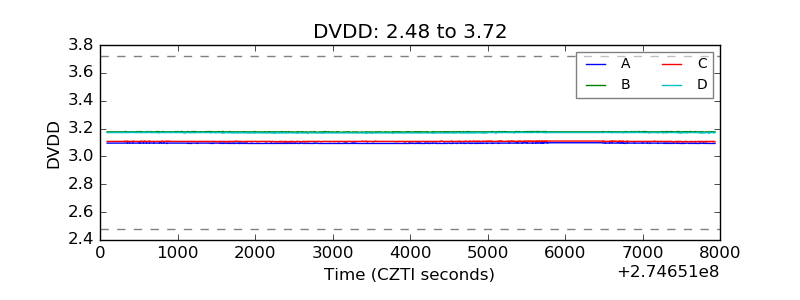 |
| Temperature 1 | 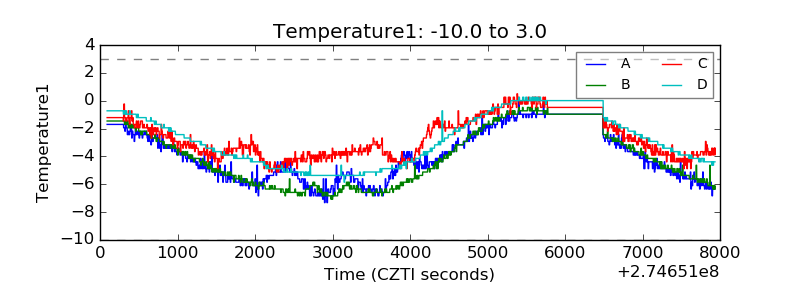 |
| Veto HV Monitor | 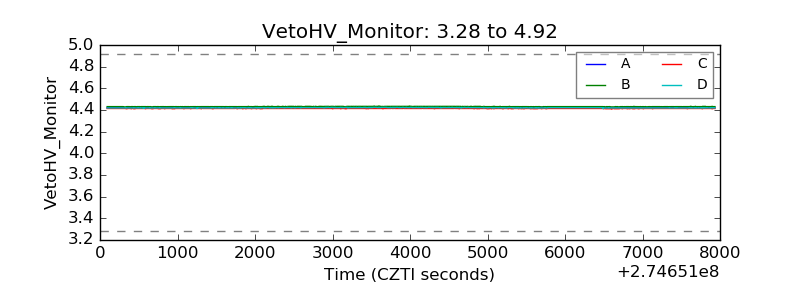 |
| Veto LLD | 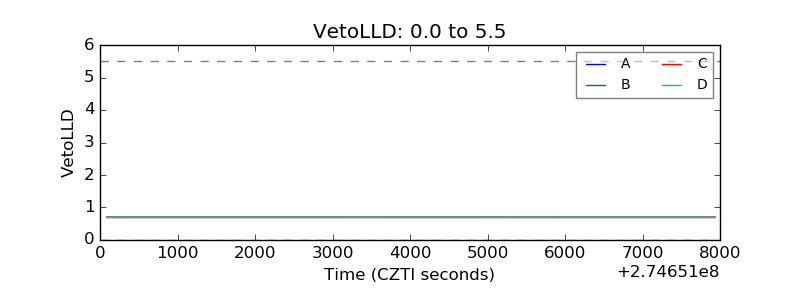 |
| Alpha Counter | 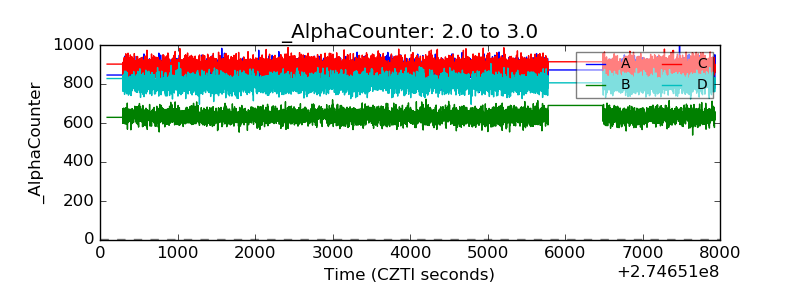 |
| _CPM_Rate | 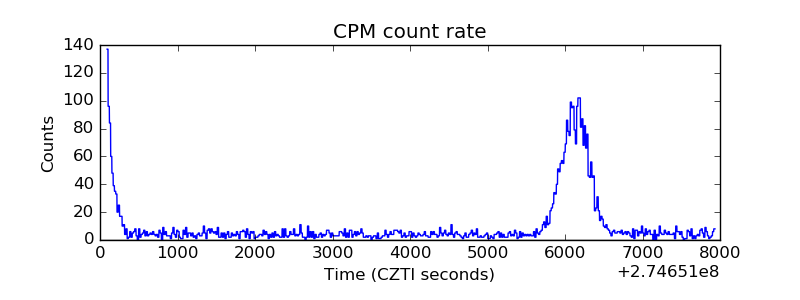 |
| CZT Counter |  |
| +2.5 Volts monitor |  |
| +5 Volts monitor |  |
| _ROLL_ROT | 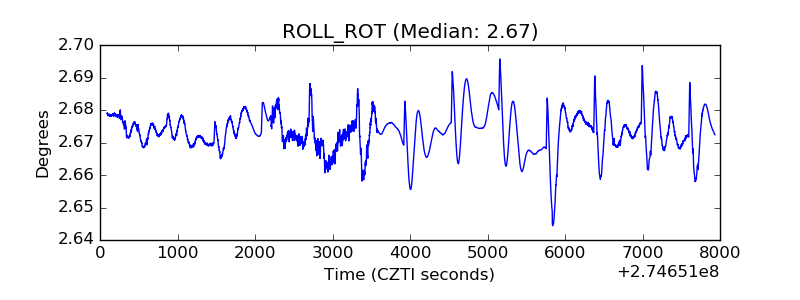 |
| _Roll_DEC | 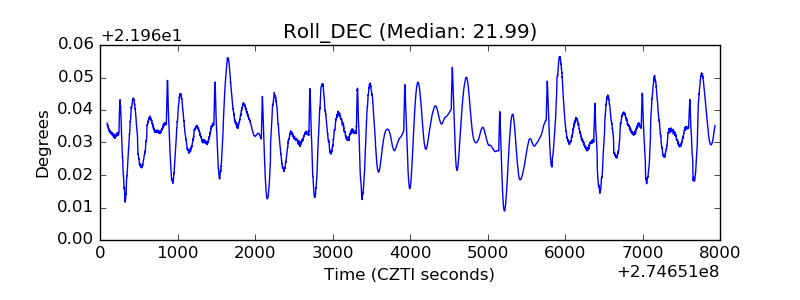 |
| _Roll_RA | 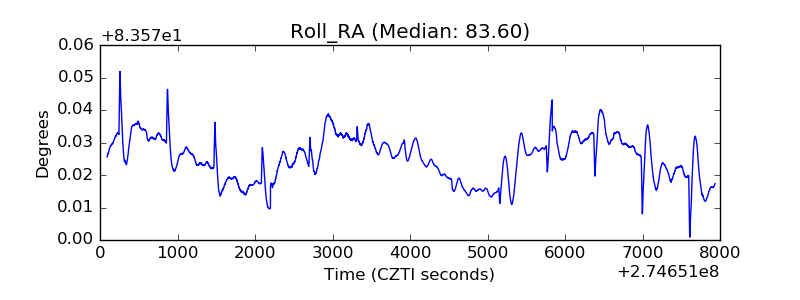 |
| Veto Counter | 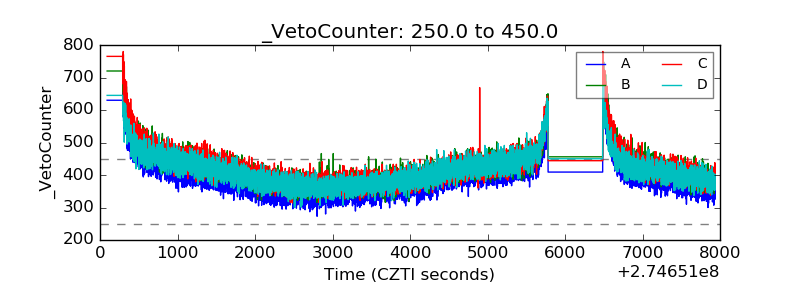 |