| Param | Original file | Final file |
|---|---|---|
| Filename | modeM0/AS1T02_091T01_9000002368_16027cztM0_level2.evt | modeM0/AS1T02_091T01_9000002368_16027cztM0_level2_quad_clean.evt |
| Size (bytes) | 511,914,240 | 106,801,920 |
| Size | 488.2 MB | 101.9 MB |
| Events in quadrant A | 3,587,115 | 690,284 |
| Events in quadrant B | 4,160,732 | 699,728 |
| Events in quadrant C | 3,722,329 | 674,239 |
| Events in quadrant D | 3,536,270 | 660,976 |
| Mode SS | |||
|---|---|---|---|
| Quadrant | BADHDUFLAG | Total packets | Discarded packets |
| A | 0 | 148 | 0 |
| B | 0 | 148 | 0 |
| C | 0 | 148 | 0 |
| D | 0 | 148 | 0 |
| Mode M9 | |||
|---|---|---|---|
| Quadrant | BADHDUFLAG | Total packets | Discarded packets |
| A | 0 | 6 | 0 |
| B | 0 | 6 | 0 |
| C | 0 | 6 | 0 |
| D | 0 | 7 | 0 |
| Mode M0 | |||
|---|---|---|---|
| Quadrant | BADHDUFLAG | Total packets | Discarded packets |
| A | 0 | 15309 | 3 |
| B | 0 | 17058 | 2 |
| C | 0 | 15461 | 2 |
| D | 0 | 15453 | 2 |
| Quadrant | Total seconds | Saturated seconds | Saturation percentage |
|---|---|---|---|
| A | 7319 | 42 | 0.573849% |
| B | 7319 | 179 | 2.445689% |
| C | 7319 | 106 | 1.448285% |
| D | 7319 | 47 | 0.642164% |
Noise dominated data is calculated using 1-second bins in cleaned event files. If a bin has >2000 counts, and if more than 50% of those come from <1% of pixels, then it is considered to be noise-dominated and hence unusable.
| Quadrant | # 1 sec bins | Bins with >0 counts | Bins with >2000 counts | High rate bins dominated by noise | Noise dominated (total time) | Noise dominated (detector-on time) | Marked lightcurve |
|---|---|---|---|---|---|---|---|
| A | 7680 | 7321 | 1 | 1 | 0.01% | 0.01% | 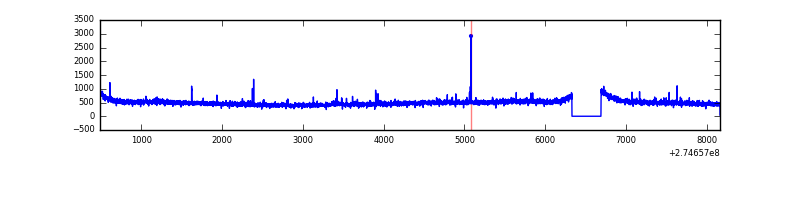 |
| B | 7680 | 7321 | 73 | 73 | 0.95% | 1.00% | 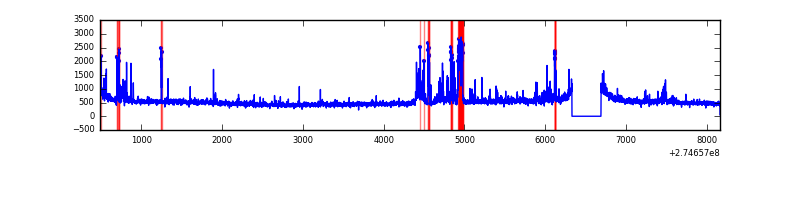 |
| C | 7680 | 7321 | 0 | 0 | 0.00% | 0.00% | 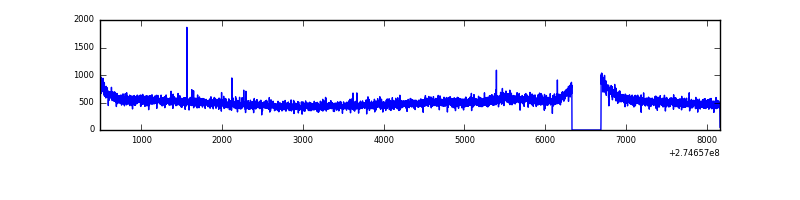 |
| D | 7680 | 7321 | 11 | 11 | 0.14% | 0.15% | 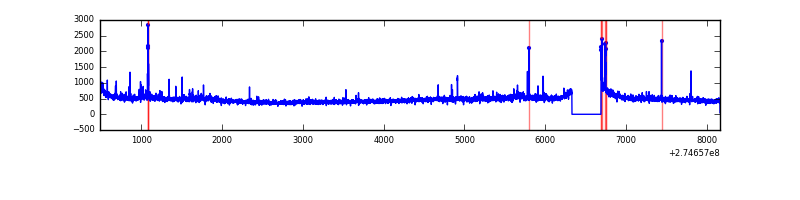 |
Top three noisy pixels from each quadrant. If the there are fewer than three noisy pixels in the level2.evt file, extra rows are filled as -1
| Pixel properties | Quadrant properties | ||||||
|---|---|---|---|---|---|---|---|
| Quadrant | DetID | PixID | Counts | Sigma | Mean | Median | Sigma |
| A | 9 | 143 | 18395 | 93.63 | 921 | 903 | 186.8 |
| A | 12 | 96 | 17108 | 86.74 | 921 | 903 | 186.8 |
| A | 15 | 157 | 8666 | 41.55 | 921 | 903 | 186.8 |
| B | 15 | 222 | 288612 | 1633.01 | 921 | 900 | 176.2 |
| B | 7 | 220 | 107902 | 607.32 | 921 | 900 | 176.2 |
| B | 0 | 189 | 63965 | 357.94 | 921 | 900 | 176.2 |
| C | 14 | 238 | 138361 | 655.35 | 888 | 894 | 209.8 |
| C | 3 | 233 | 109515 | 517.83 | 888 | 894 | 209.8 |
| C | 13 | 61 | 6369 | 26.1 | 888 | 894 | 209.8 |
| D | 2 | 152 | 66579 | 297.29 | 897 | 872 | 221.0 |
| D | 7 | 38 | 29671 | 130.3 | 897 | 872 | 221.0 |
| D | 2 | 234 | 27023 | 118.32 | 897 | 872 | 221.0 |
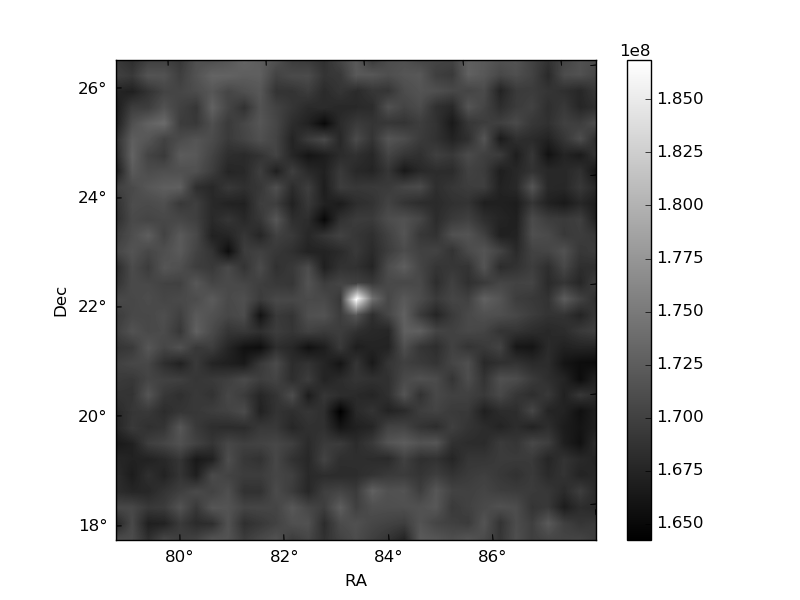
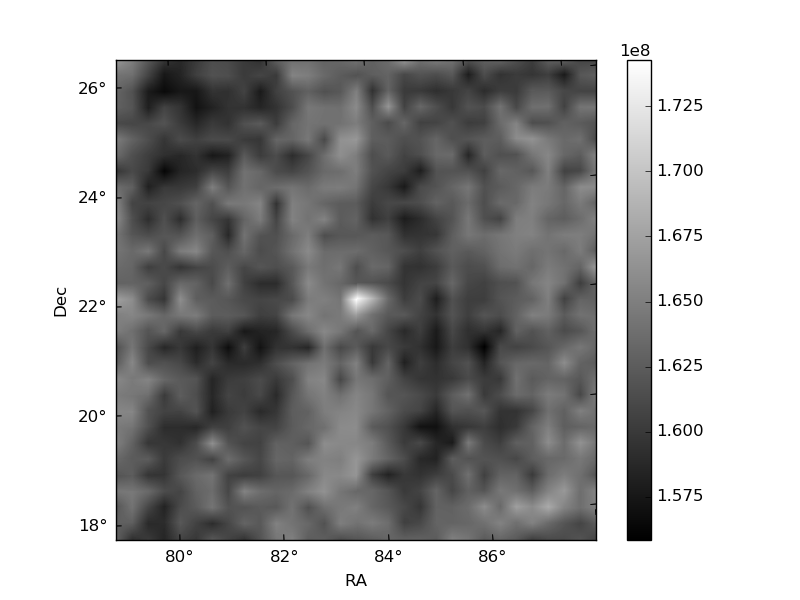
Histogram calculated using DETX and DETY for each event in the final _common_clean file
| Quadrant A |  |
 |
Quadrant B |
|---|---|---|---|
| Quadrant D | 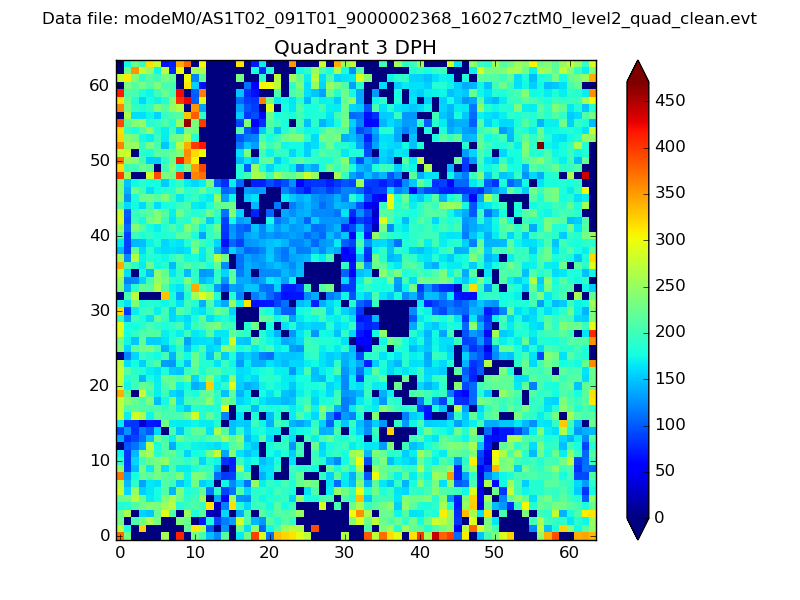 |
 |
Quadrant C |
| Plot type | Count rate plots | Images |
|---|---|---|
| Comparison with Poisson distribution Blue bars denote a histogram of data divided into 1 sec bins. Red curve is a Poisson curve with rate = median count rate of data. |
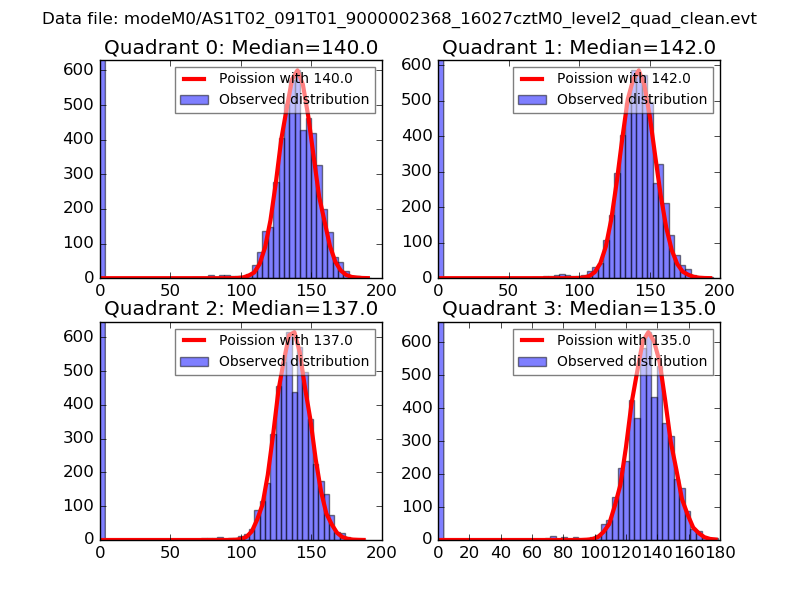 |
 |
| Quadrant-wise count rates Data is divided into 100 sec bins |
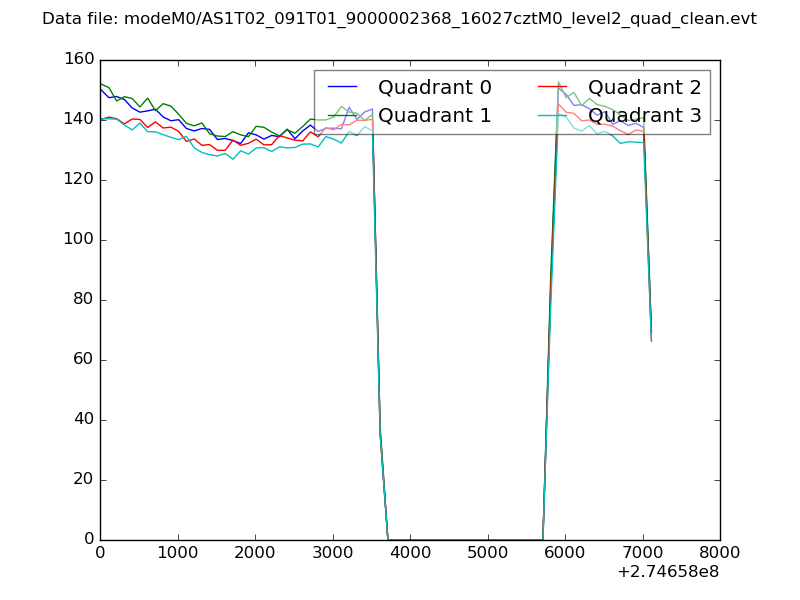 |
|
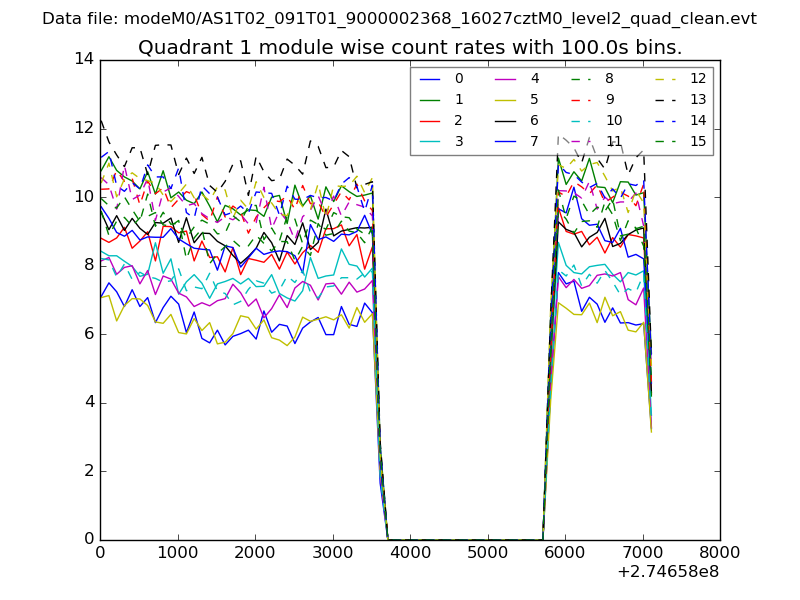
| Module-wise count rates for Quadrant A Data is divided into 100 sec bins |
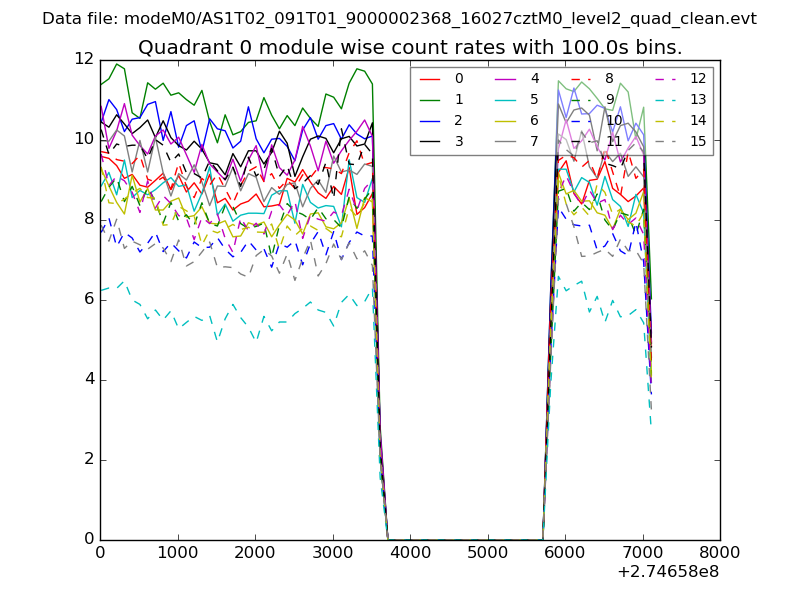 |
 |
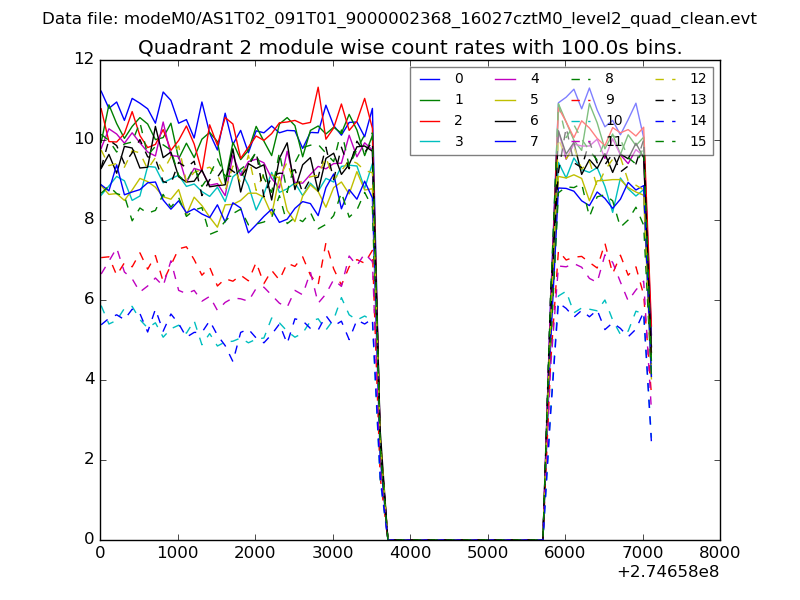
| Module-wise count rates for Quadrant B Data is divided into 100 sec bins |
 |
 |
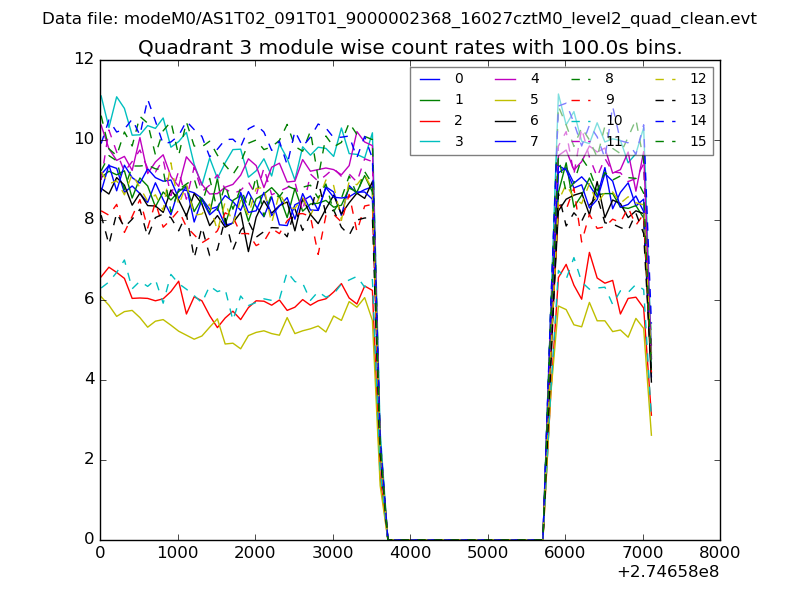
| Module-wise count rates for Quadrant C Data is divided into 100 sec bins |
 |
 |
| Module-wise count rates for Quadrant D Data is divided into 100 sec bins |
 |
 |
| Parameter | Plot |
|---|---|
| CZT HV Monitor | 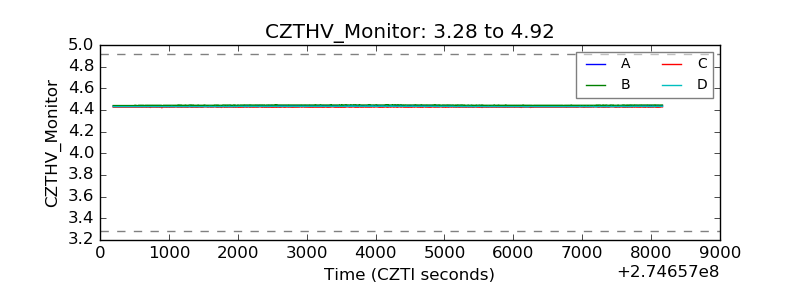 |
| D_VDD | 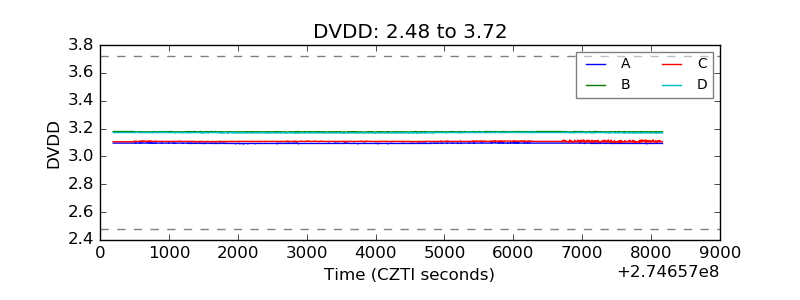 |
| Temperature 1 | 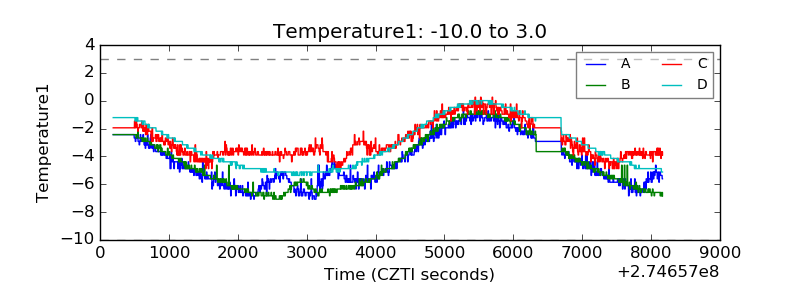 |
| Veto HV Monitor |  |
| Veto LLD | 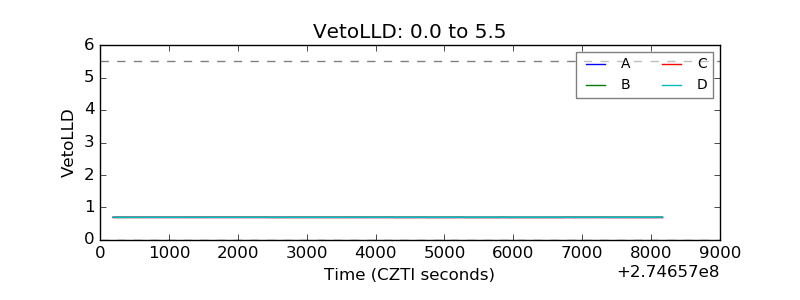 |
| Alpha Counter | 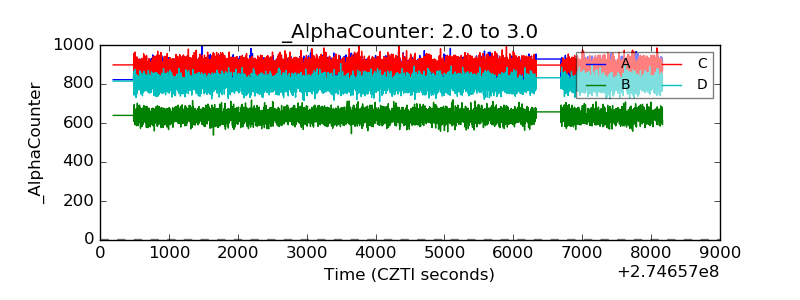 |
| _CPM_Rate | 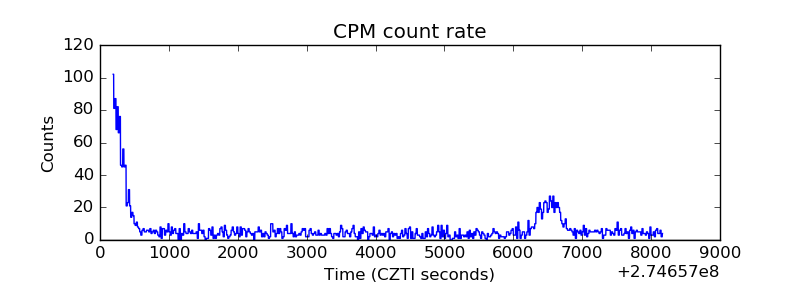 |
| CZT Counter |  |
| +2.5 Volts monitor |  |
| +5 Volts monitor |  |
| _ROLL_ROT | 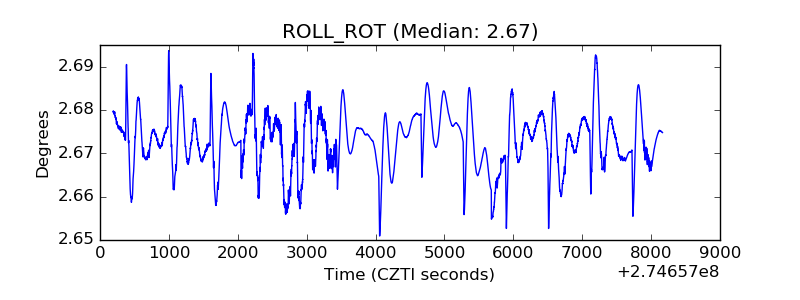 |
| _Roll_DEC | 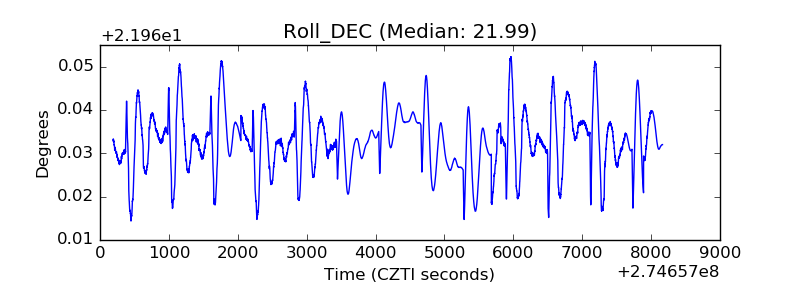 |
| _Roll_RA | 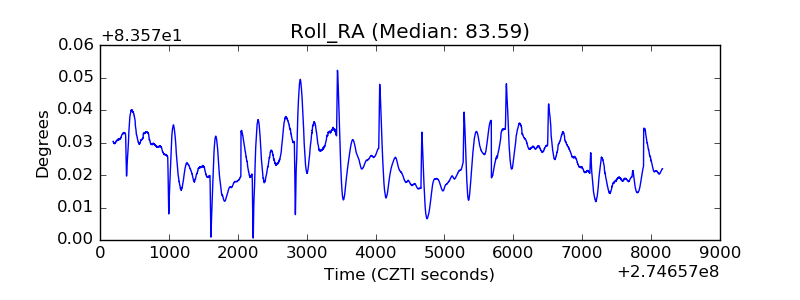 |
| Veto Counter | 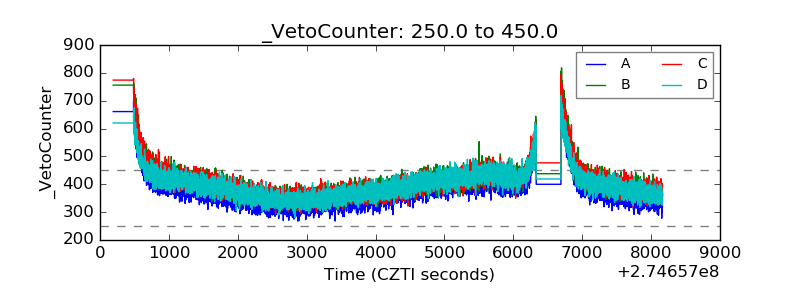 |