| Param | Original file | Final file |
|---|---|---|
| Filename | modeM0/AS1T02_091T01_9000002368_16028cztM0_level2.evt | modeM0/AS1T02_091T01_9000002368_16028cztM0_level2_quad_clean.evt |
| Size (bytes) | 536,820,480 | 113,676,480 |
| Size | 512.0 MB | 108.4 MB |
| Events in quadrant A | 3,806,918 | 736,185 |
| Events in quadrant B | 4,037,714 | 744,051 |
| Events in quadrant C | 4,136,029 | 716,882 |
| Events in quadrant D | 3,747,452 | 703,252 |
| Mode SS | |||
|---|---|---|---|
| Quadrant | BADHDUFLAG | Total packets | Discarded packets |
| A | 0 | 158 | 0 |
| B | 0 | 158 | 0 |
| C | 0 | 158 | 0 |
| D | 0 | 158 | 0 |
| Mode M9 | |||
|---|---|---|---|
| Quadrant | BADHDUFLAG | Total packets | Discarded packets |
| A | 0 | 7 | 0 |
| B | 0 | 7 | 0 |
| C | 0 | 7 | 0 |
| D | 0 | 7 | 0 |
| Mode M0 | |||
|---|---|---|---|
| Quadrant | BADHDUFLAG | Total packets | Discarded packets |
| A | 0 | 16416 | 3 |
| B | 0 | 17081 | 2 |
| C | 0 | 17516 | 2 |
| D | 0 | 16564 | 2 |
| Quadrant | Total seconds | Saturated seconds | Saturation percentage |
|---|---|---|---|
| A | 7808 | 85 | 1.088627% |
| B | 7808 | 158 | 2.023566% |
| C | 7808 | 160 | 2.049180% |
| D | 7808 | 63 | 0.806865% |
Noise dominated data is calculated using 1-second bins in cleaned event files. If a bin has >2000 counts, and if more than 50% of those come from <1% of pixels, then it is considered to be noise-dominated and hence unusable.
| Quadrant | # 1 sec bins | Bins with >0 counts | Bins with >2000 counts | High rate bins dominated by noise | Noise dominated (total time) | Noise dominated (detector-on time) | Marked lightcurve |
|---|---|---|---|---|---|---|---|
| A | 8419 | 7810 | 0 | 0 | 0.00% | 0.00% | 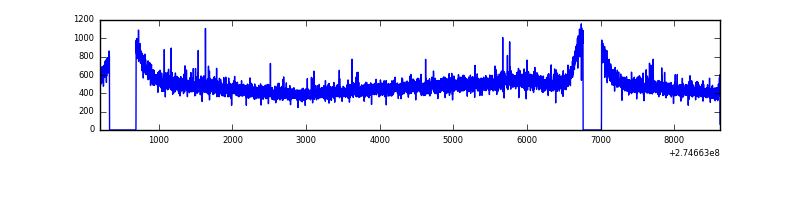 |
| B | 8419 | 7810 | 1 | 1 | 0.01% | 0.01% | 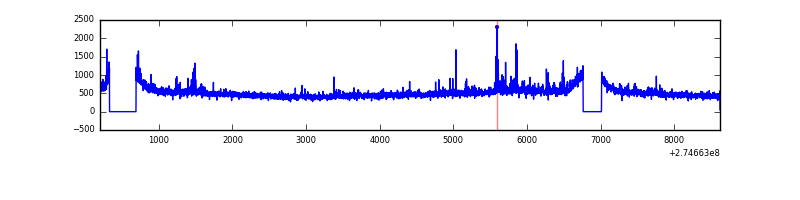 |
| C | 8419 | 7810 | 0 | 0 | 0.00% | 0.00% | 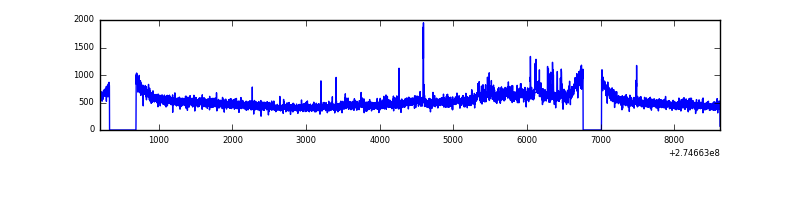 |
| D | 8419 | 7811 | 11 | 11 | 0.13% | 0.14% | 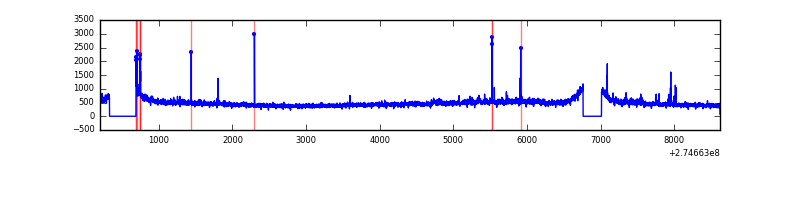 |
Top three noisy pixels from each quadrant. If the there are fewer than three noisy pixels in the level2.evt file, extra rows are filled as -1
| Pixel properties | Quadrant properties | ||||||
|---|---|---|---|---|---|---|---|
| Quadrant | DetID | PixID | Counts | Sigma | Mean | Median | Sigma |
| A | 9 | 143 | 12720 | 58.54 | 984 | 966 | 200.8 |
| A | 0 | 226 | 8674 | 38.39 | 984 | 966 | 200.8 |
| A | 12 | 194 | 7389 | 31.99 | 984 | 966 | 200.8 |
| B | 0 | 189 | 73108 | 377.27 | 990 | 968 | 191.2 |
| B | 7 | 220 | 36504 | 185.84 | 990 | 968 | 191.2 |
| B | 12 | 111 | 21501 | 107.38 | 990 | 968 | 191.2 |
| C | 3 | 233 | 278658 | 1233.79 | 946 | 951 | 225.1 |
| C | 14 | 238 | 144734 | 638.8 | 946 | 951 | 225.1 |
| C | 8 | 128 | 11830 | 48.33 | 946 | 951 | 225.1 |
| D | 2 | 152 | 73962 | 307.87 | 955 | 928 | 237.2 |
| D | 2 | 234 | 29430 | 120.15 | 955 | 928 | 237.2 |
| D | 15 | 145 | 18001 | 71.97 | 955 | 928 | 237.2 |
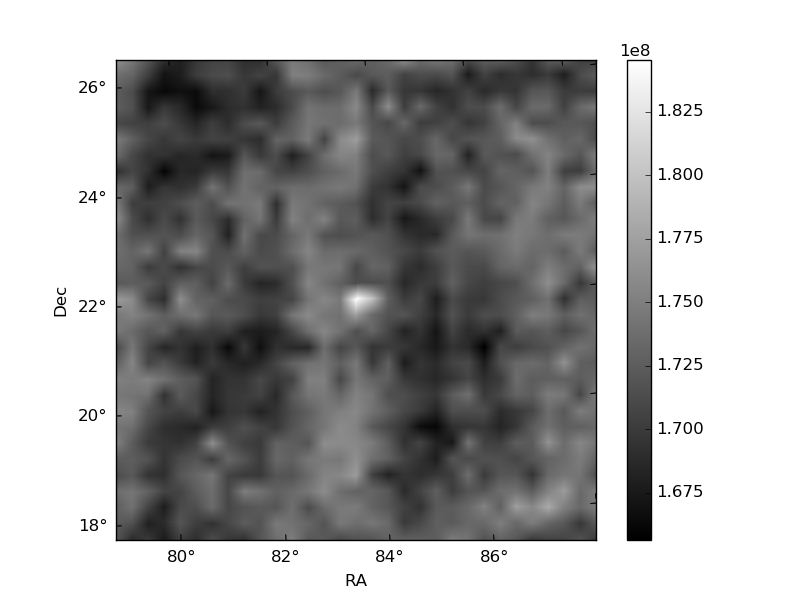
Histogram calculated using DETX and DETY for each event in the final _common_clean file
| Quadrant A | 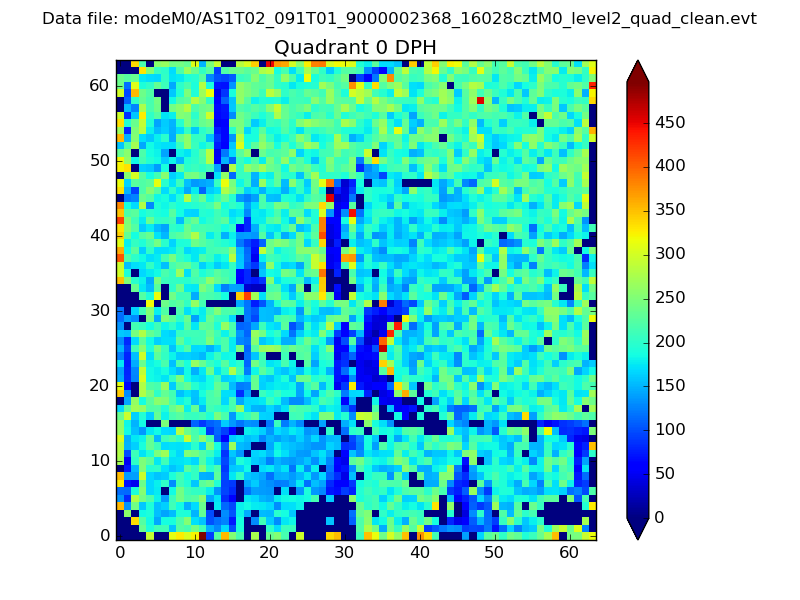 |
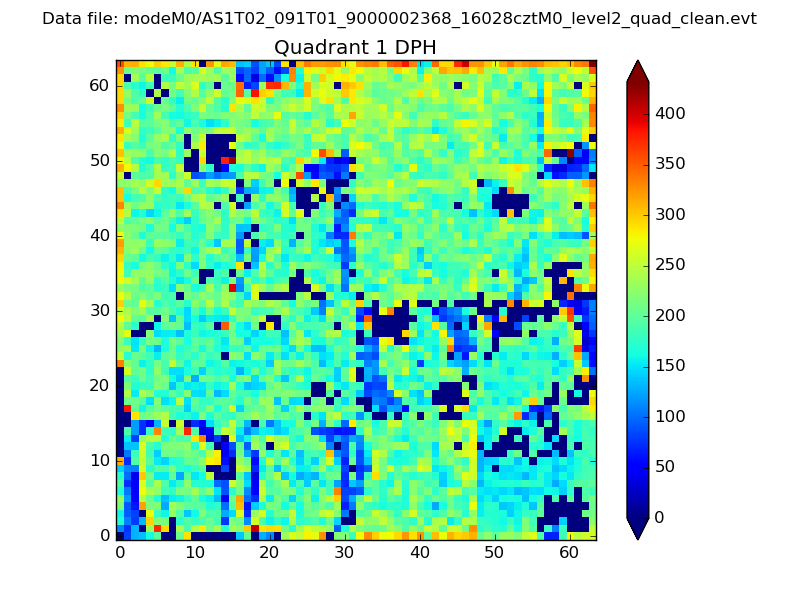 |
Quadrant B |
|---|---|---|---|
| Quadrant D | 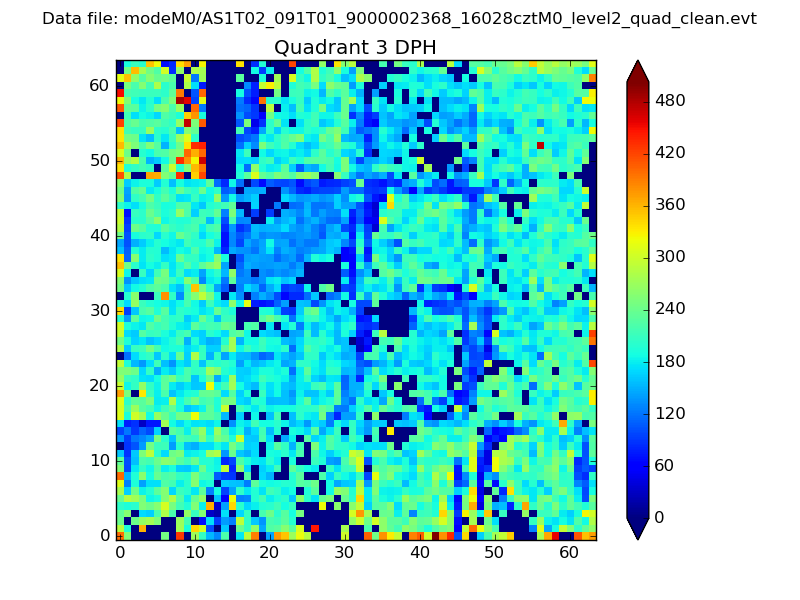 |
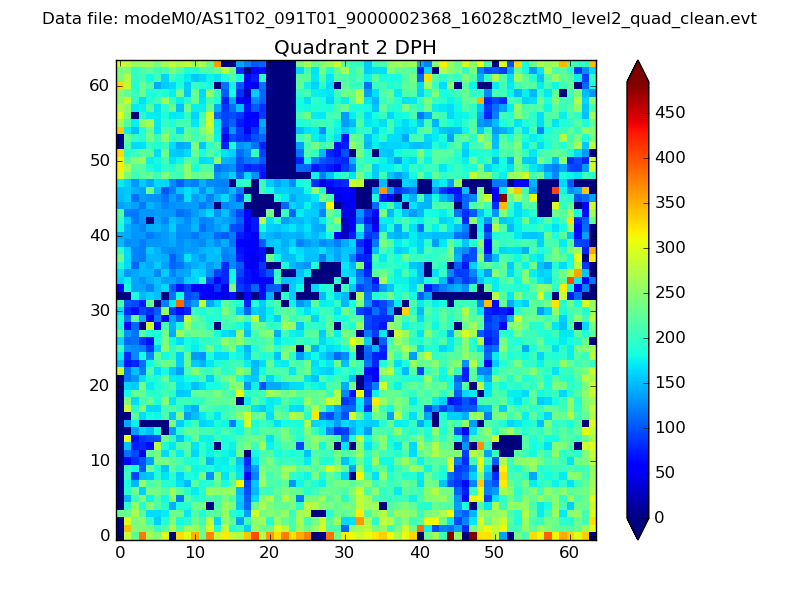 |
Quadrant C |
| Plot type | Count rate plots | Images |
|---|---|---|
| Comparison with Poisson distribution Blue bars denote a histogram of data divided into 1 sec bins. Red curve is a Poisson curve with rate = median count rate of data. |
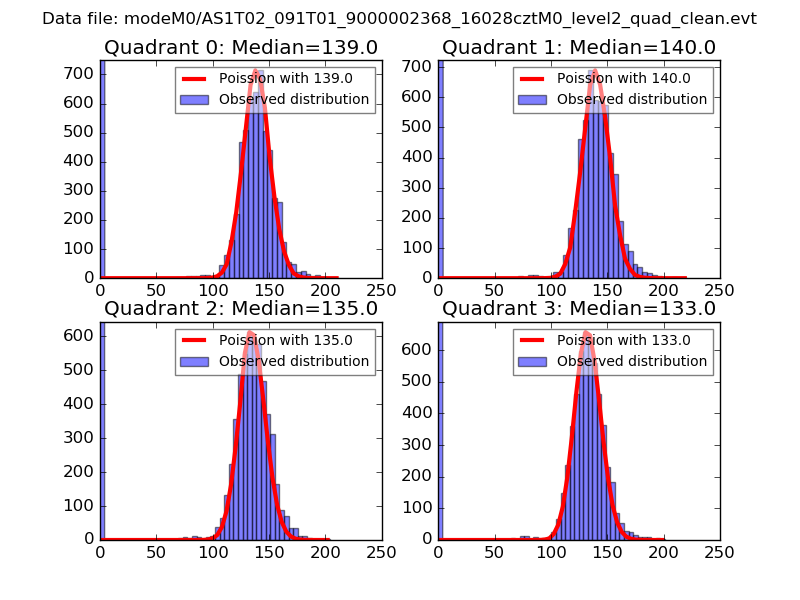 |
 |
| Quadrant-wise count rates Data is divided into 100 sec bins |
 |
|
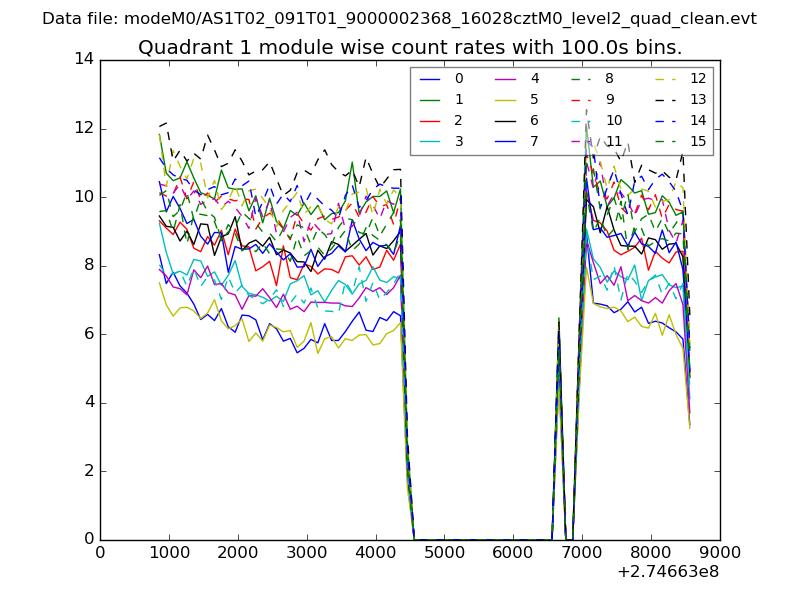
| Module-wise count rates for Quadrant A Data is divided into 100 sec bins |
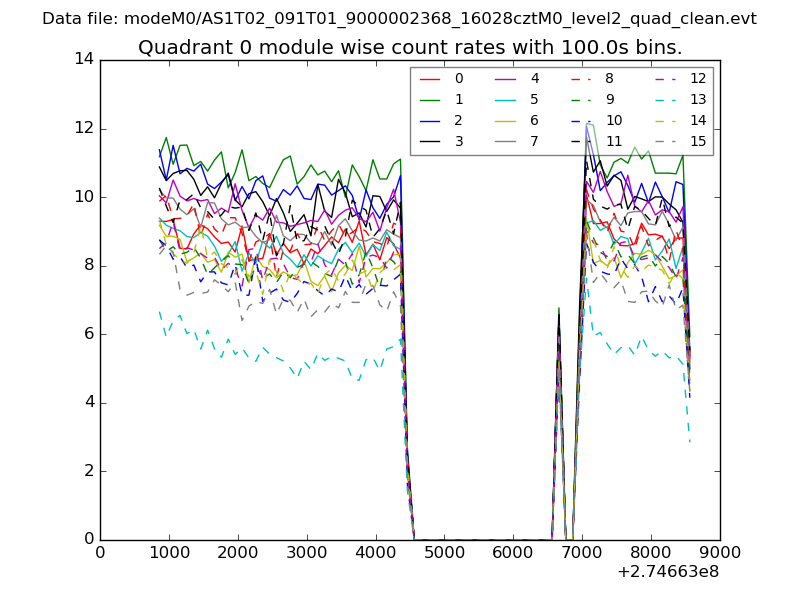 |
 |
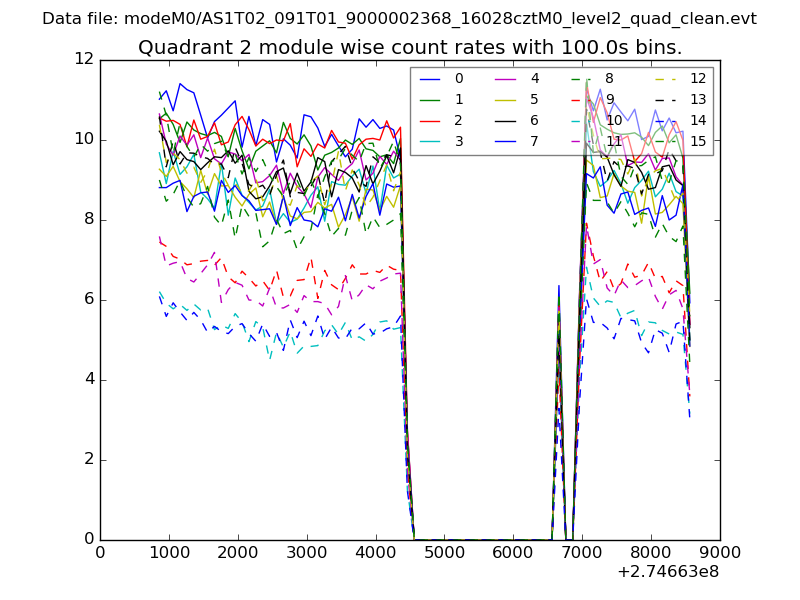
| Module-wise count rates for Quadrant B Data is divided into 100 sec bins |
 |
 |
| Module-wise count rates for Quadrant C Data is divided into 100 sec bins |
 |
 |
| Module-wise count rates for Quadrant D Data is divided into 100 sec bins |
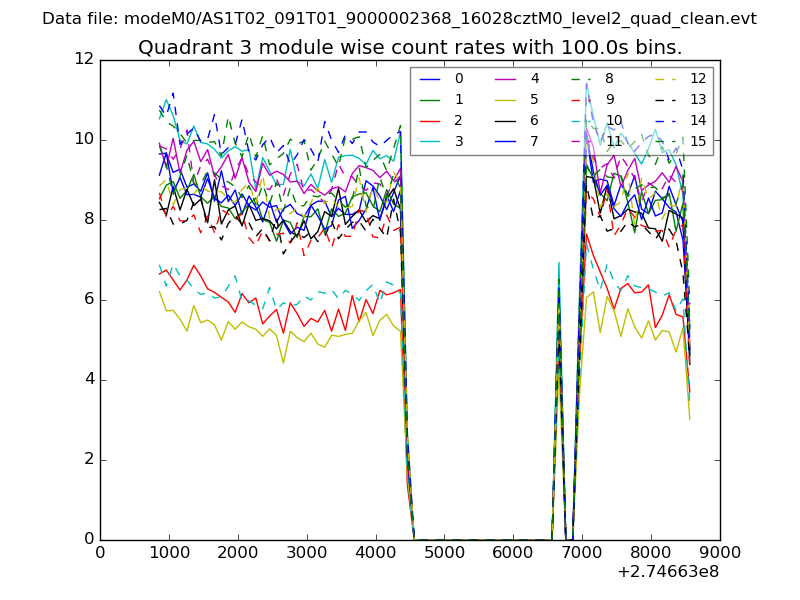 |
 |
| Parameter | Plot |
|---|---|
| CZT HV Monitor | 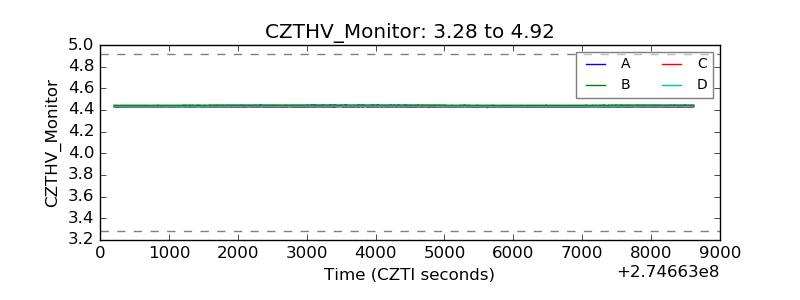 |
| D_VDD | 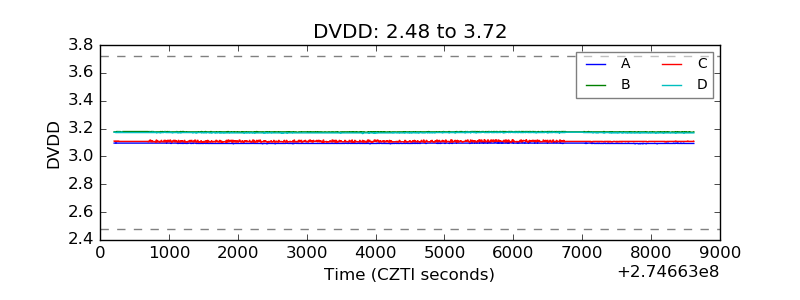 |
| Temperature 1 | 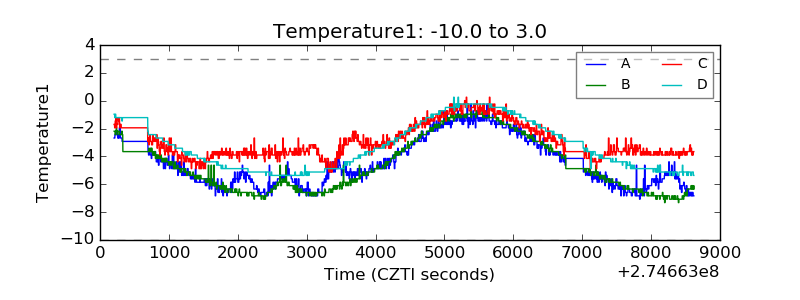 |
| Veto HV Monitor | 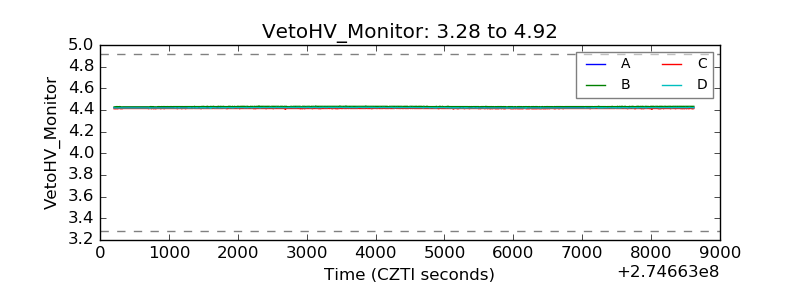 |
| Veto LLD | 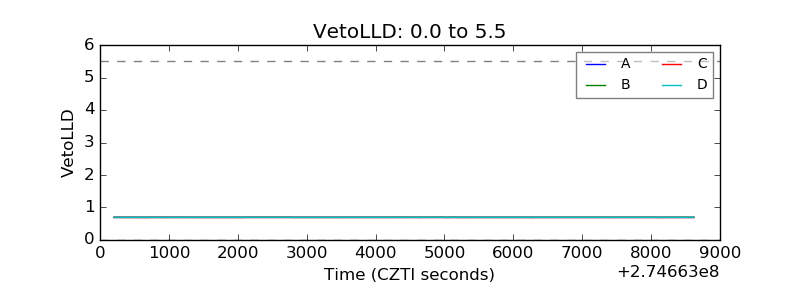 |
| Alpha Counter | 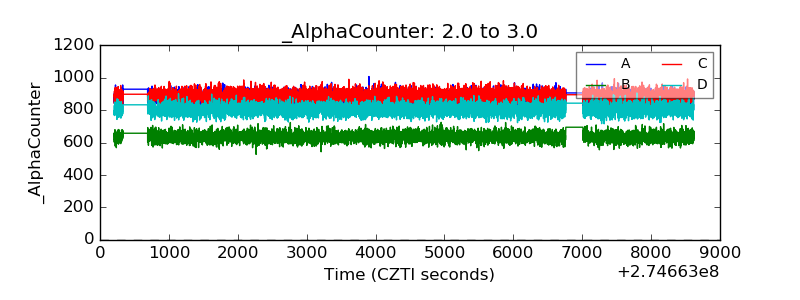 |
| _CPM_Rate | 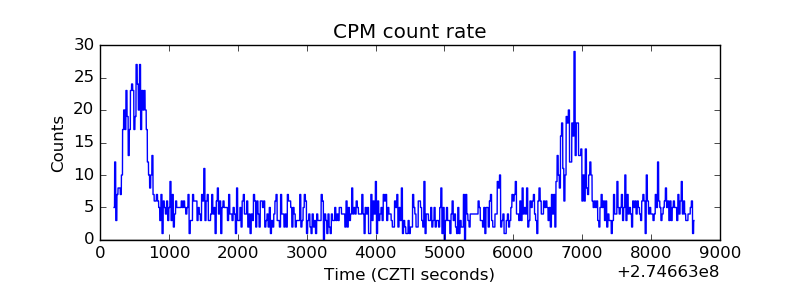 |
| CZT Counter | 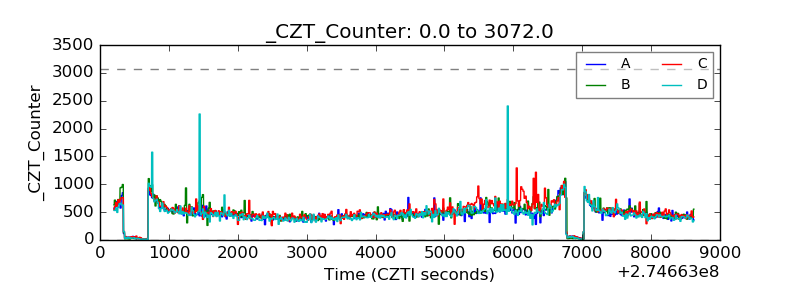 |
| +2.5 Volts monitor |  |
| +5 Volts monitor |  |
| _ROLL_ROT | 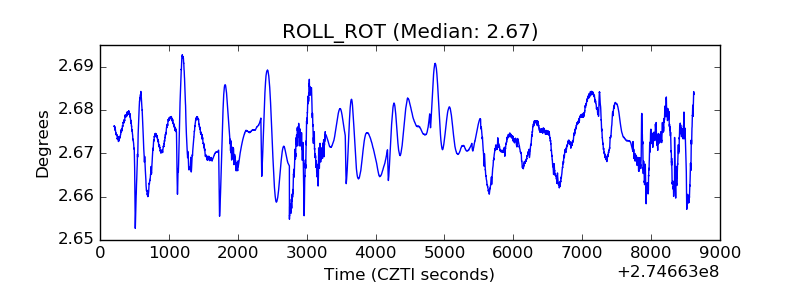 |
| _Roll_DEC | 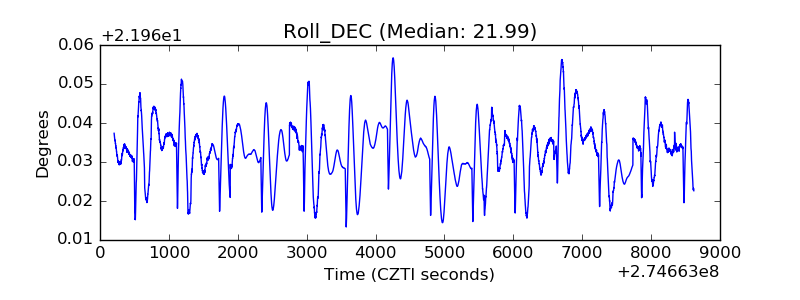 |
| _Roll_RA | 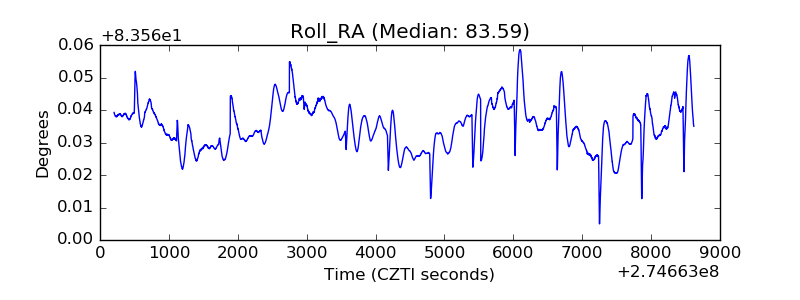 |
| Veto Counter | 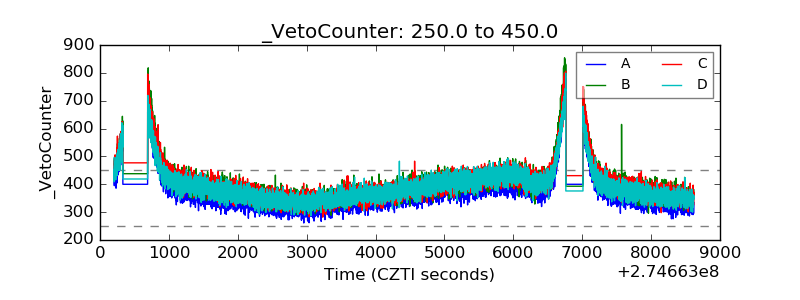 |