| Param | Original file | Final file |
|---|---|---|
| Filename | modeM0/AS1G08_012T01_9000002370cztM0_level2.fits | modeM0/AS1G08_012T01_9000002370cztM0_level2_quad_clean.evt |
| Size (bytes) | 1,344,548,160 | 1,272,847,680 |
| Size | 1.3 GB | 1.2 GB |
| Events in quadrant A | 8,199,590 | 7,522,614 |
| Events in quadrant B | 7,945,314 | 7,590,938 |
| Events in quadrant C | 8,101,654 | 7,325,635 |
| Events in quadrant D | 7,173,590 | 6,809,795 |
| Mode M0 | |||
|---|---|---|---|
| Quadrant | BADHDUFLAG | Total packets | Discarded packets |
| A | 0 | 288995 | 0 |
| B | 0 | 287401 | 0 |
| C | 0 | 290684 | 0 |
| D | 0 | 295076 | 0 |
| Mode M9 | |||
|---|---|---|---|
| Quadrant | BADHDUFLAG | Total packets | Discarded packets |
| A | 0 | 220 | 0 |
| B | 0 | 220 | 0 |
| C | 0 | 220 | 0 |
| D | 0 | 221 | 0 |
| Mode SS | |||
|---|---|---|---|
| Quadrant | BADHDUFLAG | Total packets | Discarded packets |
| A | 0 | 2762 | 0 |
| B | 0 | 2762 | 0 |
| C | 0 | 2762 | 0 |
| D | 0 | 2762 | 0 |
| Quadrant | Total seconds | Saturated seconds | Saturation percentage |
|---|---|---|---|
| A | 135742 | 1500 | 1.105037% |
| B | 135742 | 1614 | 1.189020% |
| C | 135742 | 2379 | 1.752589% |
| D | 135742 | 1552 | 1.143345% |
Noise dominated data is calculated using 1-second bins in cleaned event files. If a bin has >2000 counts, and if more than 50% of those come from <1% of pixels, then it is considered to be noise-dominated and hence unusable.
| Quadrant | # 1 sec bins | Bins with >0 counts | Bins with >2000 counts | High rate bins dominated by noise | Noise dominated (total time) | Noise dominated (detector-on time) | Marked lightcurve |
|---|---|---|---|---|---|---|---|
| A | 161719 | 135713 | 0 | 0 | 0.00% | 0.00% | 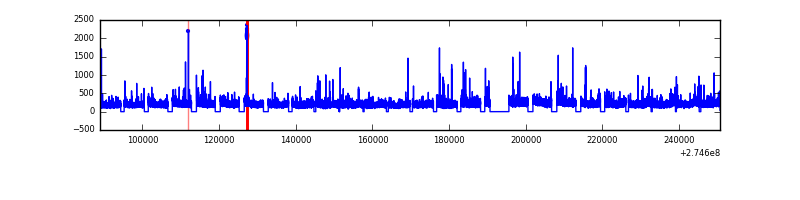 |
| B | 161719 | 135722 | 0 | 0 | 0.00% | 0.00% | 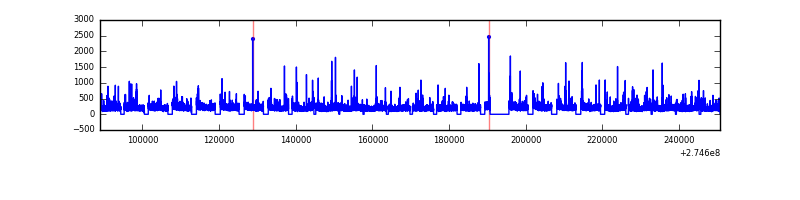 |
| C | 161719 | 135720 | 0 | 0 | 0.00% | 0.00% | 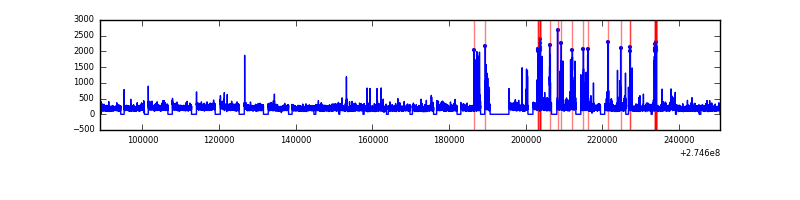 |
| D | 161719 | 135681 | 0 | 0 | 0.00% | 0.00% |  |
Top three noisy pixels from each quadrant. If the there are fewer than three noisy pixels in the level2.evt file, extra rows are filled as -1
| Pixel properties | Quadrant properties | ||||||
|---|---|---|---|---|---|---|---|
| Quadrant | DetID | PixID | Counts | Sigma | Mean | Median | Sigma |
| A | 0 | 29 | 7812 | 11.19 | 2134 | 1999 | 519.4 |
| A | 7 | 110 | 6460 | 8.59 | 2134 | 1999 | 519.4 |
| A | 9 | 19 | 6158 | 8.01 | 2134 | 1999 | 519.4 |
| B | 2 | 9 | 6378 | 10.69 | 2097 | 1998 | 409.6 |
| B | 2 | 8 | 5330 | 8.14 | 2097 | 1998 | 409.6 |
| B | 3 | 17 | 5167 | 7.74 | 2097 | 1998 | 409.6 |
| C | 12 | 241 | 5651 | 6.67 | 2145 | 2004 | 547.0 |
| C | 3 | 126 | 5530 | 6.45 | 2145 | 2004 | 547.0 |
| C | 2 | 191 | 5502 | 6.39 | 2145 | 2004 | 547.0 |
| D | 3 | 14 | 5248 | 6.27 | 2046 | 1868 | 539.3 |
| D | 6 | 231 | 5046 | 5.89 | 2046 | 1868 | 539.3 |
| D | 10 | 189 | 4988 | 5.79 | 2046 | 1868 | 539.3 |
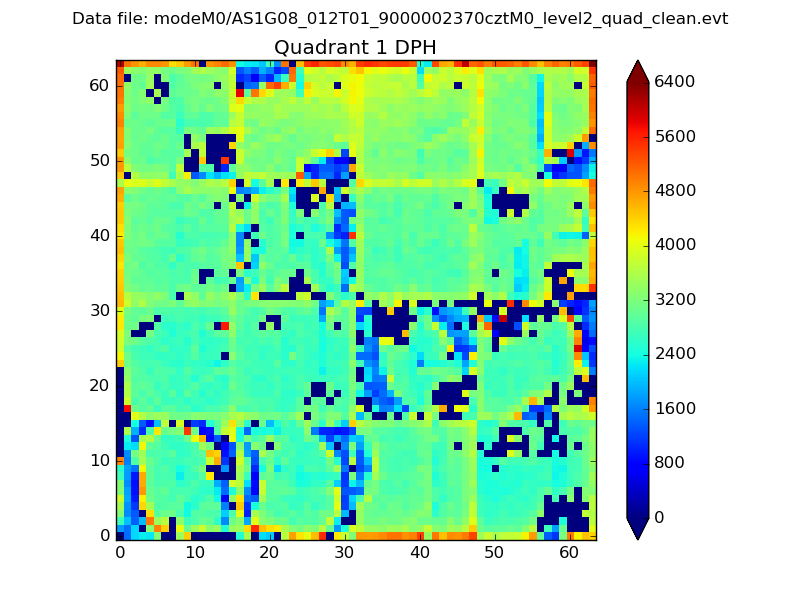
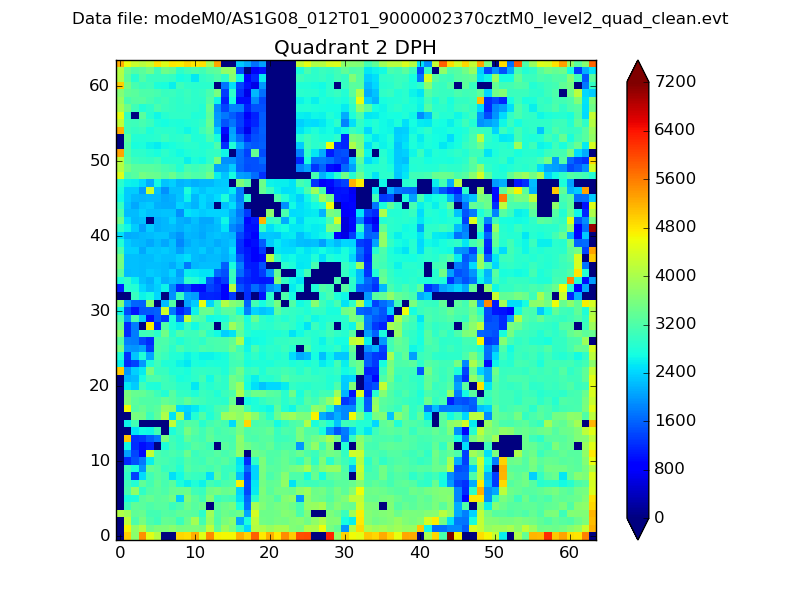
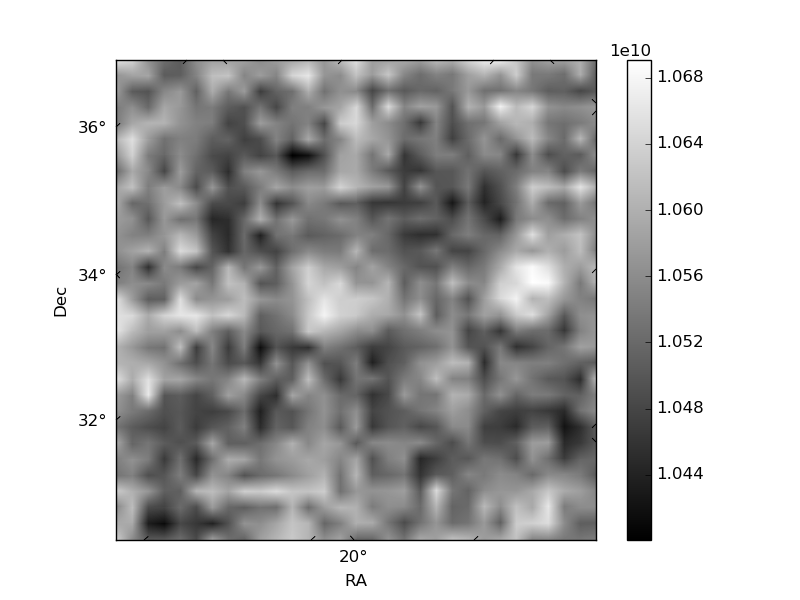
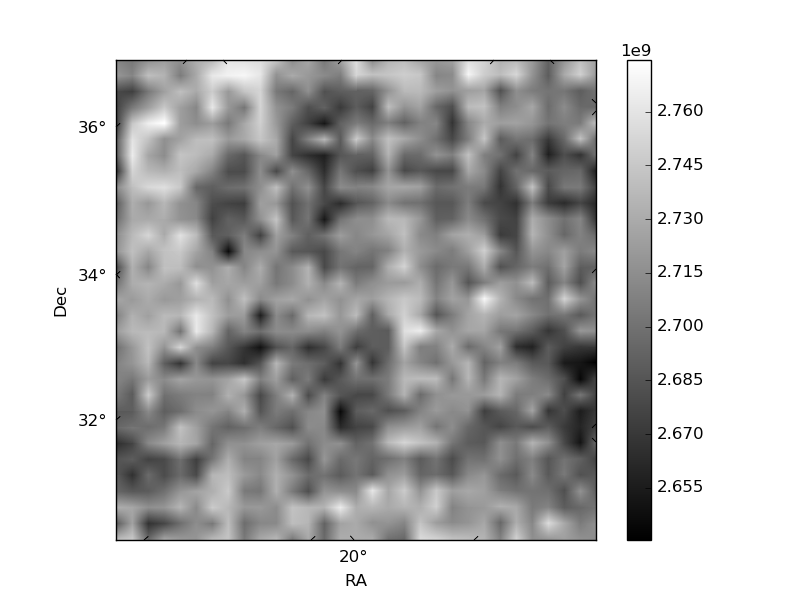
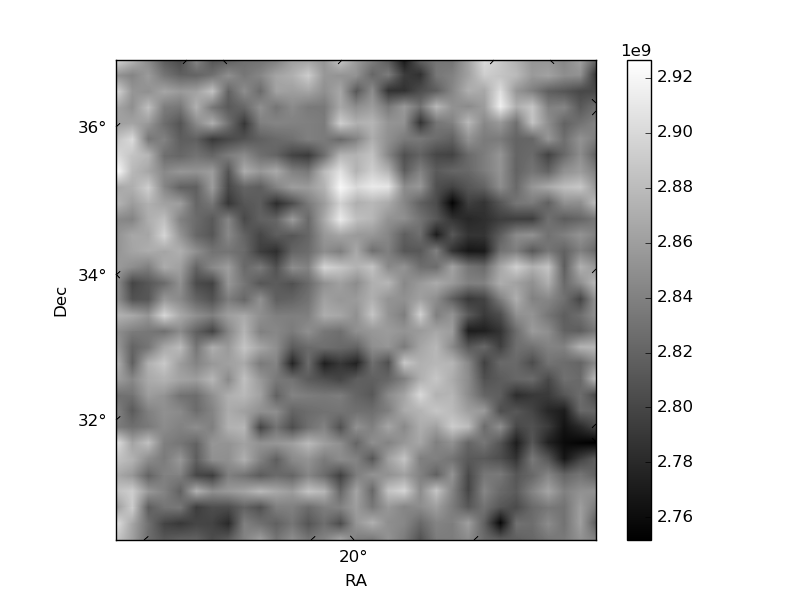
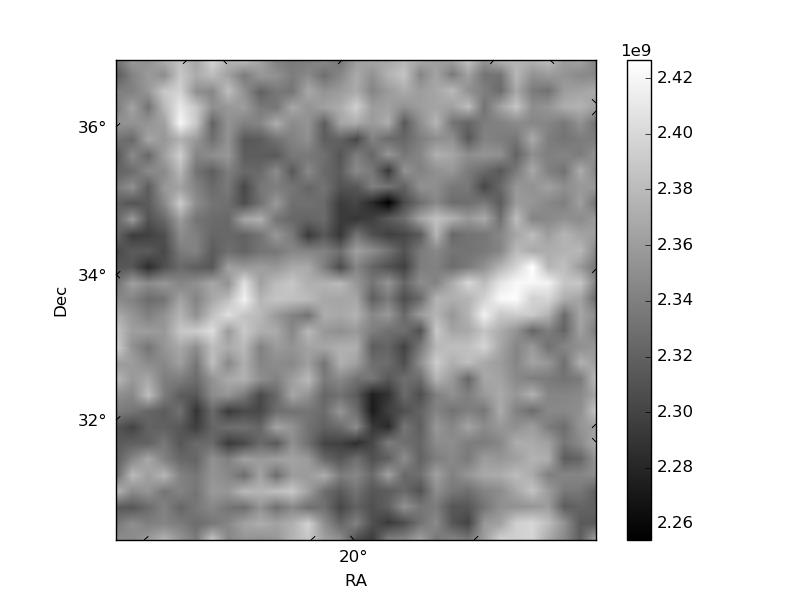
Histogram calculated using DETX and DETY for each event in the final _common_clean file
| Quadrant A | 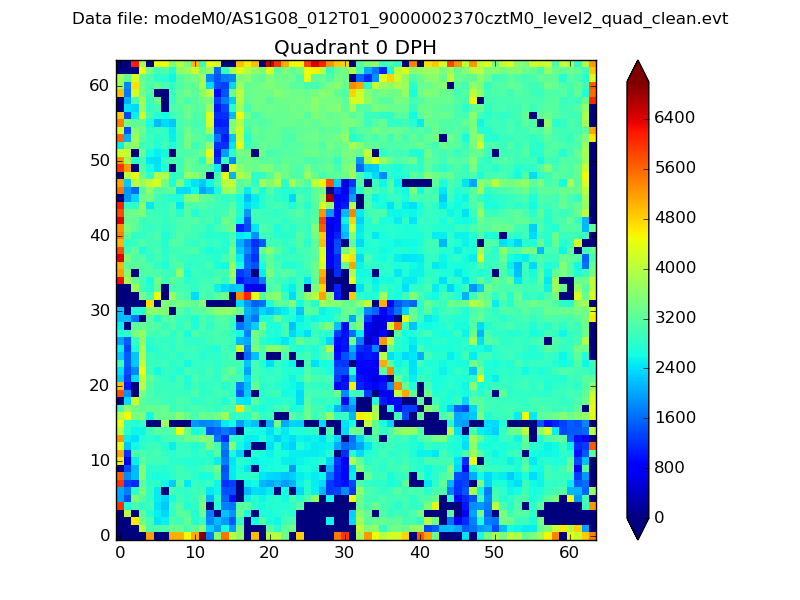 |
 |
Quadrant B |
|---|---|---|---|
| Quadrant D | 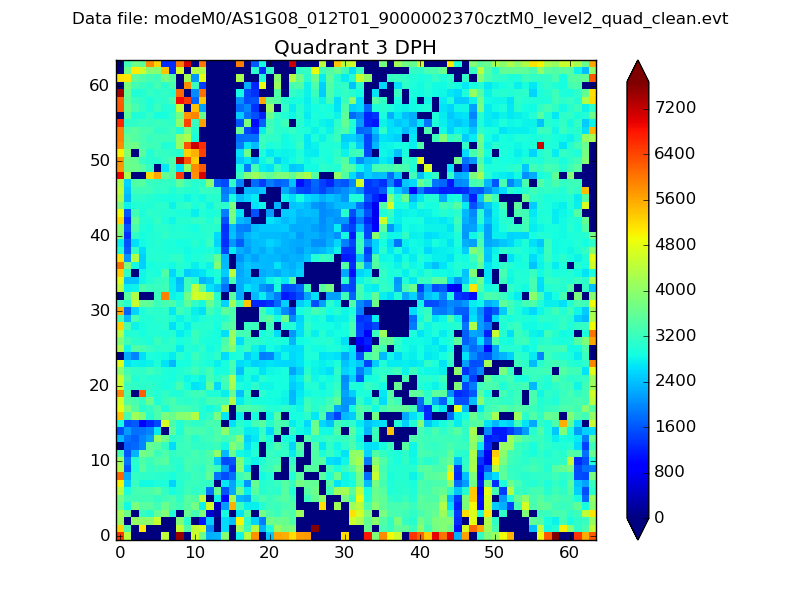 |
 |
Quadrant C |
| Plot type | Count rate plots | Images |
|---|---|---|
| Comparison with Poisson distribution Blue bars denote a histogram of data divided into 1 sec bins. Red curve is a Poisson curve with rate = median count rate of data. |
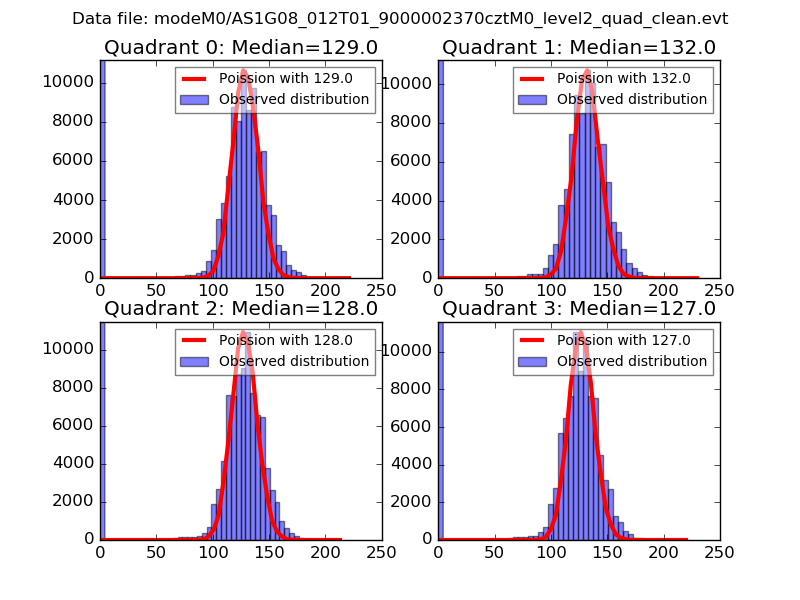 |
 |
| Quadrant-wise count rates Data is divided into 100 sec bins |
 |
|
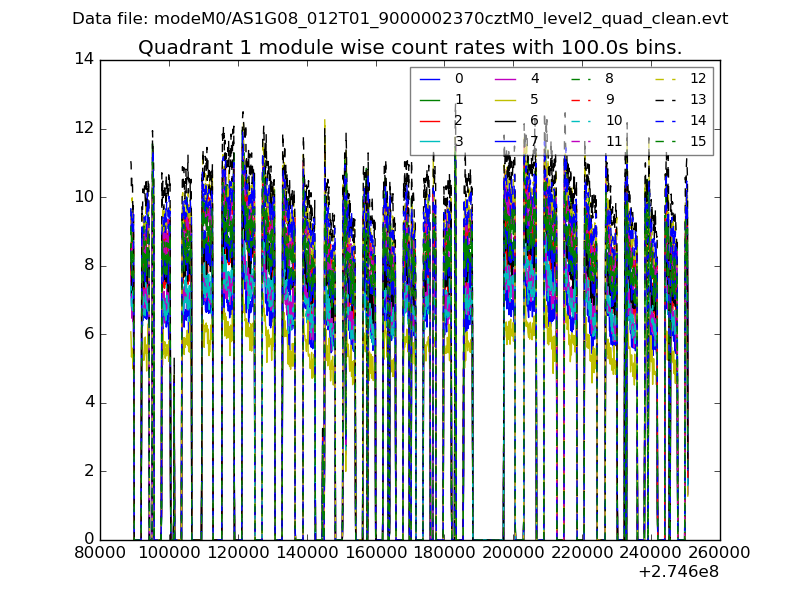
| Module-wise count rates for Quadrant A Data is divided into 100 sec bins |
 |
 |
| Module-wise count rates for Quadrant B Data is divided into 100 sec bins |
 |
 |
| Module-wise count rates for Quadrant C Data is divided into 100 sec bins |
 |
 |
| Module-wise count rates for Quadrant D Data is divided into 100 sec bins |
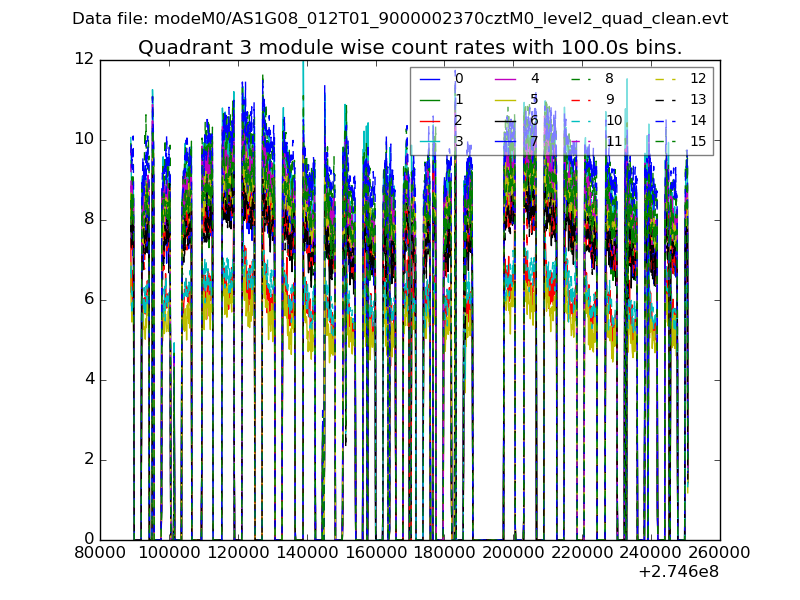 |
 |
| Parameter | Plot |
|---|---|
| CZT HV Monitor | 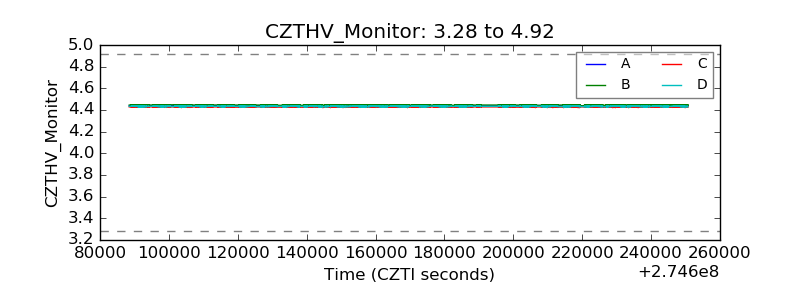 |
| D_VDD | 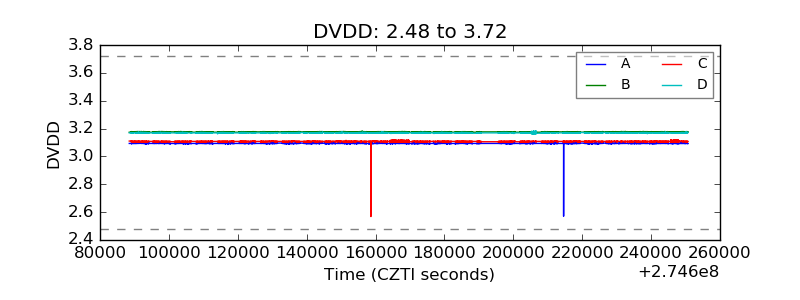 |
| Temperature 1 | 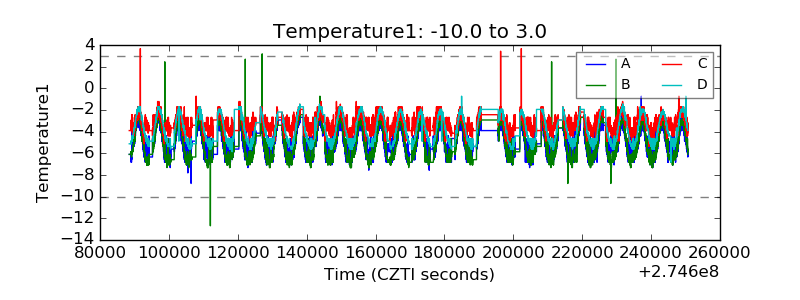 |
| Veto HV Monitor | 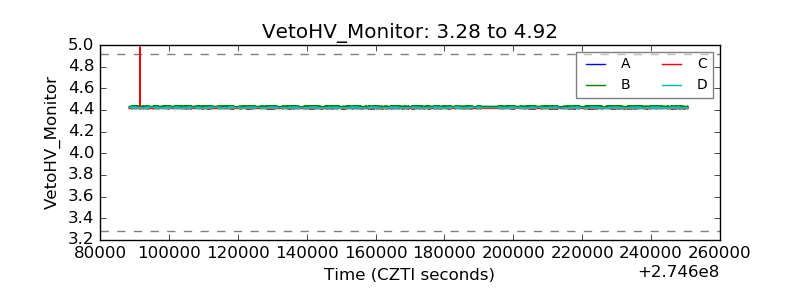 |
| Veto LLD | 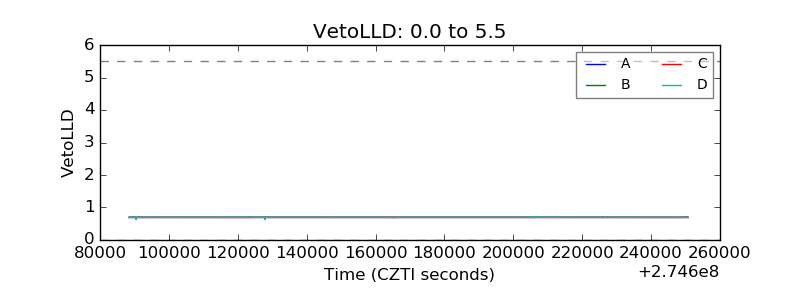 |
| Alpha Counter | 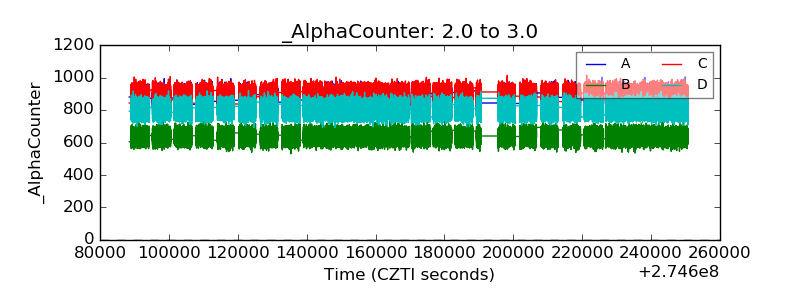 |
| _CPM_Rate | 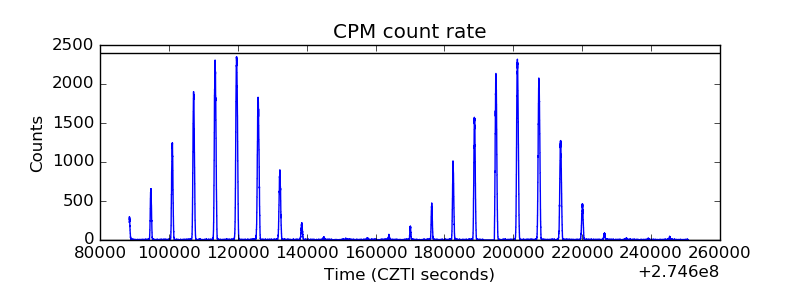 |
| CZT Counter |  |
| +2.5 Volts monitor |  |
| +5 Volts monitor |  |
| _ROLL_ROT |  |
| _Roll_DEC | 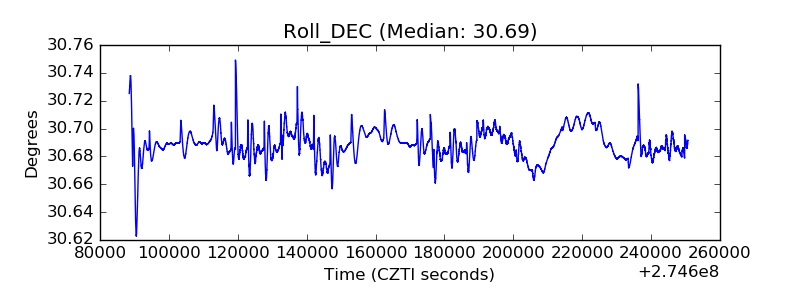 |
| _Roll_RA | 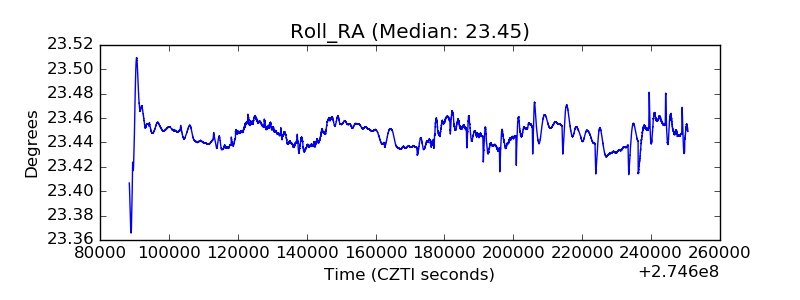 |
| Veto Counter |  |