| Param | Original file | Final file |
|---|---|---|
| Filename | modeM0/AS1G08_012T01_9000002370_16031cztM0_level2.evt | modeM0/AS1G08_012T01_9000002370_16031cztM0_level2_quad_clean.evt |
| Size (bytes) | 99,921,600 | 19,687,680 |
| Size | 95.3 MB | 18.8 MB |
| Events in quadrant A | 745,155 | 119,627 |
| Events in quadrant B | 740,863 | 122,095 |
| Events in quadrant C | 727,430 | 119,161 |
| Events in quadrant D | 703,011 | 118,913 |
| Mode M0 | |||
|---|---|---|---|
| Quadrant | BADHDUFLAG | Total packets | Discarded packets |
| A | 0 | 3213 | 2 |
| B | 0 | 3188 | 1 |
| C | 0 | 3178 | 1 |
| D | 0 | 3204 | 1 |
| Mode M9 | |||
|---|---|---|---|
| Quadrant | BADHDUFLAG | Total packets | Discarded packets |
| A | 0 | 5 | 0 |
| B | 0 | 5 | 0 |
| C | 0 | 5 | 0 |
| D | 0 | 5 | 0 |
| Mode SS | |||
|---|---|---|---|
| Quadrant | BADHDUFLAG | Total packets | Discarded packets |
| A | 0 | 32 | 0 |
| B | 0 | 32 | 0 |
| C | 0 | 32 | 0 |
| D | 0 | 32 | 0 |
| Quadrant | Total seconds | Saturated seconds | Saturation percentage |
|---|---|---|---|
| A | 1565 | 8 | 0.511182% |
| B | 1565 | 13 | 0.830671% |
| C | 1565 | 11 | 0.702875% |
| D | 1565 | 1 | 0.063898% |
Noise dominated data is calculated using 1-second bins in cleaned event files. If a bin has >2000 counts, and if more than 50% of those come from <1% of pixels, then it is considered to be noise-dominated and hence unusable.
| Quadrant | # 1 sec bins | Bins with >0 counts | Bins with >2000 counts | High rate bins dominated by noise | Noise dominated (total time) | Noise dominated (detector-on time) | Marked lightcurve |
|---|---|---|---|---|---|---|---|
| A | 1566 | 1566 | 2 | 2 | 0.13% | 0.13% | 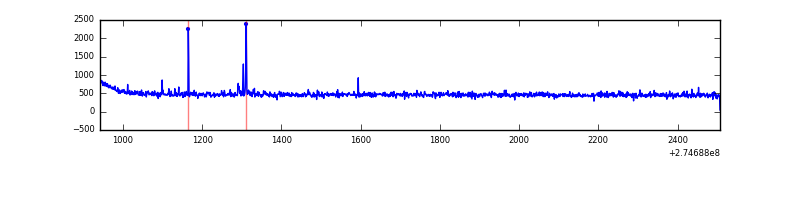 |
| B | 1566 | 1566 | 0 | 0 | 0.00% | 0.00% | 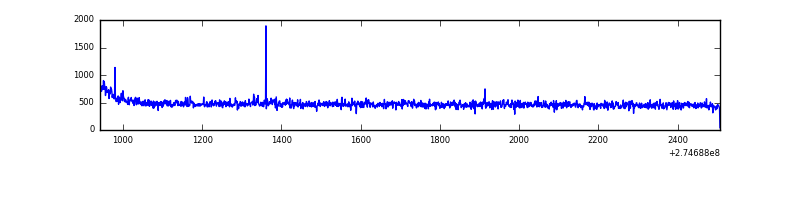 |
| C | 1566 | 1566 | 0 | 0 | 0.00% | 0.00% | 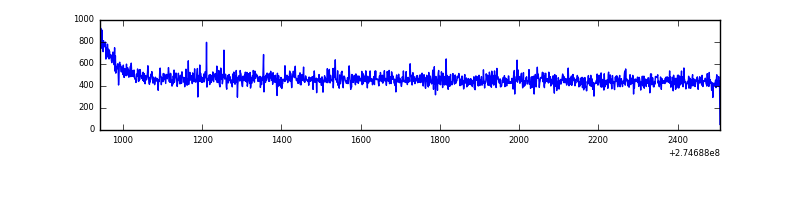 |
| D | 1566 | 1566 | 0 | 0 | 0.00% | 0.00% | 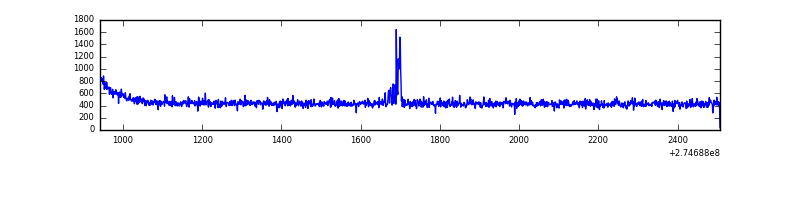 |
Top three noisy pixels from each quadrant. If the there are fewer than three noisy pixels in the level2.evt file, extra rows are filled as -1
| Pixel properties | Quadrant properties | ||||||
|---|---|---|---|---|---|---|---|
| Quadrant | DetID | PixID | Counts | Sigma | Mean | Median | Sigma |
| A | 9 | 143 | 13340 | 324.76 | 190 | 186 | 40.5 |
| A | 0 | 226 | 1738 | 38.32 | 190 | 186 | 40.5 |
| A | 12 | 194 | 1401 | 30.0 | 190 | 186 | 40.5 |
| B | 0 | 189 | 5675 | 141.33 | 188 | 184 | 38.9 |
| B | 12 | 111 | 4411 | 108.79 | 188 | 184 | 38.9 |
| B | 11 | 111 | 3676 | 89.88 | 188 | 184 | 38.9 |
| C | 14 | 238 | 27688 | 629.68 | 178 | 180 | 43.7 |
| C | 13 | 61 | 1239 | 24.24 | 178 | 180 | 43.7 |
| C | 3 | 233 | 1210 | 23.58 | 178 | 180 | 43.7 |
| D | 13 | 238 | 10549 | 224.1 | 183 | 176 | 46.3 |
| D | 2 | 234 | 4434 | 91.99 | 183 | 176 | 46.3 |
| D | 3 | 238 | 2235 | 44.48 | 183 | 176 | 46.3 |
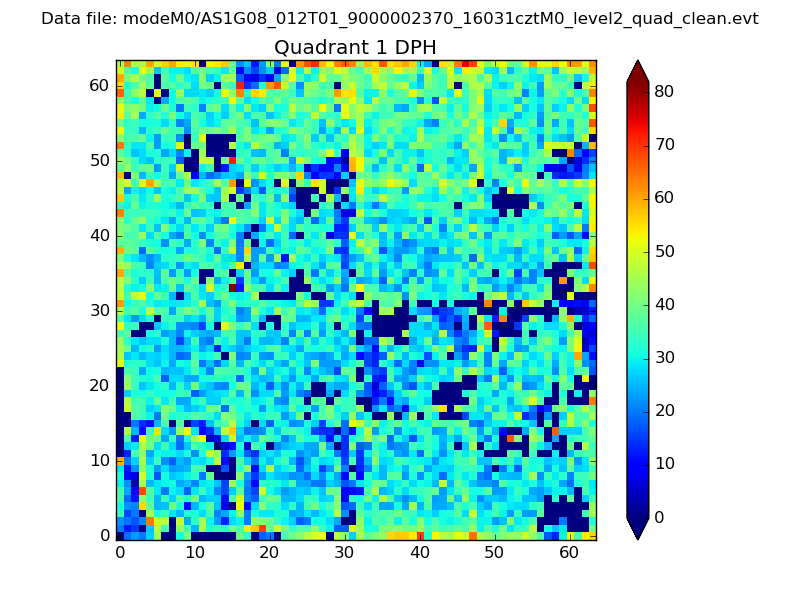
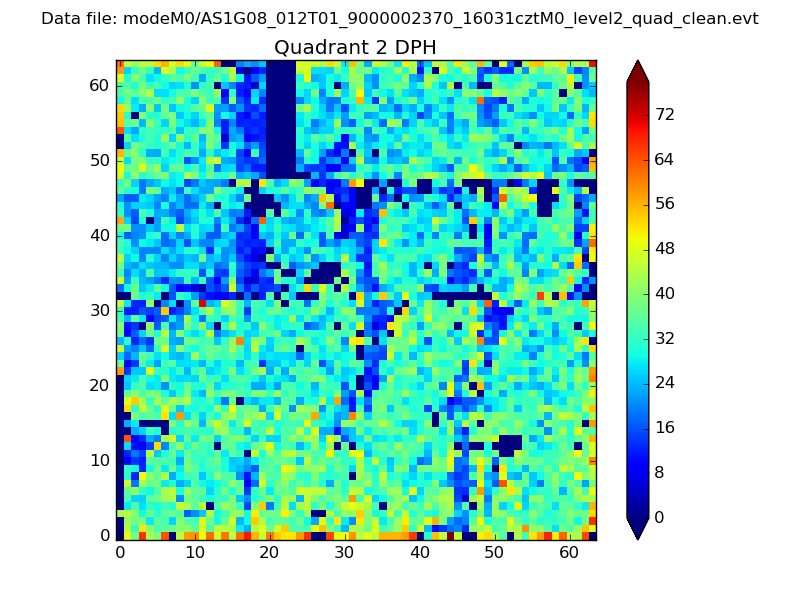
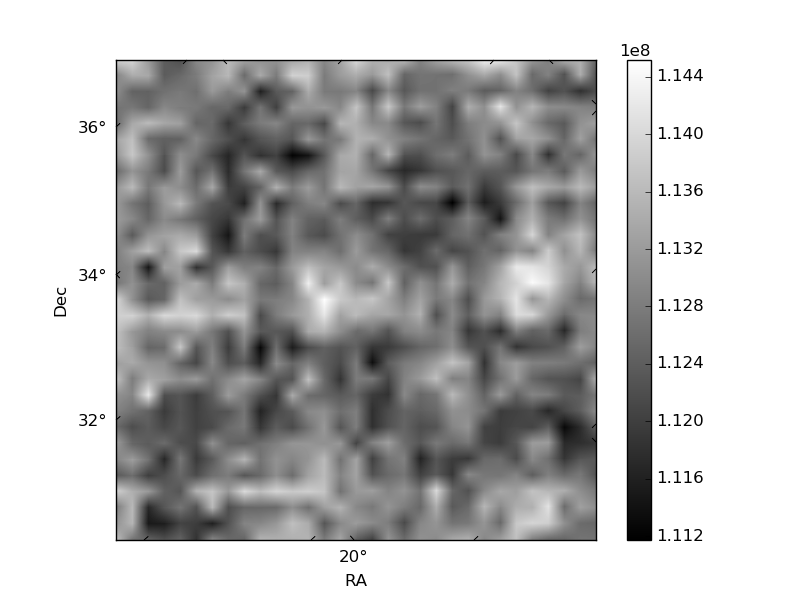
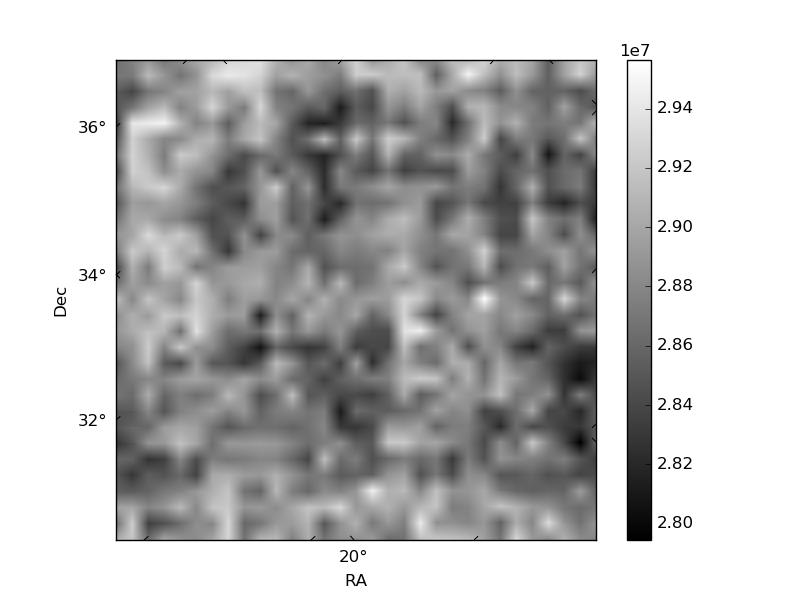
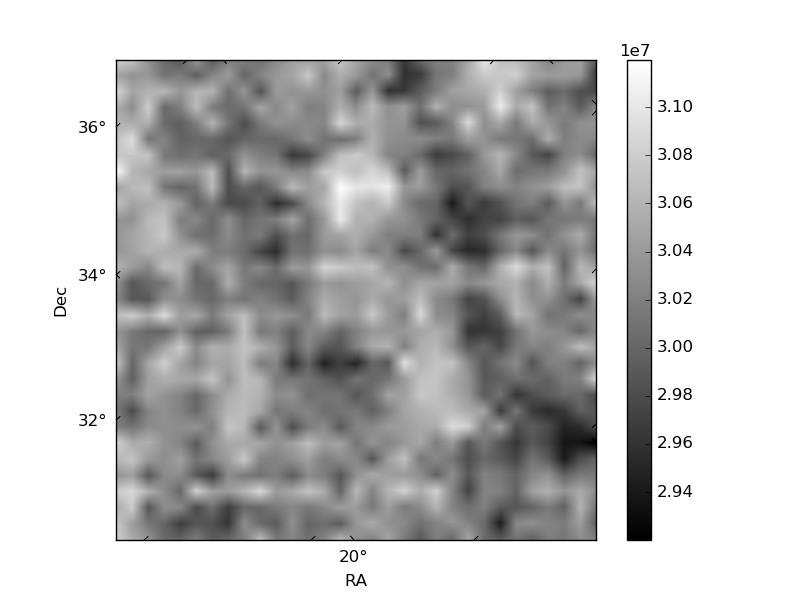
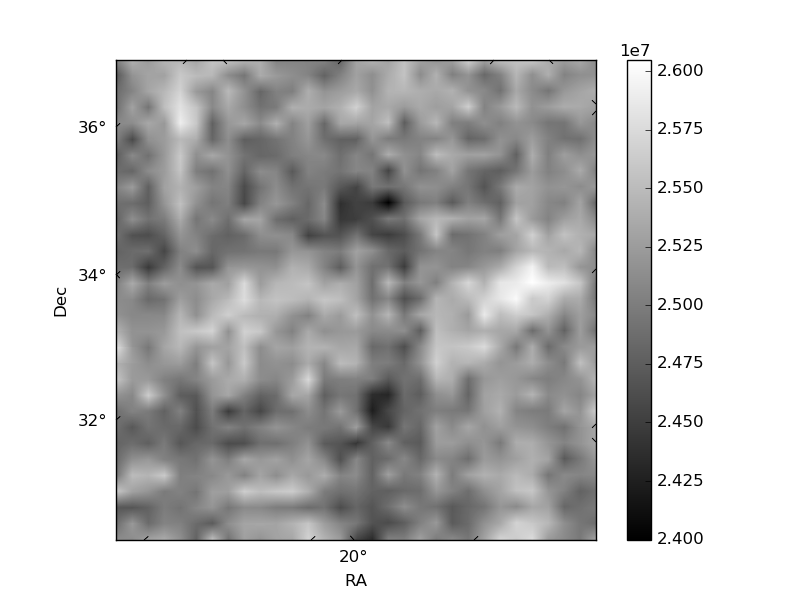
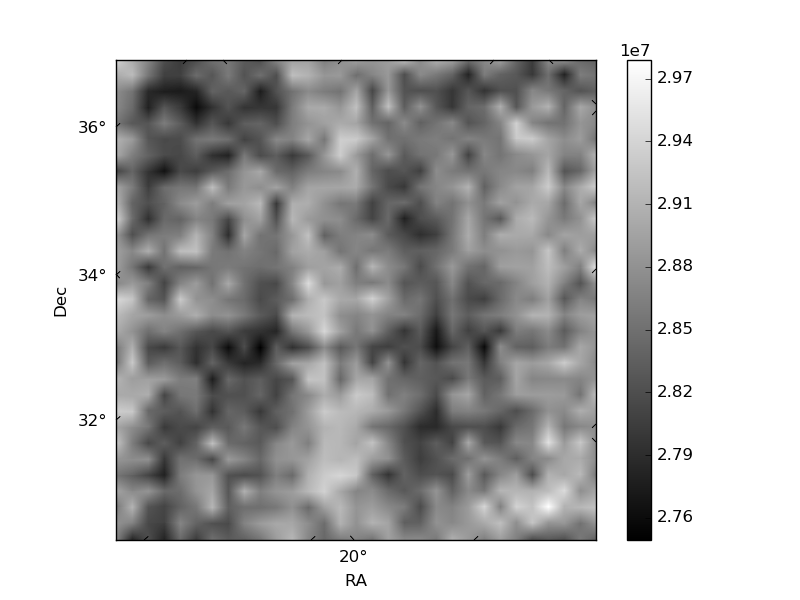
Histogram calculated using DETX and DETY for each event in the final _common_clean file
| Quadrant A |  |
 |
Quadrant B |
|---|---|---|---|
| Quadrant D | 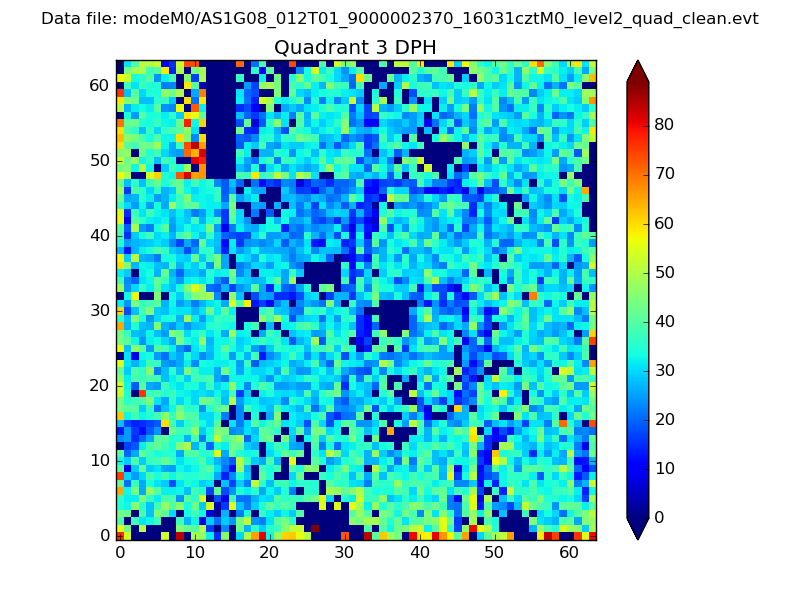 |
 |
Quadrant C |
| Plot type | Count rate plots | Images |
|---|---|---|
| Comparison with Poisson distribution Blue bars denote a histogram of data divided into 1 sec bins. Red curve is a Poisson curve with rate = median count rate of data. |
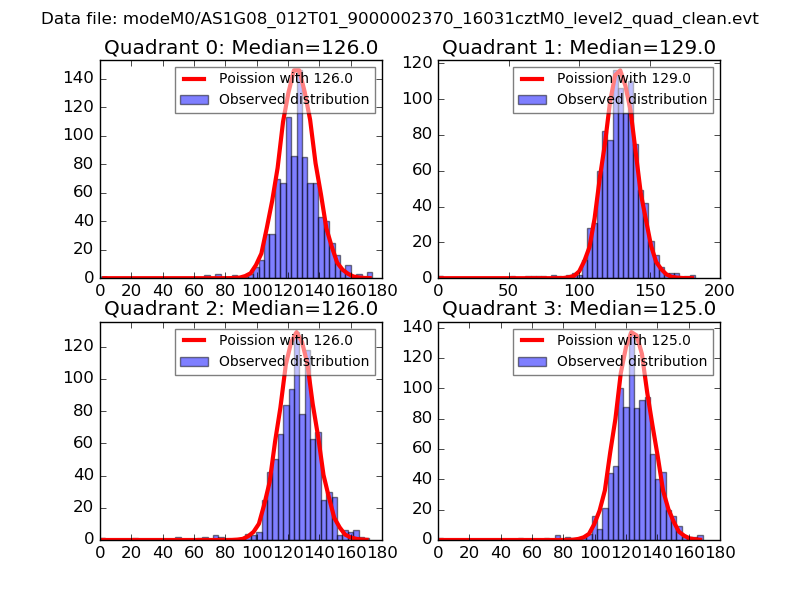 |
 |
| Quadrant-wise count rates Data is divided into 100 sec bins |
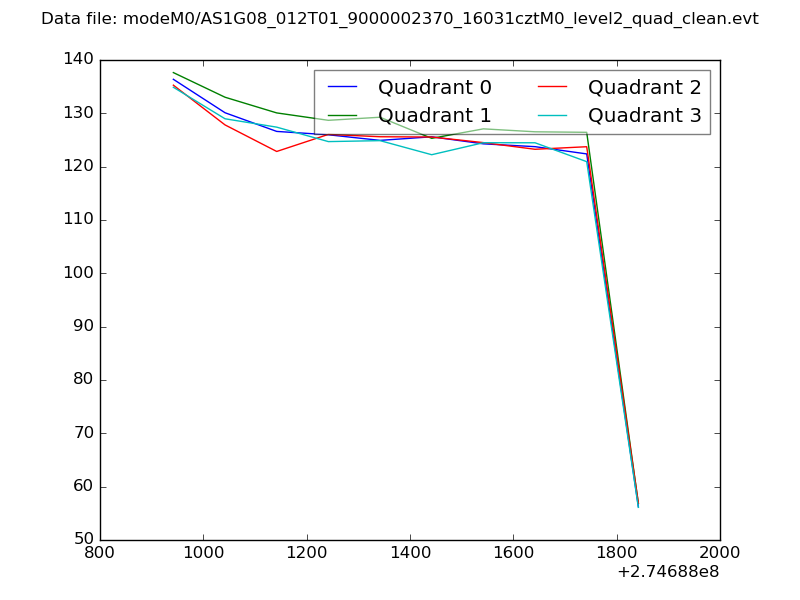 |
|
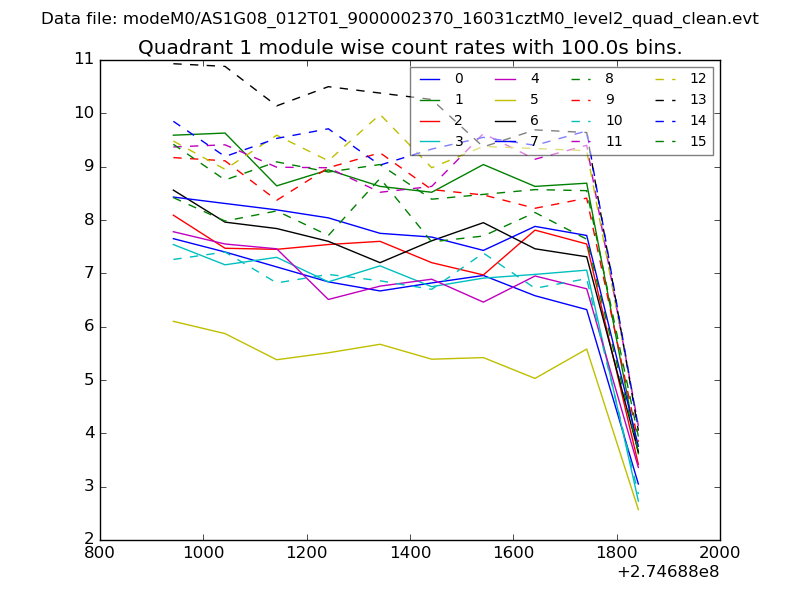
| Module-wise count rates for Quadrant A Data is divided into 100 sec bins |
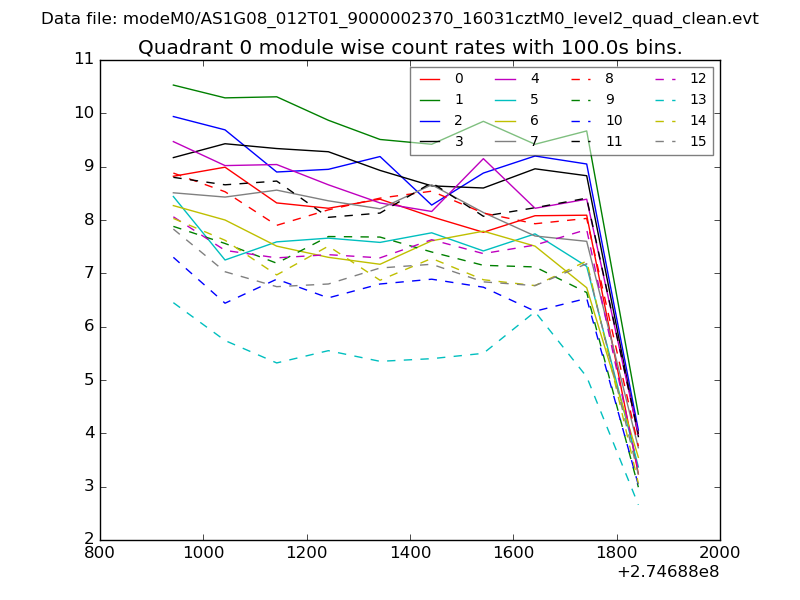 |
 |
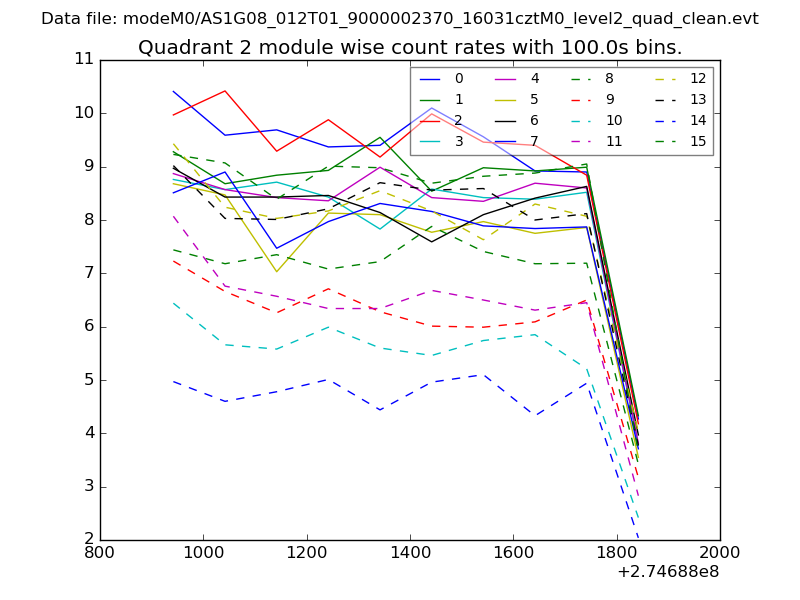
| Module-wise count rates for Quadrant B Data is divided into 100 sec bins |
 |
 |
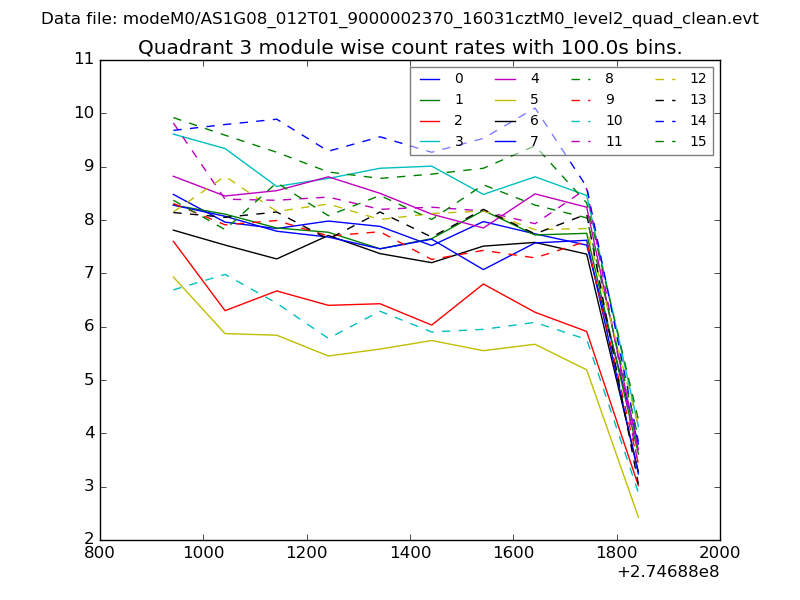
| Module-wise count rates for Quadrant C Data is divided into 100 sec bins |
 |
 |
| Module-wise count rates for Quadrant D Data is divided into 100 sec bins |
 |
 |
| Parameter | Plot |
|---|---|
| CZT HV Monitor | 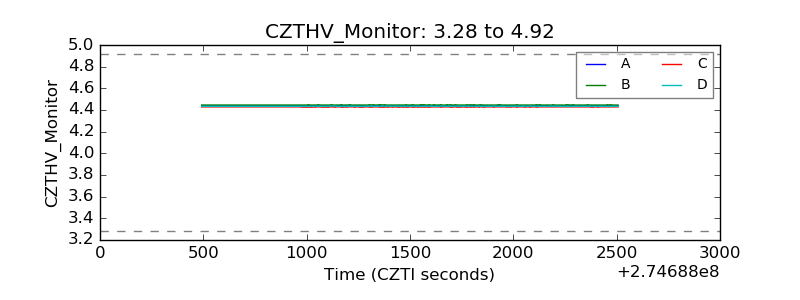 |
| D_VDD | 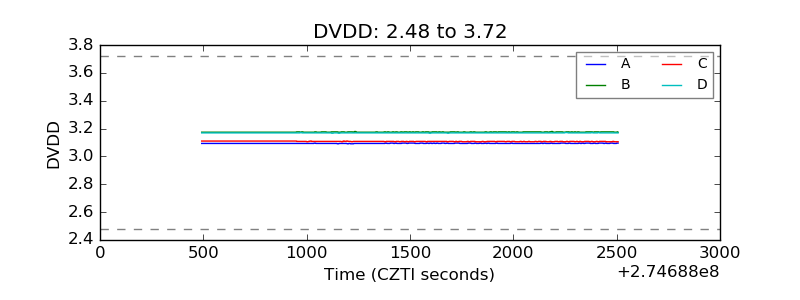 |
| Temperature 1 | 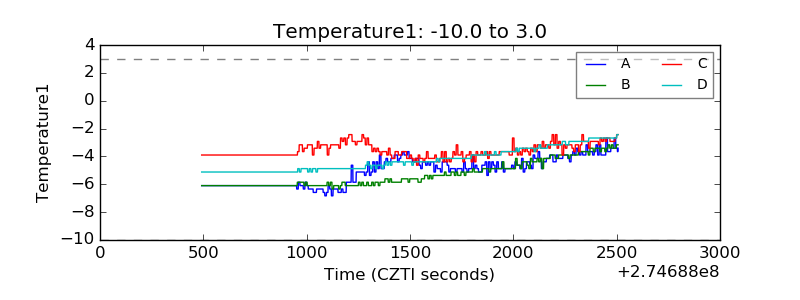 |
| Veto HV Monitor | 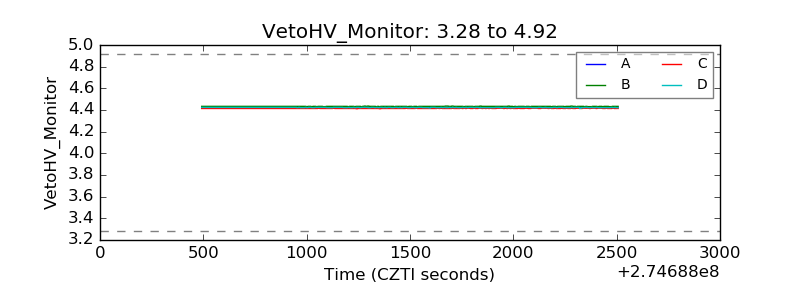 |
| Veto LLD | 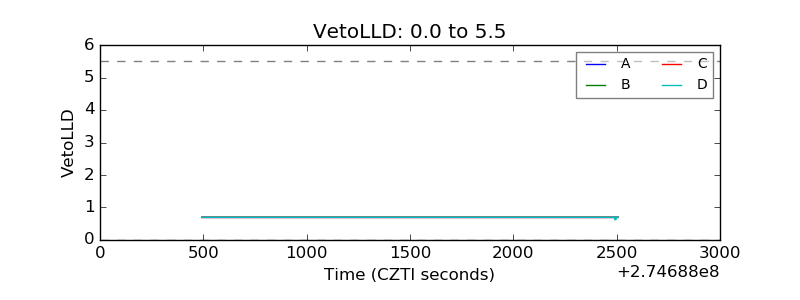 |
| Alpha Counter | 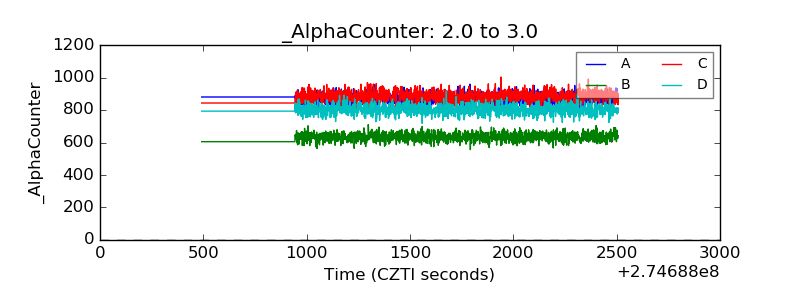 |
| _CPM_Rate | 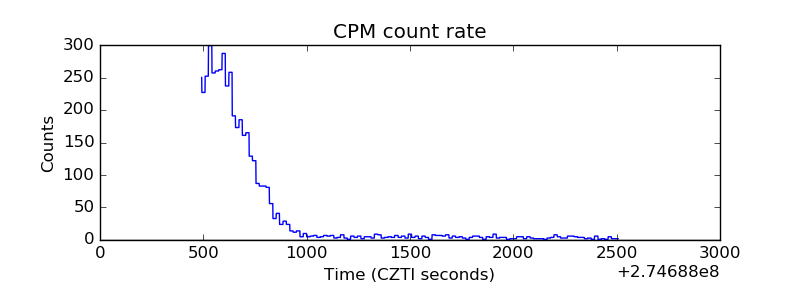 |
| CZT Counter | 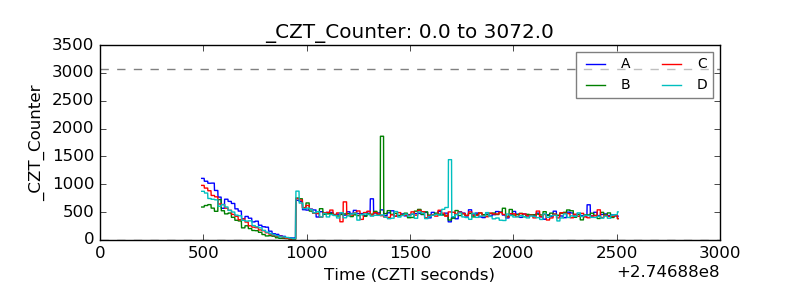 |
| +2.5 Volts monitor |  |
| +5 Volts monitor |  |
| _ROLL_ROT | 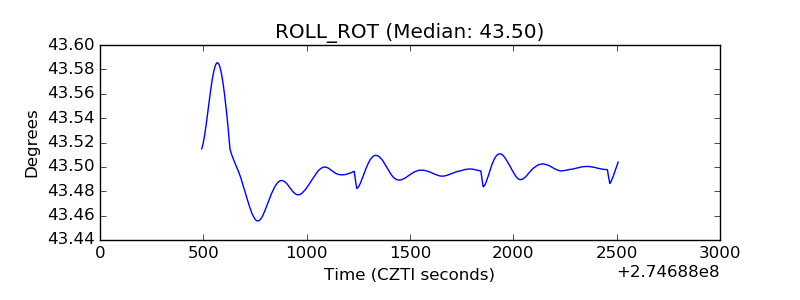 |
| _Roll_DEC | 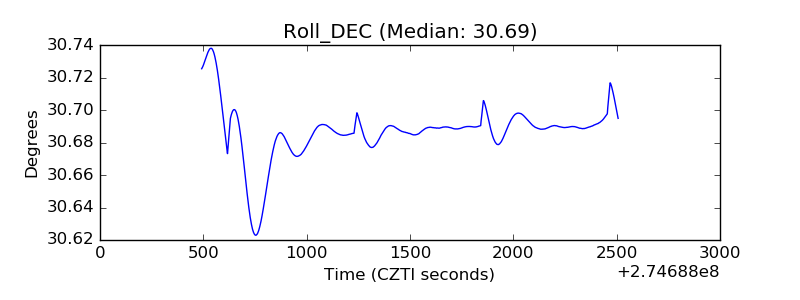 |
| _Roll_RA | 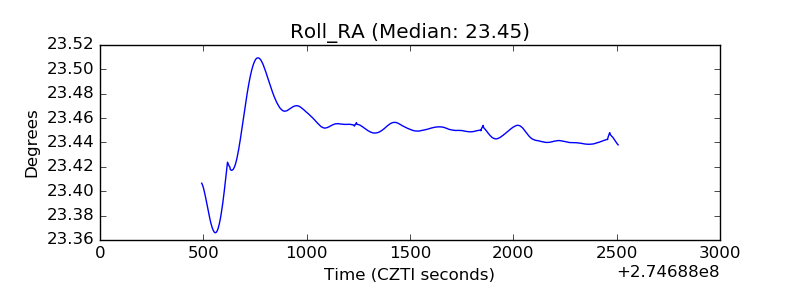 |
| Veto Counter | 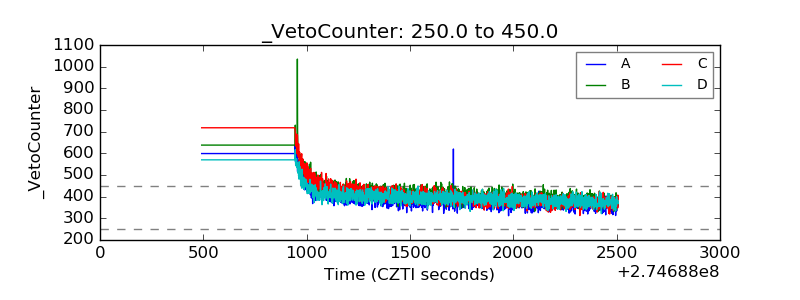 |