| Param | Original file | Final file |
|---|---|---|
| Filename | modeM0/AS1G08_012T01_9000002370_16033cztM0_level2.evt | modeM0/AS1G08_012T01_9000002370_16033cztM0_level2_quad_clean.evt |
| Size (bytes) | 445,625,280 | 68,371,200 |
| Size | 425.0 MB | 65.2 MB |
| Events in quadrant A | 3,241,297 | 406,489 |
| Events in quadrant B | 3,328,722 | 411,251 |
| Events in quadrant C | 3,312,848 | 397,688 |
| Events in quadrant D | 3,164,083 | 394,255 |
| Mode M0 | |||
|---|---|---|---|
| Quadrant | BADHDUFLAG | Total packets | Discarded packets |
| A | 0 | 13768 | 3 |
| B | 0 | 13820 | 2 |
| C | 0 | 13790 | 4 |
| D | 0 | 13798 | 2 |
| Mode M9 | |||
|---|---|---|---|
| Quadrant | BADHDUFLAG | Total packets | Discarded packets |
| A | 0 | 10 | 0 |
| B | 0 | 10 | 0 |
| C | 0 | 10 | 0 |
| D | 0 | 11 | 0 |
| Mode SS | |||
|---|---|---|---|
| Quadrant | BADHDUFLAG | Total packets | Discarded packets |
| A | 0 | 134 | 0 |
| B | 0 | 134 | 0 |
| C | 0 | 134 | 0 |
| D | 0 | 134 | 0 |
| Quadrant | Total seconds | Saturated seconds | Saturation percentage |
|---|---|---|---|
| A | 6604 | 81 | 1.226529% |
| B | 6604 | 85 | 1.287099% |
| C | 6603 | 97 | 1.469029% |
| D | 6604 | 74 | 1.120533% |
Noise dominated data is calculated using 1-second bins in cleaned event files. If a bin has >2000 counts, and if more than 50% of those come from <1% of pixels, then it is considered to be noise-dominated and hence unusable.
| Quadrant | # 1 sec bins | Bins with >0 counts | Bins with >2000 counts | High rate bins dominated by noise | Noise dominated (total time) | Noise dominated (detector-on time) | Marked lightcurve |
|---|---|---|---|---|---|---|---|
| A | 7630 | 6605 | 0 | 0 | 0.00% | 0.00% | 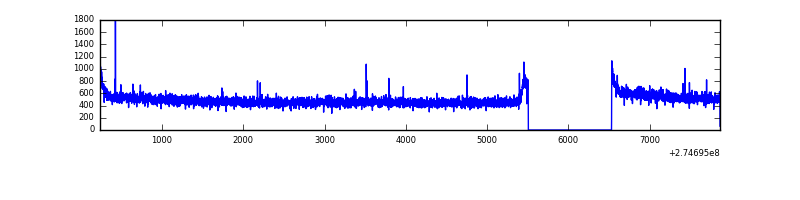 |
| B | 7630 | 6605 | 1 | 1 | 0.01% | 0.02% |  |
| C | 7630 | 6605 | 0 | 0 | 0.00% | 0.00% | 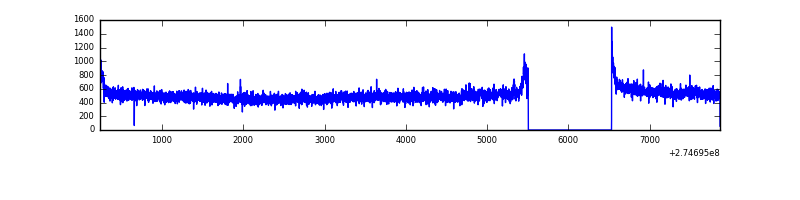 |
| D | 7630 | 6605 | 15 | 15 | 0.20% | 0.23% | 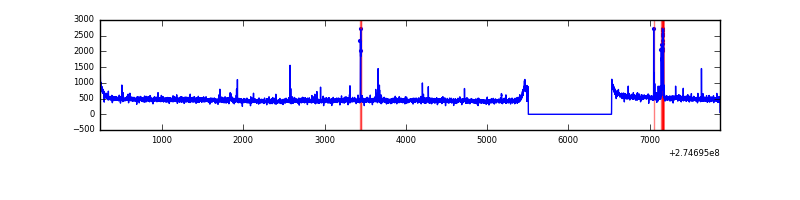 |
Top three noisy pixels from each quadrant. If the there are fewer than three noisy pixels in the level2.evt file, extra rows are filled as -1
| Pixel properties | Quadrant properties | ||||||
|---|---|---|---|---|---|---|---|
| Quadrant | DetID | PixID | Counts | Sigma | Mean | Median | Sigma |
| A | 9 | 143 | 11779 | 64.89 | 837 | 821 | 168.9 |
| A | 0 | 226 | 7336 | 38.58 | 837 | 821 | 168.9 |
| A | 15 | 223 | 6278 | 32.32 | 837 | 821 | 168.9 |
| B | 0 | 230 | 24888 | 151.19 | 830 | 812 | 159.2 |
| B | 15 | 222 | 22708 | 137.5 | 830 | 812 | 159.2 |
| B | 12 | 111 | 19160 | 115.22 | 830 | 812 | 159.2 |
| C | 14 | 238 | 121884 | 658.09 | 794 | 800 | 184.0 |
| C | 3 | 233 | 89009 | 479.41 | 794 | 800 | 184.0 |
| C | 13 | 61 | 5673 | 26.48 | 794 | 800 | 184.0 |
| D | 2 | 33 | 47571 | 232.38 | 815 | 790 | 201.3 |
| D | 2 | 234 | 20660 | 98.7 | 815 | 790 | 201.3 |
| D | 13 | 172 | 20647 | 98.64 | 815 | 790 | 201.3 |
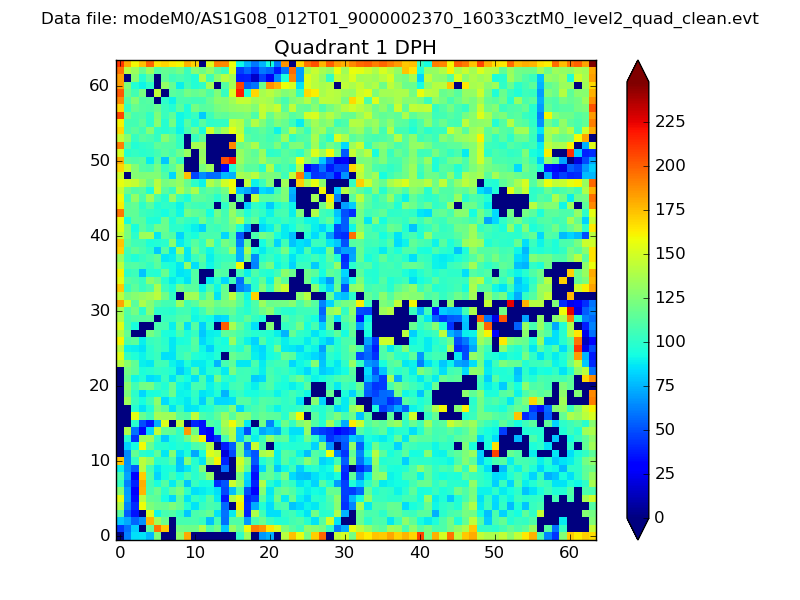
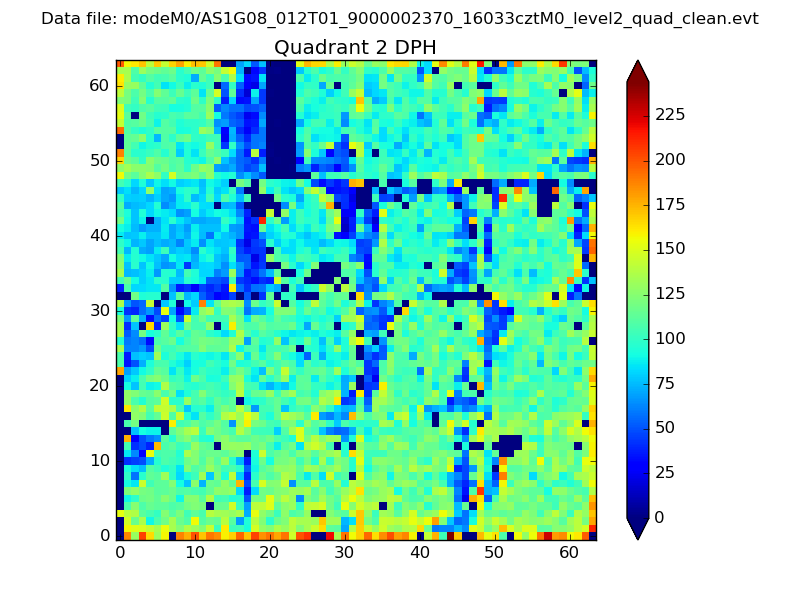
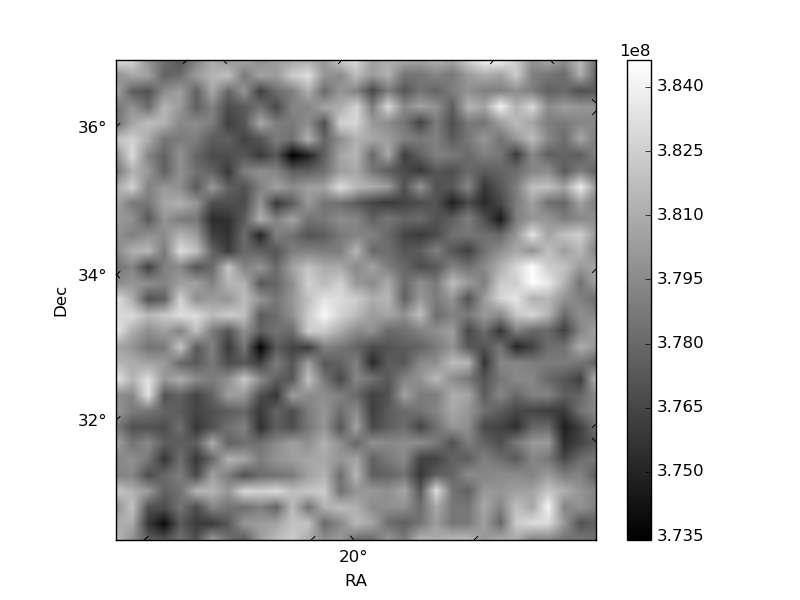
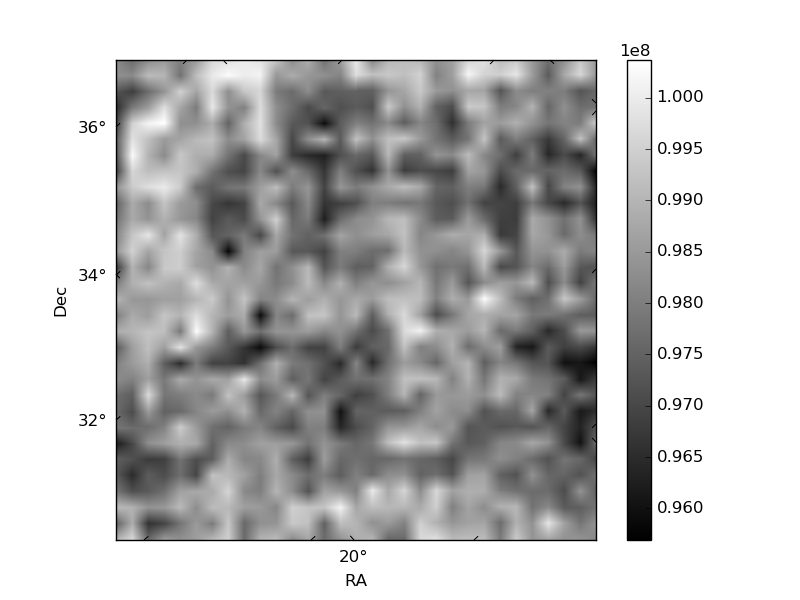
Histogram calculated using DETX and DETY for each event in the final _common_clean file
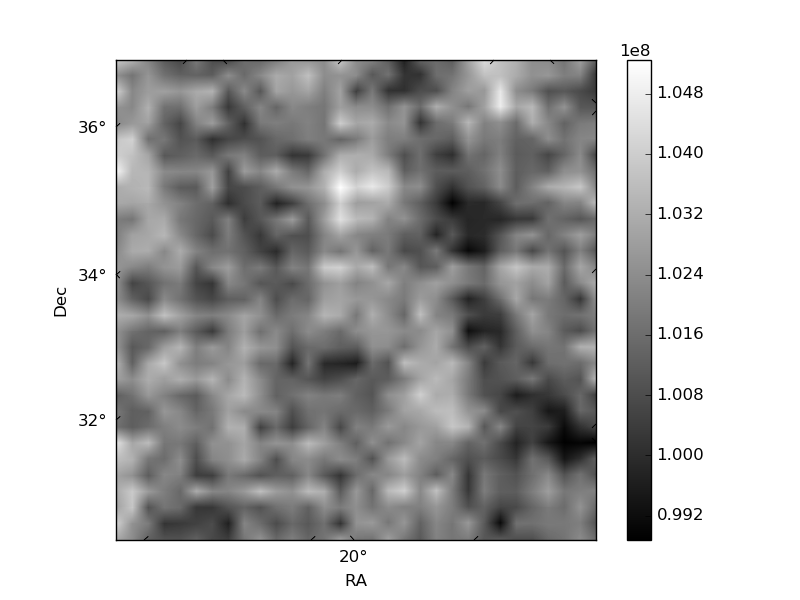
| Quadrant A | 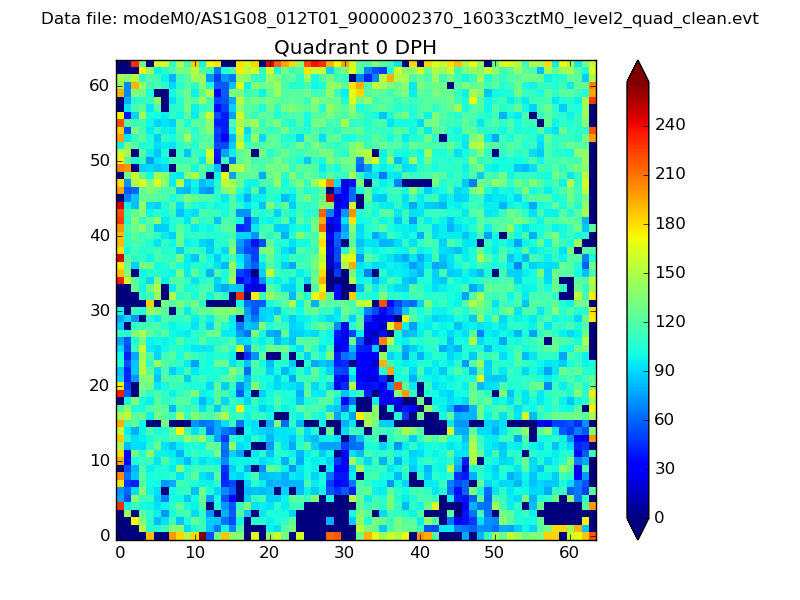 |
 |
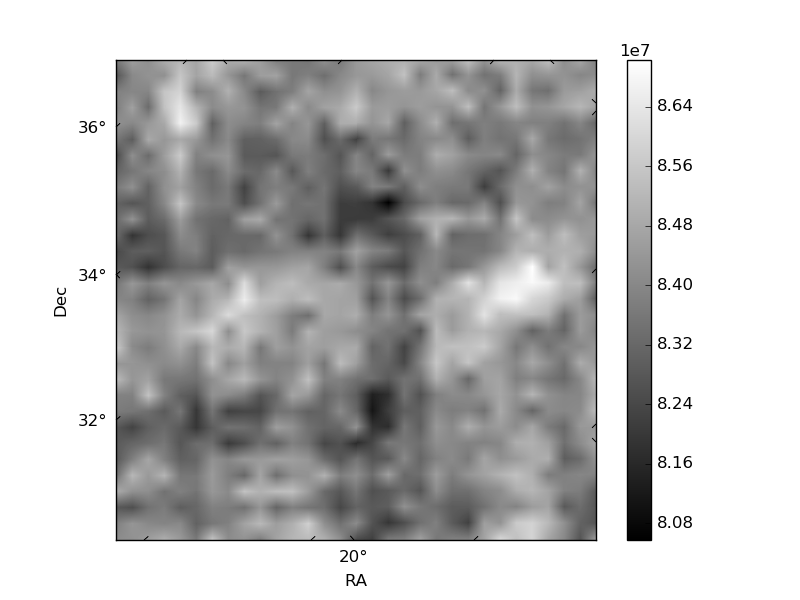
Quadrant B |
|---|---|---|---|
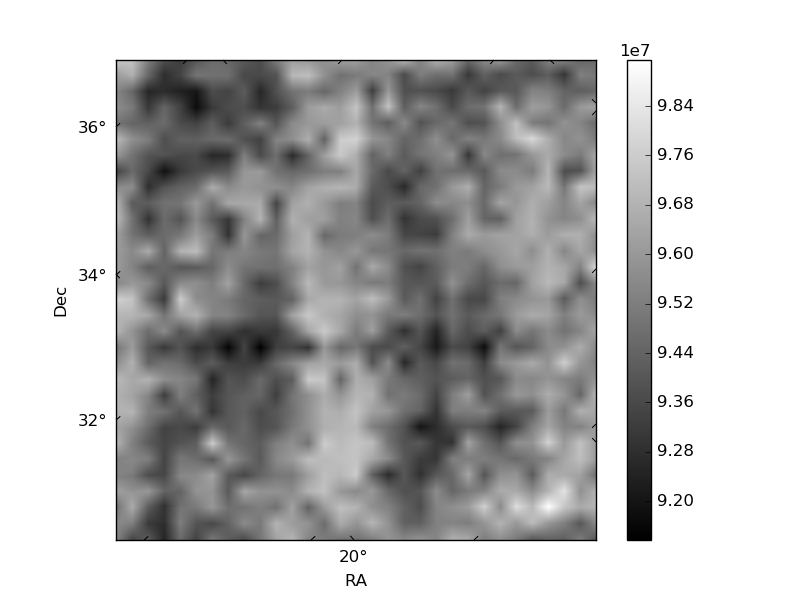
| Quadrant D | 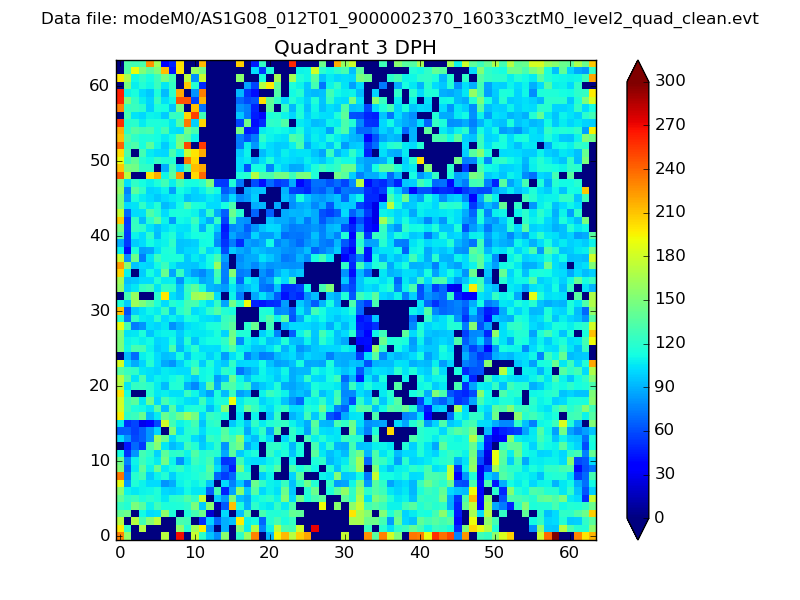 |
 |
Quadrant C |
| Plot type | Count rate plots | Images |
|---|---|---|
| Comparison with Poisson distribution Blue bars denote a histogram of data divided into 1 sec bins. Red curve is a Poisson curve with rate = median count rate of data. |
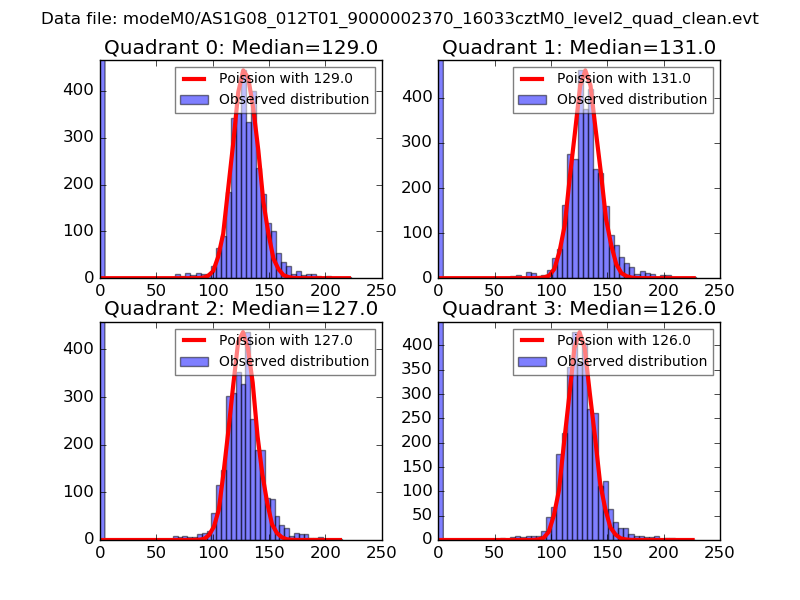 |
 |
| Quadrant-wise count rates Data is divided into 100 sec bins |
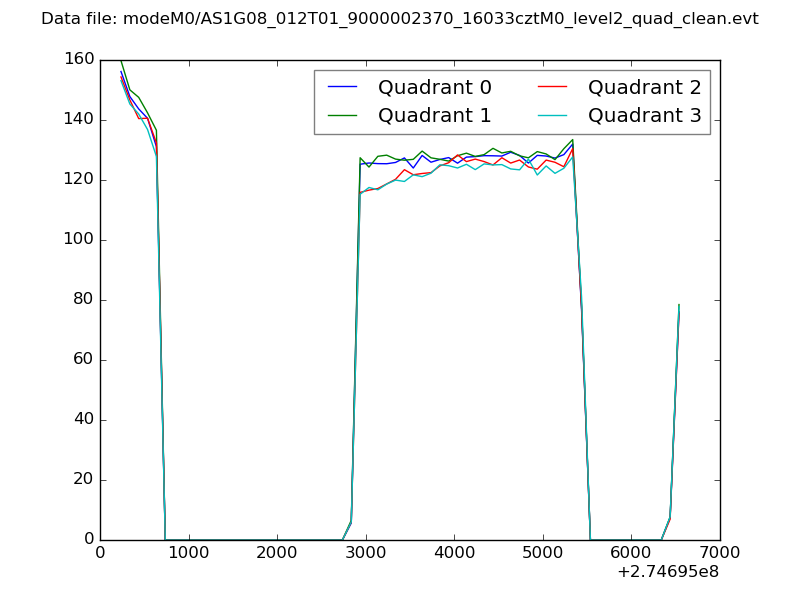 |
|
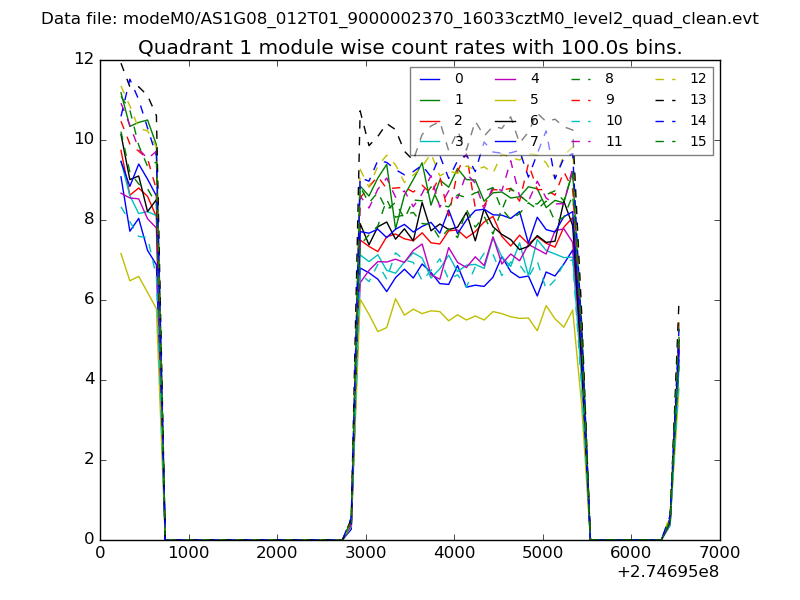
| Module-wise count rates for Quadrant A Data is divided into 100 sec bins |
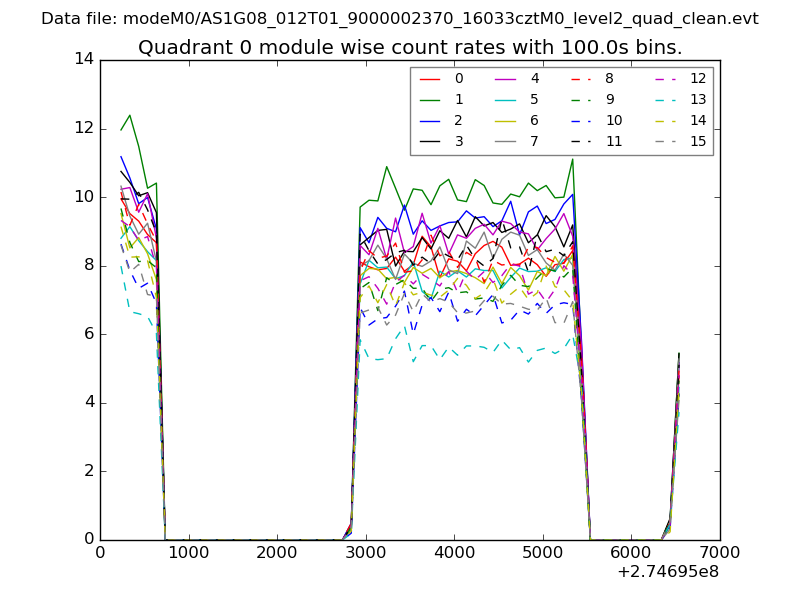 |
 |
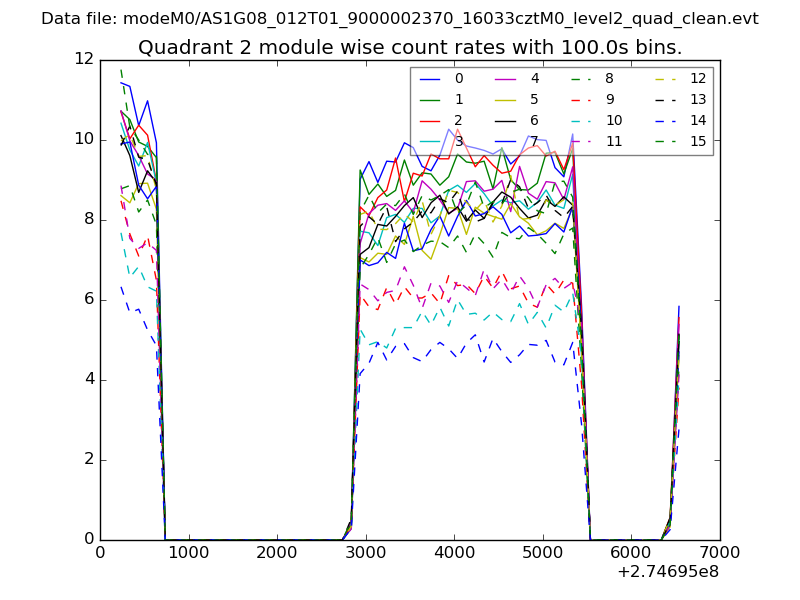
| Module-wise count rates for Quadrant B Data is divided into 100 sec bins |
 |
 |
| Module-wise count rates for Quadrant C Data is divided into 100 sec bins |
 |
 |
| Module-wise count rates for Quadrant D Data is divided into 100 sec bins |
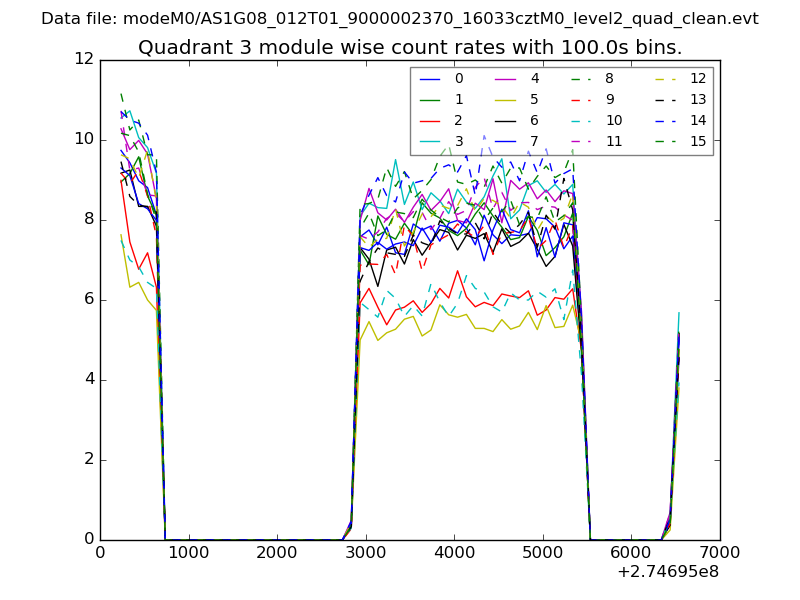 |
 |
| Parameter | Plot |
|---|---|
| CZT HV Monitor | 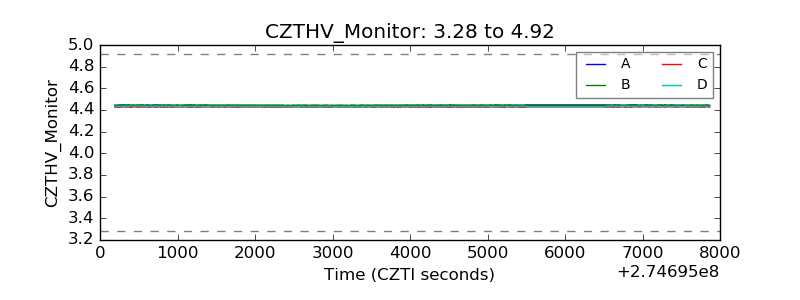 |
| D_VDD | 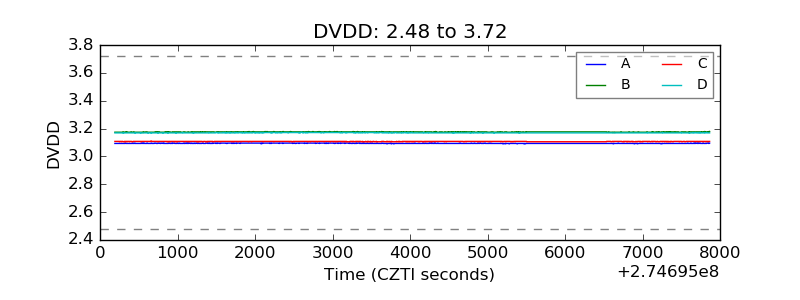 |
| Temperature 1 | 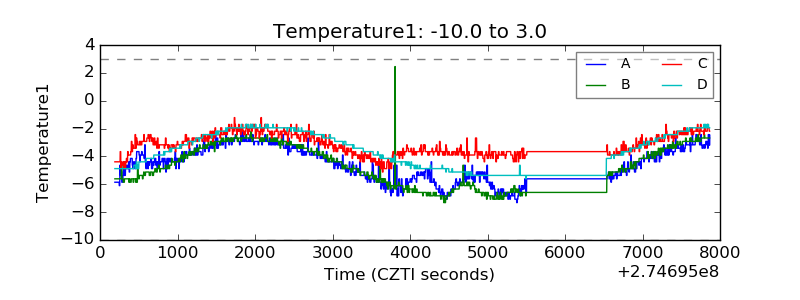 |
| Veto HV Monitor | 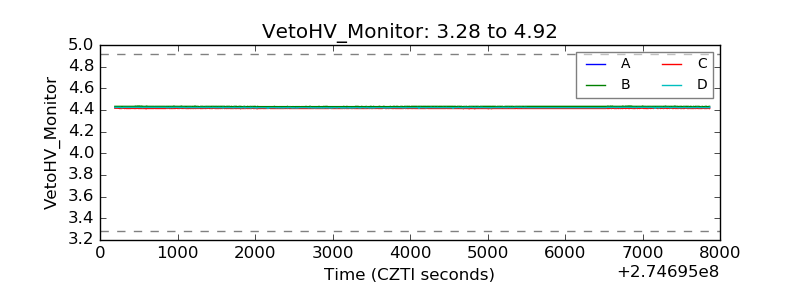 |
| Veto LLD | 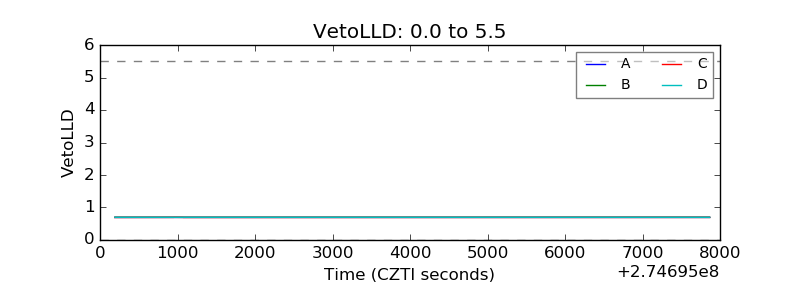 |
| Alpha Counter | 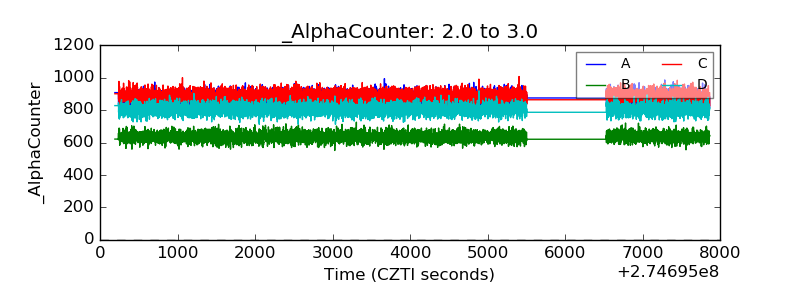 |
| _CPM_Rate | 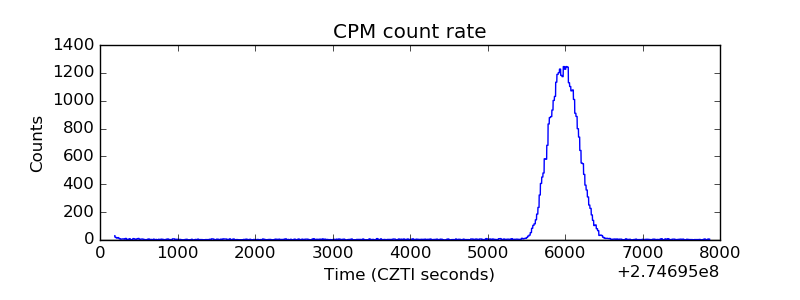 |
| CZT Counter | 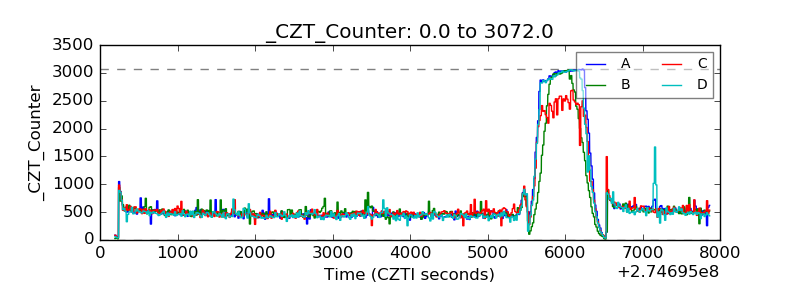 |
| +2.5 Volts monitor |  |
| +5 Volts monitor |  |
| _ROLL_ROT | 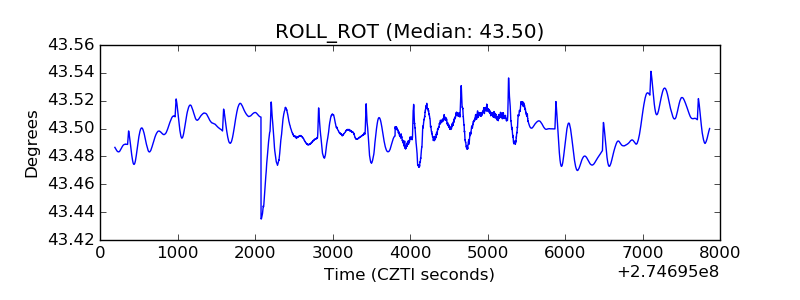 |
| _Roll_DEC | 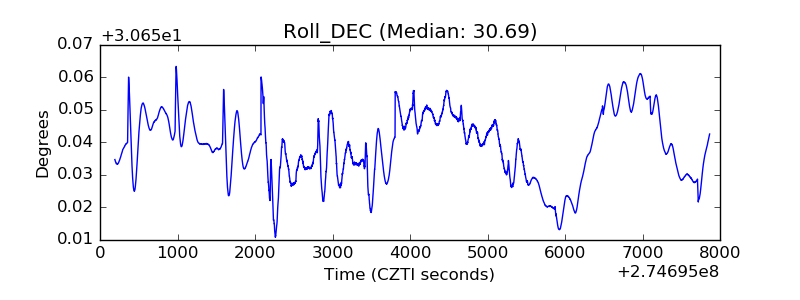 |
| _Roll_RA | 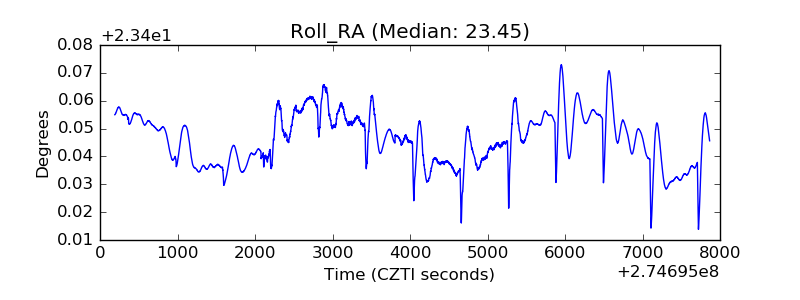 |
| Veto Counter | 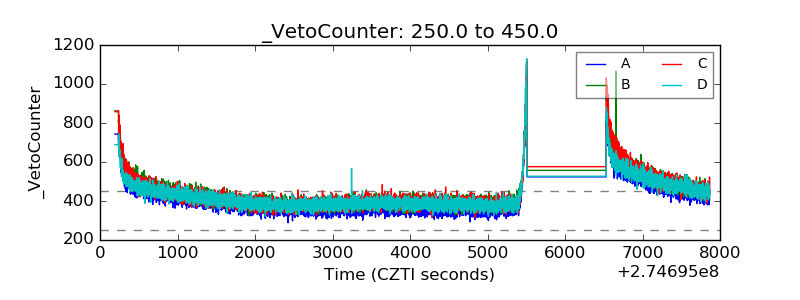 |