| Param | Original file | Final file |
|---|---|---|
| Filename | modeM0/AS1G08_012T01_9000002370_16035cztM0_level2.evt | modeM0/AS1G08_012T01_9000002370_16035cztM0_level2_quad_clean.evt |
| Size (bytes) | 466,286,400 | 64,990,080 |
| Size | 444.7 MB | 62.0 MB |
| Events in quadrant A | 3,339,473 | 383,356 |
| Events in quadrant B | 3,413,182 | 388,356 |
| Events in quadrant C | 3,482,067 | 371,405 |
| Events in quadrant D | 3,444,964 | 370,817 |
| Mode M0 | |||
|---|---|---|---|
| Quadrant | BADHDUFLAG | Total packets | Discarded packets |
| A | 0 | 14068 | 3 |
| B | 0 | 14239 | 2 |
| C | 0 | 14131 | 2 |
| D | 0 | 14504 | 2 |
| Mode M9 | |||
|---|---|---|---|
| Quadrant | BADHDUFLAG | Total packets | Discarded packets |
| A | 0 | 17 | 0 |
| B | 0 | 17 | 0 |
| C | 0 | 17 | 0 |
| D | 0 | 18 | 0 |
| Mode SS | |||
|---|---|---|---|
| Quadrant | BADHDUFLAG | Total packets | Discarded packets |
| A | 0 | 132 | 0 |
| B | 0 | 132 | 0 |
| C | 0 | 132 | 0 |
| D | 0 | 132 | 0 |
| Quadrant | Total seconds | Saturated seconds | Saturation percentage |
|---|---|---|---|
| A | 6507 | 82 | 1.260181% |
| B | 6507 | 85 | 1.306286% |
| C | 6507 | 97 | 1.490702% |
| D | 6507 | 78 | 1.198709% |
Noise dominated data is calculated using 1-second bins in cleaned event files. If a bin has >2000 counts, and if more than 50% of those come from <1% of pixels, then it is considered to be noise-dominated and hence unusable.
| Quadrant | # 1 sec bins | Bins with >0 counts | Bins with >2000 counts | High rate bins dominated by noise | Noise dominated (total time) | Noise dominated (detector-on time) | Marked lightcurve |
|---|---|---|---|---|---|---|---|
| A | 7668 | 6508 | 0 | 0 | 0.00% | 0.00% | 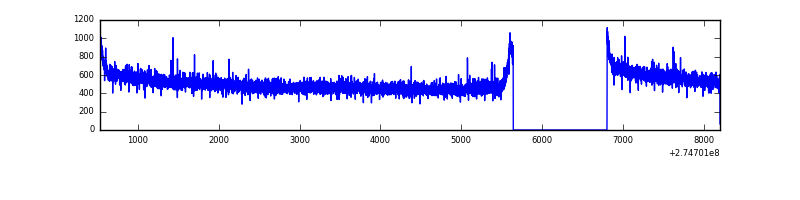 |
| B | 7668 | 6508 | 0 | 0 | 0.00% | 0.00% | 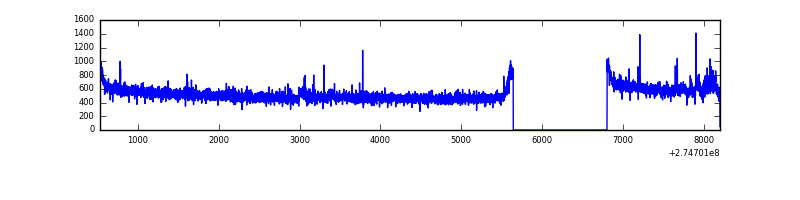 |
| C | 7668 | 6508 | 0 | 0 | 0.00% | 0.00% | 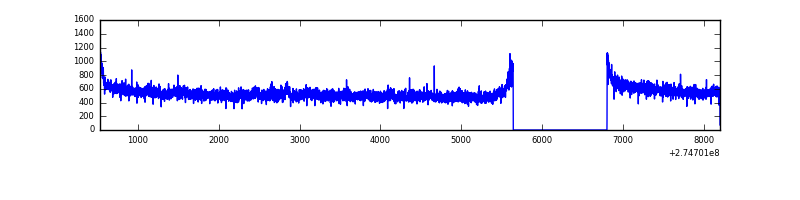 |
| D | 7668 | 6508 | 25 | 25 | 0.33% | 0.38% | 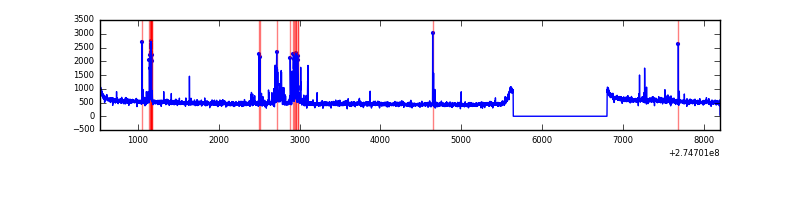 |
Top three noisy pixels from each quadrant. If the there are fewer than three noisy pixels in the level2.evt file, extra rows are filled as -1
| Pixel properties | Quadrant properties | ||||||
|---|---|---|---|---|---|---|---|
| Quadrant | DetID | PixID | Counts | Sigma | Mean | Median | Sigma |
| A | 9 | 143 | 11393 | 61.12 | 864 | 849 | 172.5 |
| A | 0 | 226 | 7571 | 38.96 | 864 | 849 | 172.5 |
| A | 12 | 194 | 6305 | 31.63 | 864 | 849 | 172.5 |
| B | 0 | 230 | 33432 | 200.04 | 855 | 835 | 163.0 |
| B | 0 | 229 | 26322 | 156.41 | 855 | 835 | 163.0 |
| B | 12 | 111 | 18835 | 110.46 | 855 | 835 | 163.0 |
| C | 3 | 233 | 153474 | 805.96 | 820 | 826 | 189.4 |
| C | 14 | 238 | 127259 | 667.55 | 820 | 826 | 189.4 |
| C | 13 | 61 | 5869 | 26.63 | 820 | 826 | 189.4 |
| D | 13 | 172 | 172287 | 844.18 | 841 | 818 | 203.1 |
| D | 2 | 33 | 47579 | 230.22 | 841 | 818 | 203.1 |
| D | 2 | 234 | 21147 | 100.08 | 841 | 818 | 203.1 |
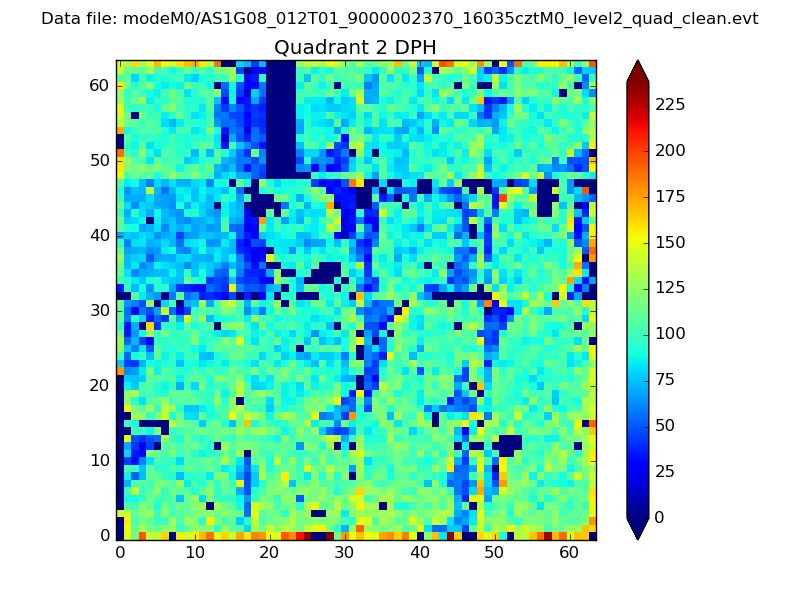
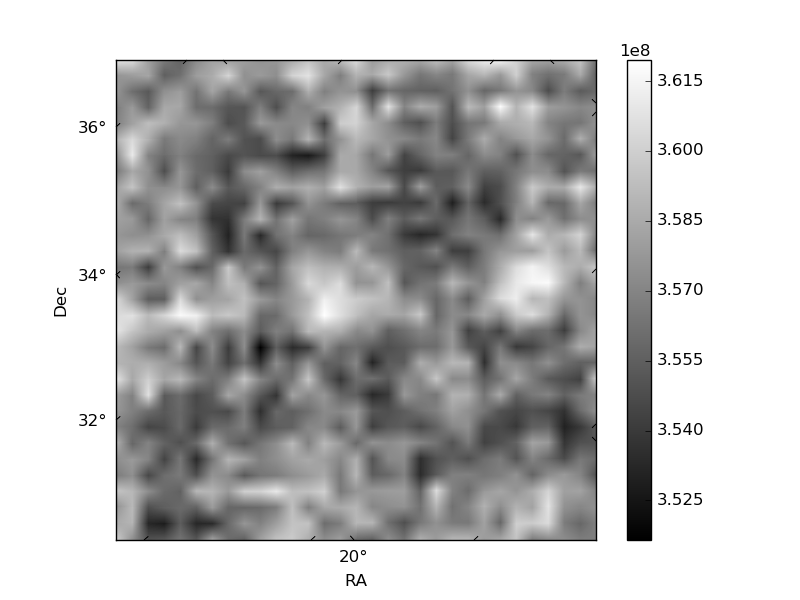
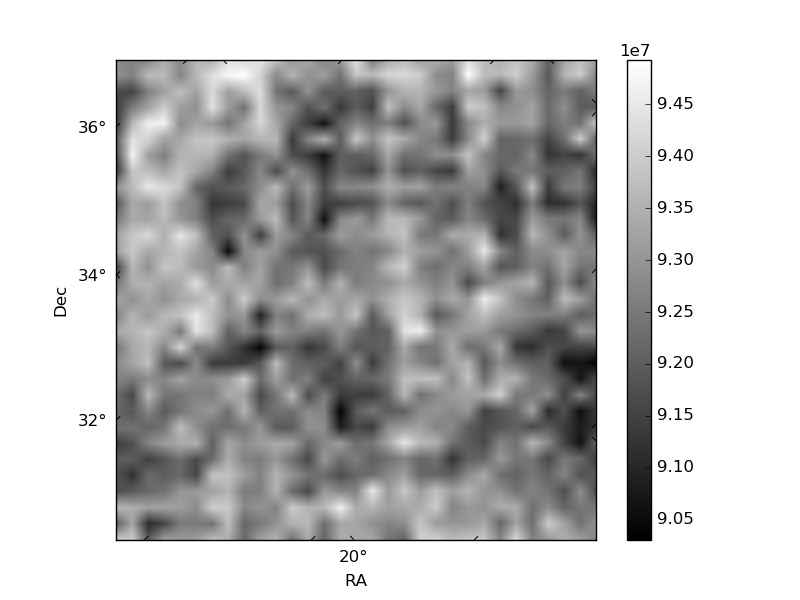
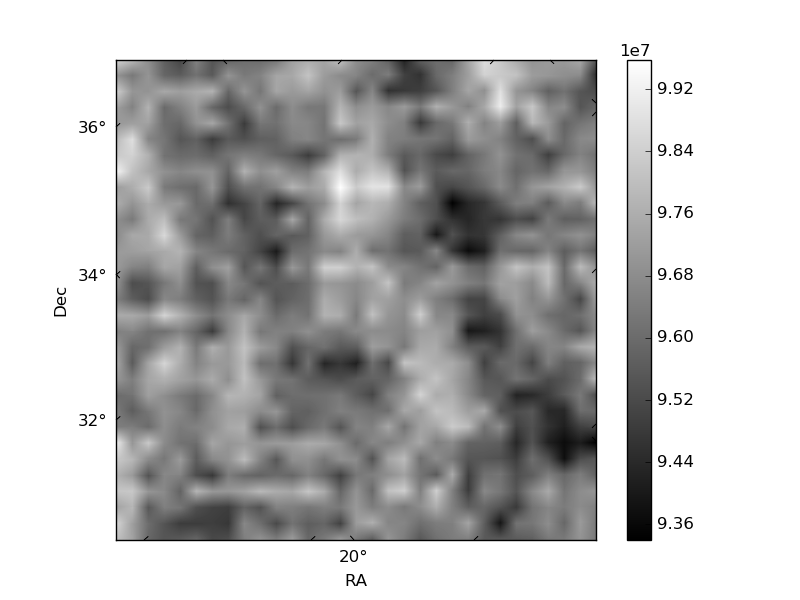
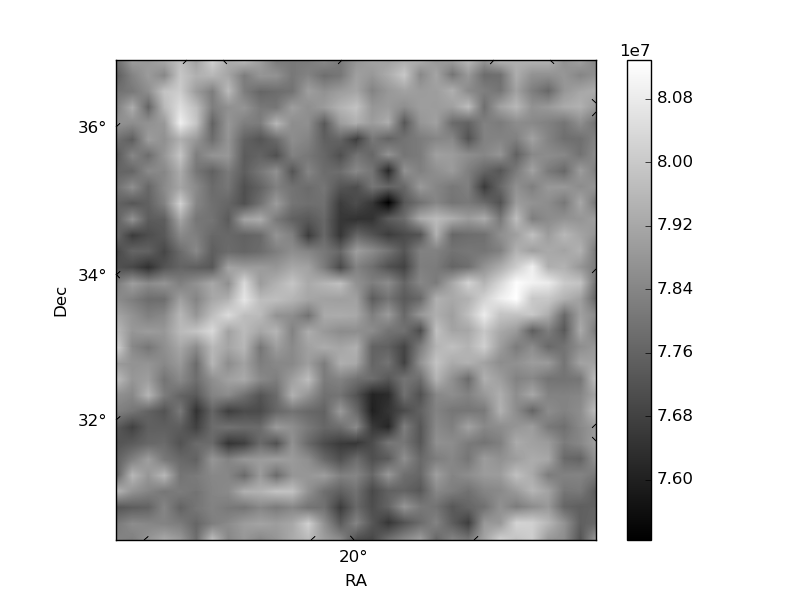
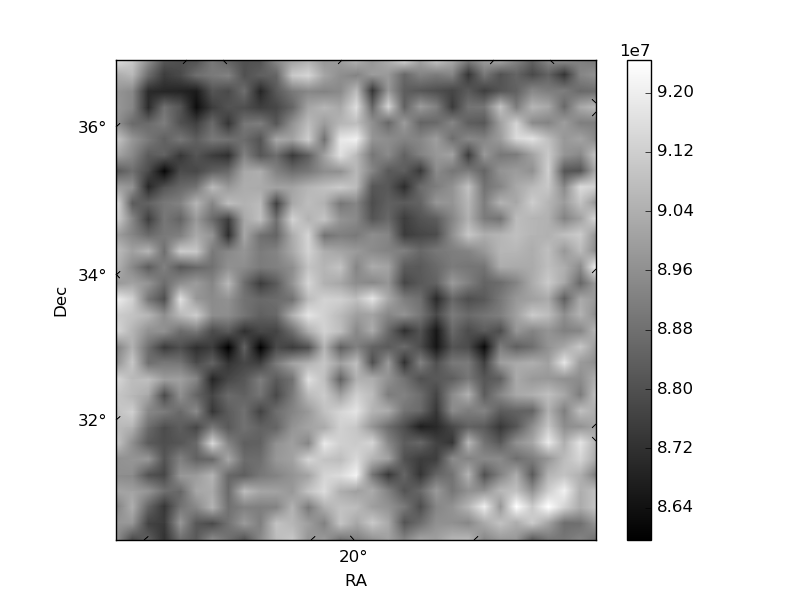
Histogram calculated using DETX and DETY for each event in the final _common_clean file
| Quadrant A | 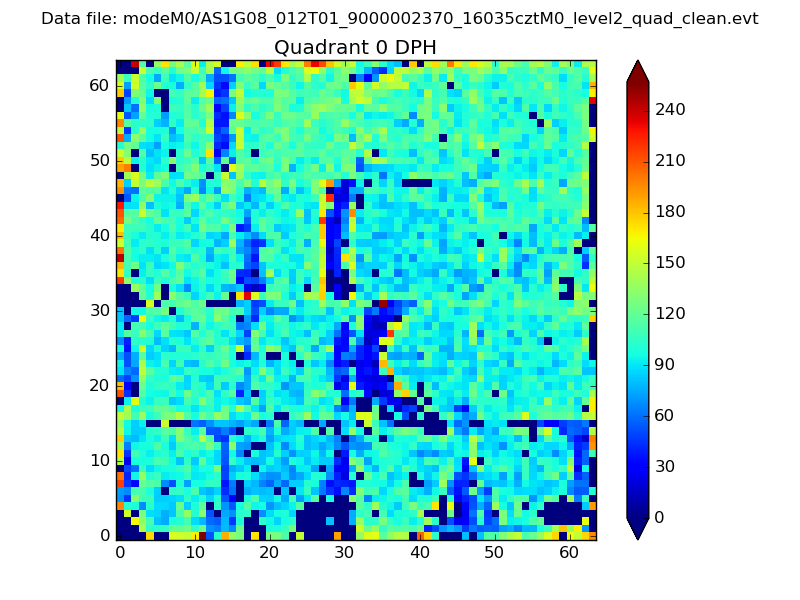 |
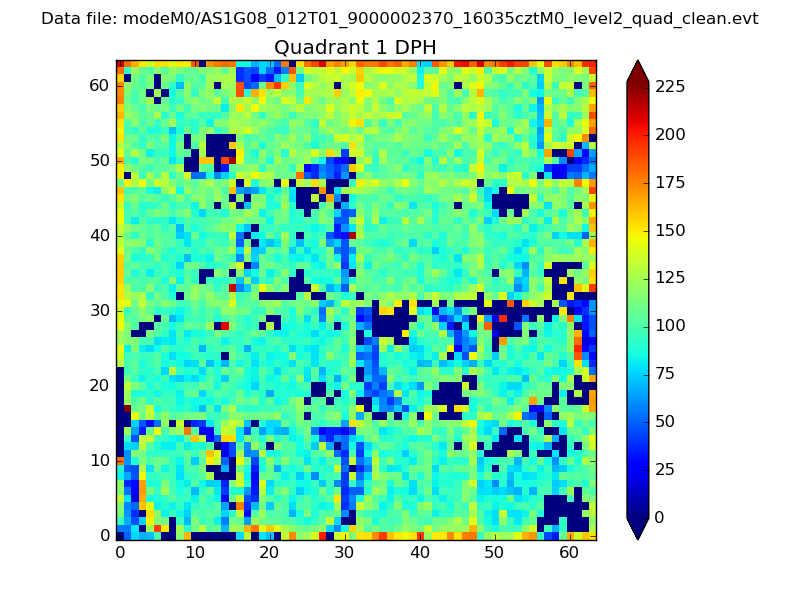 |
Quadrant B |
|---|---|---|---|
| Quadrant D | 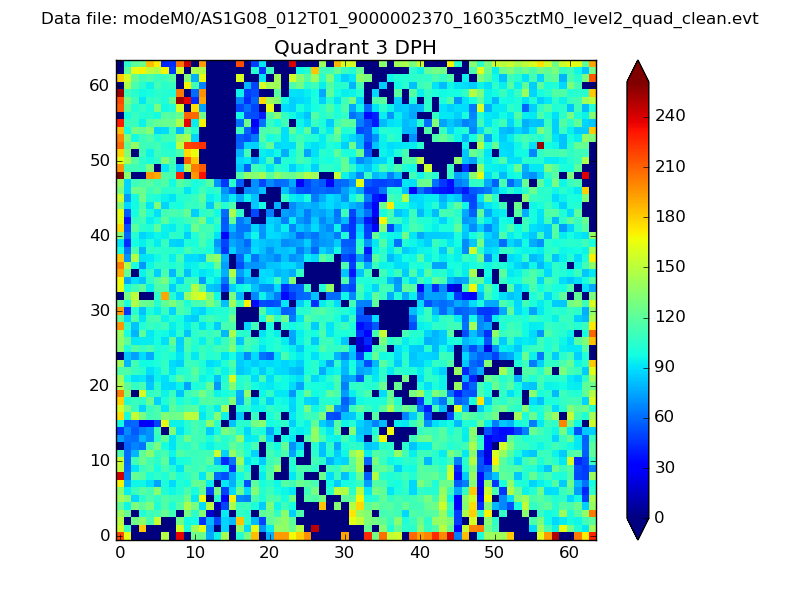 |
 |
Quadrant C |
| Plot type | Count rate plots | Images |
|---|---|---|
| Comparison with Poisson distribution Blue bars denote a histogram of data divided into 1 sec bins. Red curve is a Poisson curve with rate = median count rate of data. |
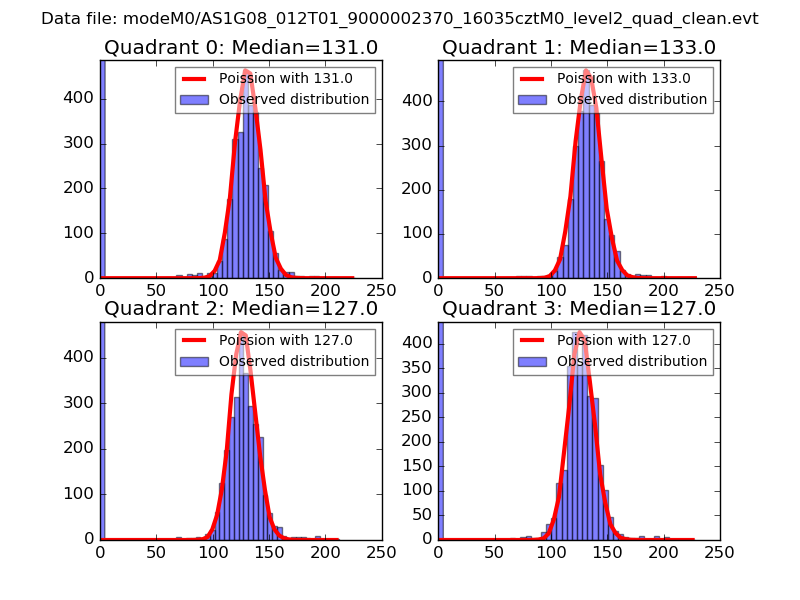 |
 |
| Quadrant-wise count rates Data is divided into 100 sec bins |
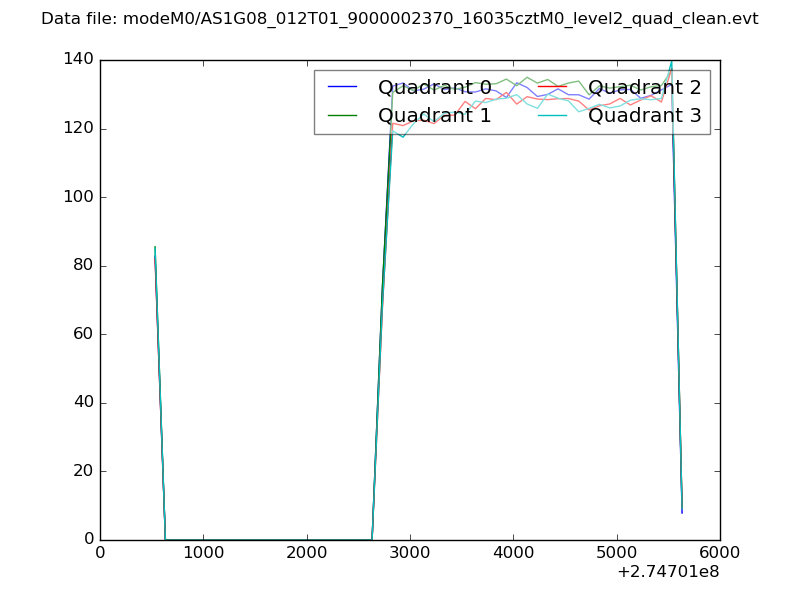 |
|
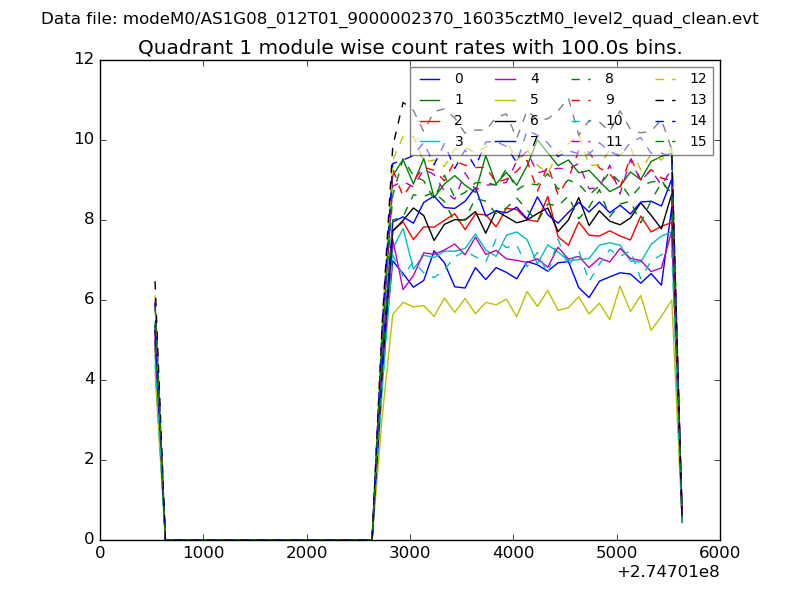
| Module-wise count rates for Quadrant A Data is divided into 100 sec bins |
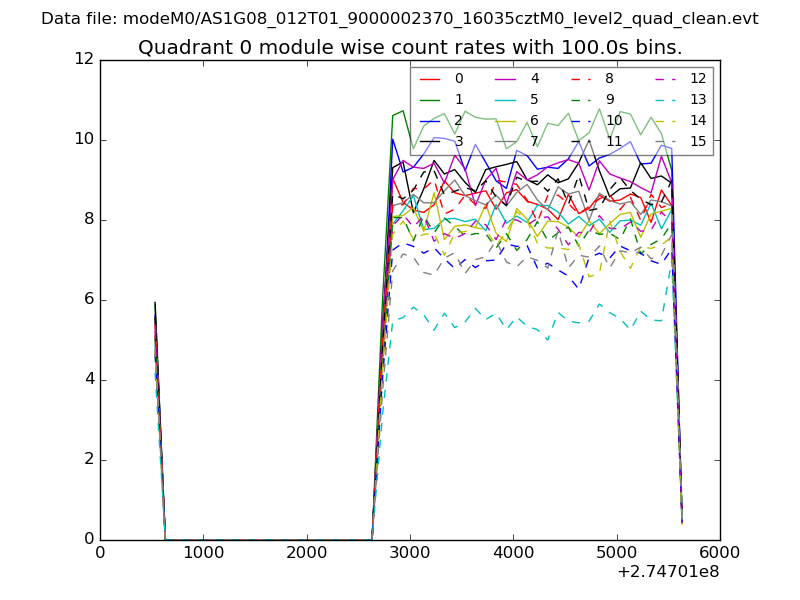 |
 |
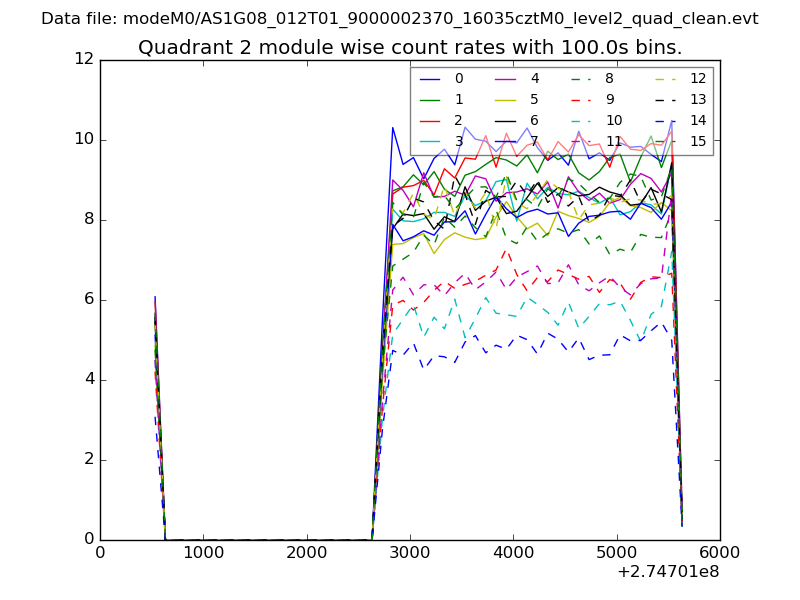
| Module-wise count rates for Quadrant B Data is divided into 100 sec bins |
 |
 |
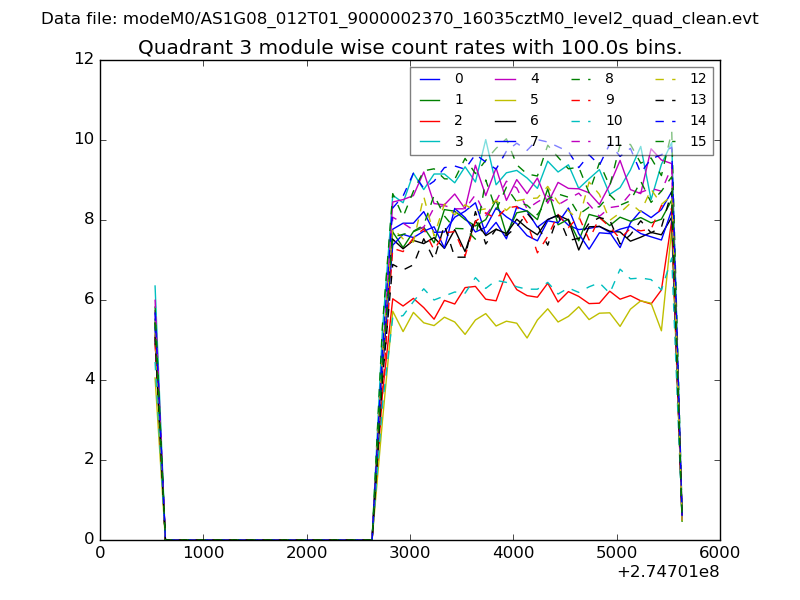
| Module-wise count rates for Quadrant C Data is divided into 100 sec bins |
 |
 |
| Module-wise count rates for Quadrant D Data is divided into 100 sec bins |
 |
 |
| Parameter | Plot |
|---|---|
| CZT HV Monitor | 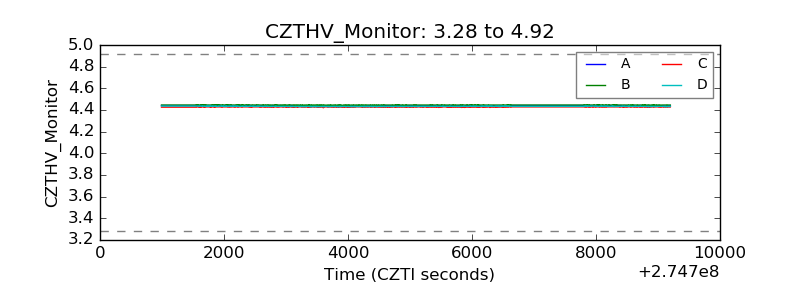 |
| D_VDD | 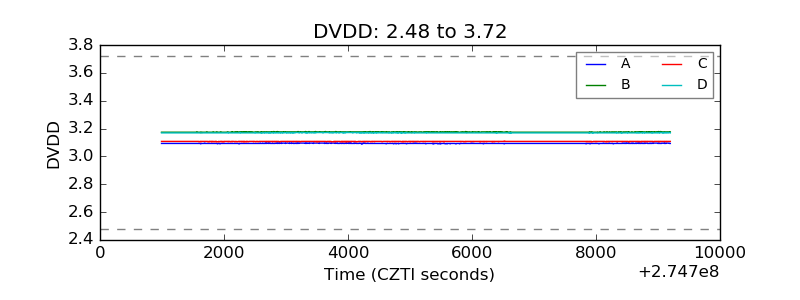 |
| Temperature 1 | 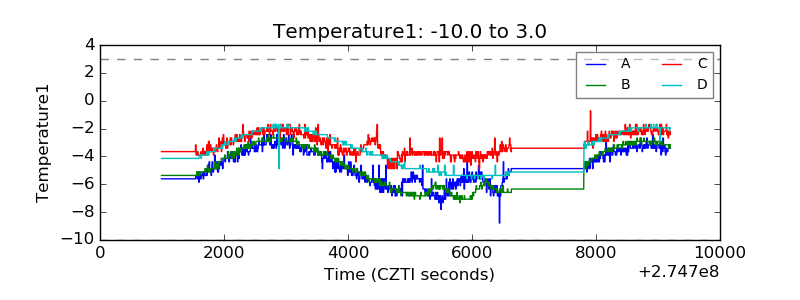 |
| Veto HV Monitor | 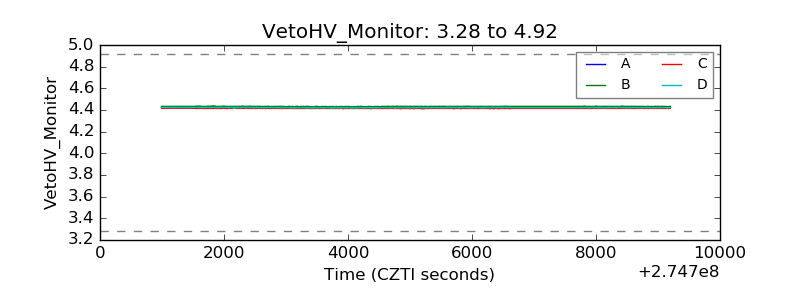 |
| Veto LLD |  |
| Alpha Counter | 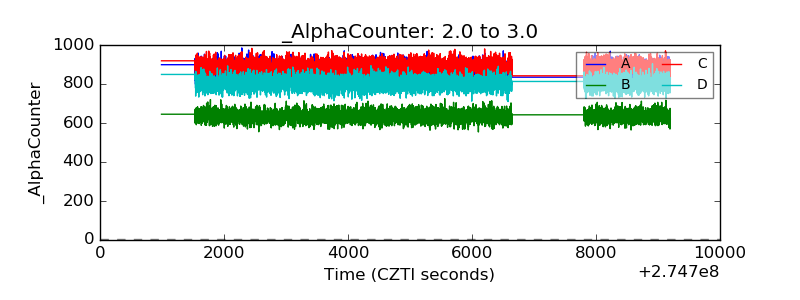 |
| _CPM_Rate | 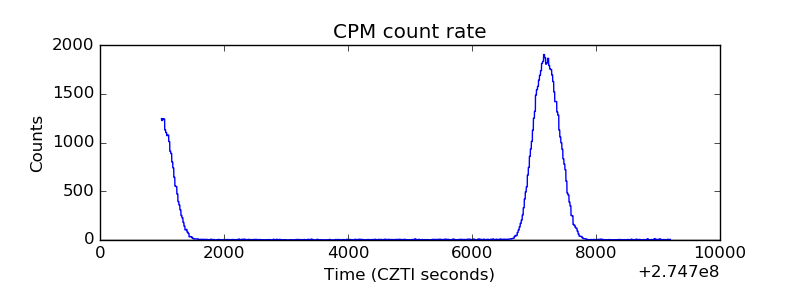 |
| CZT Counter | 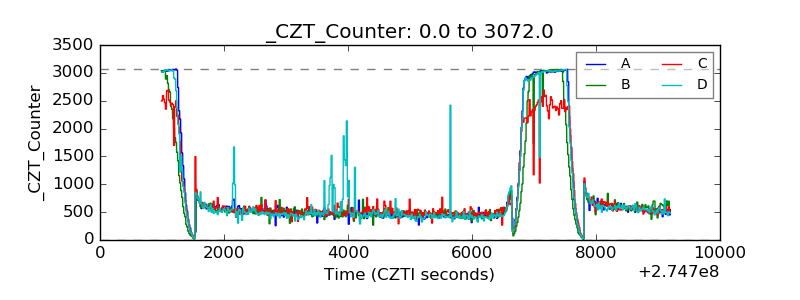 |
| +2.5 Volts monitor |  |
| +5 Volts monitor | 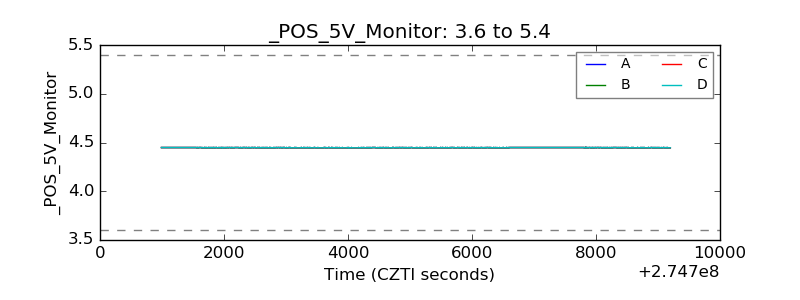 |
| _ROLL_ROT | 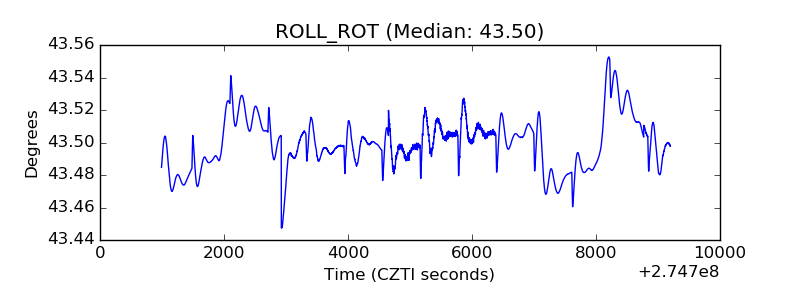 |
| _Roll_DEC | 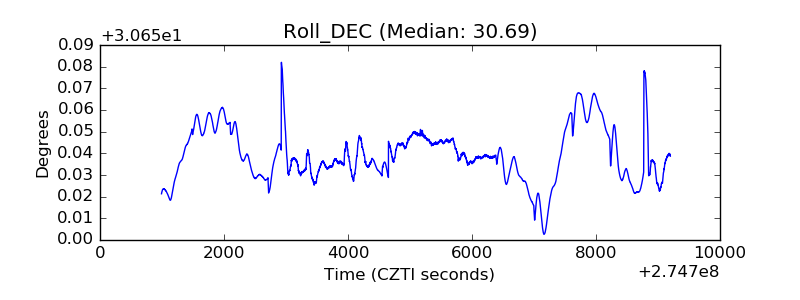 |
| _Roll_RA | 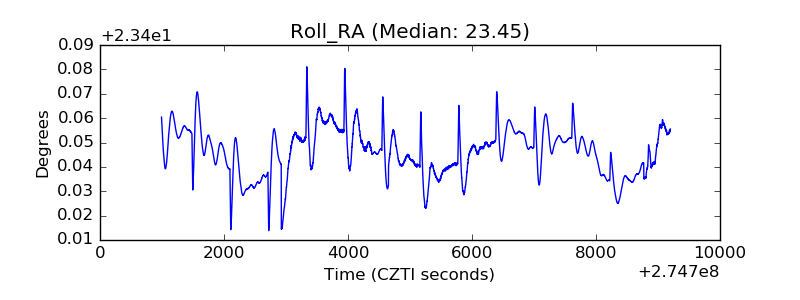 |
| Veto Counter |  |