| Param | Original file | Final file |
|---|---|---|
| Filename | modeM0/AS1G08_012T01_9000002370_16037cztM0_level2.evt | modeM0/AS1G08_012T01_9000002370_16037cztM0_level2_quad_clean.evt |
| Size (bytes) | 463,910,400 | 87,125,760 |
| Size | 442.4 MB | 83.1 MB |
| Events in quadrant A | 3,360,288 | 553,173 |
| Events in quadrant B | 3,412,704 | 564,130 |
| Events in quadrant C | 3,536,542 | 546,602 |
| Events in quadrant D | 3,316,175 | 538,803 |
| Mode M0 | |||
|---|---|---|---|
| Quadrant | BADHDUFLAG | Total packets | Discarded packets |
| A | 0 | 14058 | 3 |
| B | 0 | 14174 | 2 |
| C | 0 | 14528 | 2 |
| D | 0 | 13972 | 2 |
| Mode M9 | |||
|---|---|---|---|
| Quadrant | BADHDUFLAG | Total packets | Discarded packets |
| A | 0 | 27 | 0 |
| B | 0 | 27 | 0 |
| C | 0 | 27 | 0 |
| D | 0 | 27 | 0 |
| Mode SS | |||
|---|---|---|---|
| Quadrant | BADHDUFLAG | Total packets | Discarded packets |
| A | 0 | 128 | 0 |
| B | 0 | 128 | 0 |
| C | 0 | 128 | 0 |
| D | 0 | 128 | 0 |
| Quadrant | Total seconds | Saturated seconds | Saturation percentage |
|---|---|---|---|
| A | 6246 | 87 | 1.392891% |
| B | 6246 | 94 | 1.504963% |
| C | 6246 | 151 | 2.417547% |
| D | 6246 | 77 | 1.232789% |
Noise dominated data is calculated using 1-second bins in cleaned event files. If a bin has >2000 counts, and if more than 50% of those come from <1% of pixels, then it is considered to be noise-dominated and hence unusable.
| Quadrant | # 1 sec bins | Bins with >0 counts | Bins with >2000 counts | High rate bins dominated by noise | Noise dominated (total time) | Noise dominated (detector-on time) | Marked lightcurve |
|---|---|---|---|---|---|---|---|
| A | 8877 | 6247 | 1 | 1 | 0.01% | 0.02% | 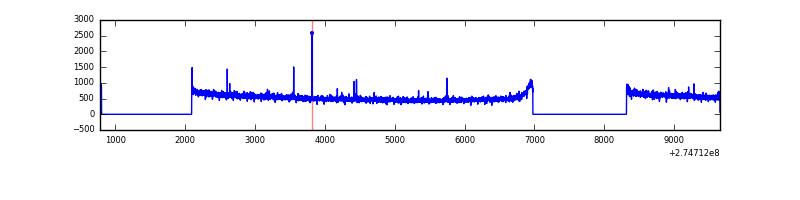 |
| B | 8877 | 6247 | 0 | 0 | 0.00% | 0.00% | 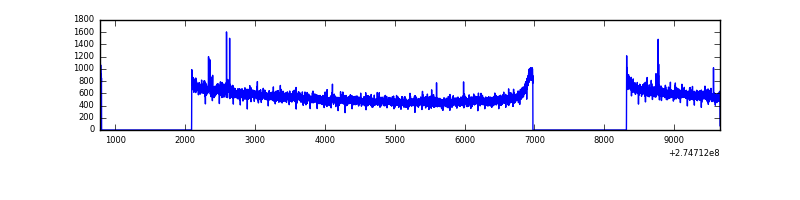 |
| C | 8877 | 6247 | 0 | 0 | 0.00% | 0.00% | 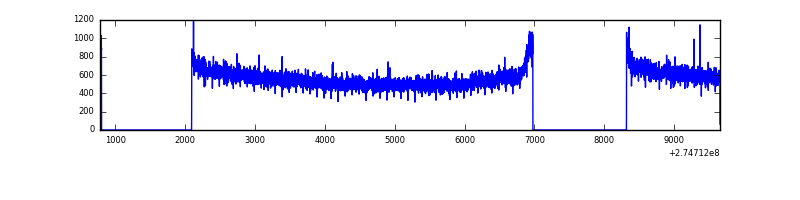 |
| D | 8877 | 6247 | 2 | 2 | 0.02% | 0.03% | 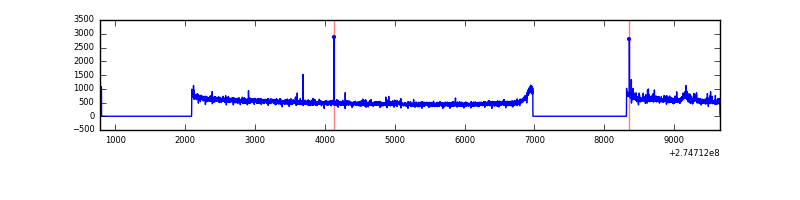 |
Top three noisy pixels from each quadrant. If the there are fewer than three noisy pixels in the level2.evt file, extra rows are filled as -1
| Pixel properties | Quadrant properties | ||||||
|---|---|---|---|---|---|---|---|
| Quadrant | DetID | PixID | Counts | Sigma | Mean | Median | Sigma |
| A | 9 | 143 | 22335 | 124.56 | 868 | 853 | 172.5 |
| A | 0 | 226 | 7649 | 39.41 | 868 | 853 | 172.5 |
| A | 12 | 194 | 6422 | 32.29 | 868 | 853 | 172.5 |
| B | 0 | 230 | 19743 | 116.08 | 868 | 848 | 162.8 |
| B | 12 | 111 | 18188 | 106.53 | 868 | 848 | 162.8 |
| B | 11 | 111 | 15792 | 91.81 | 868 | 848 | 162.8 |
| C | 14 | 238 | 132755 | 684.18 | 842 | 852 | 192.8 |
| C | 3 | 233 | 115399 | 594.15 | 842 | 852 | 192.8 |
| C | 13 | 61 | 5917 | 26.27 | 842 | 852 | 192.8 |
| D | 12 | 110 | 38047 | 180.32 | 856 | 835 | 206.4 |
| D | 2 | 152 | 26070 | 122.28 | 856 | 835 | 206.4 |
| D | 2 | 234 | 20605 | 95.8 | 856 | 835 | 206.4 |
Histogram calculated using DETX and DETY for each event in the final _common_clean file
| Quadrant A |  |
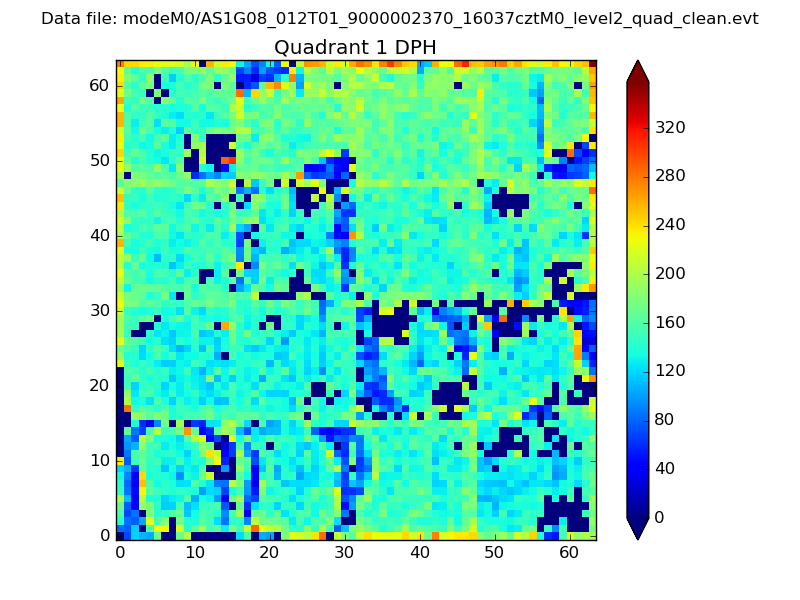 |
Quadrant B |
|---|---|---|---|
| Quadrant D | 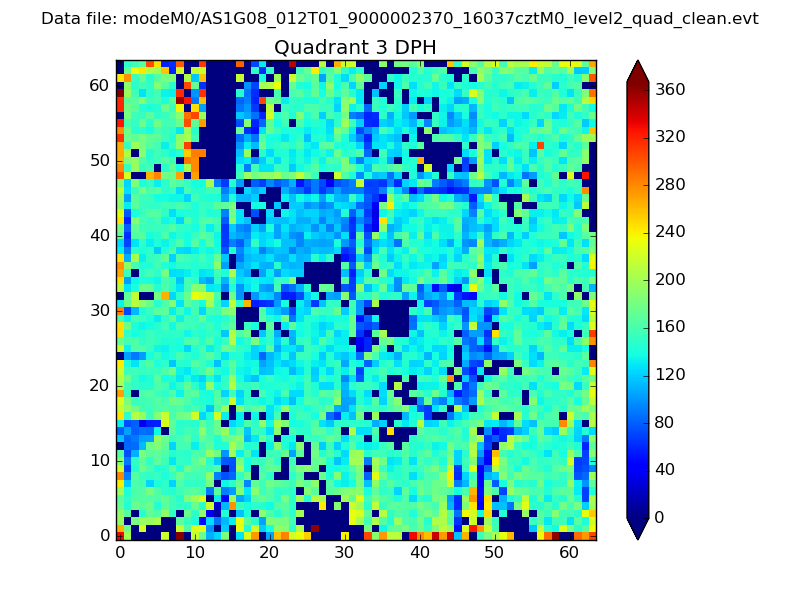 |
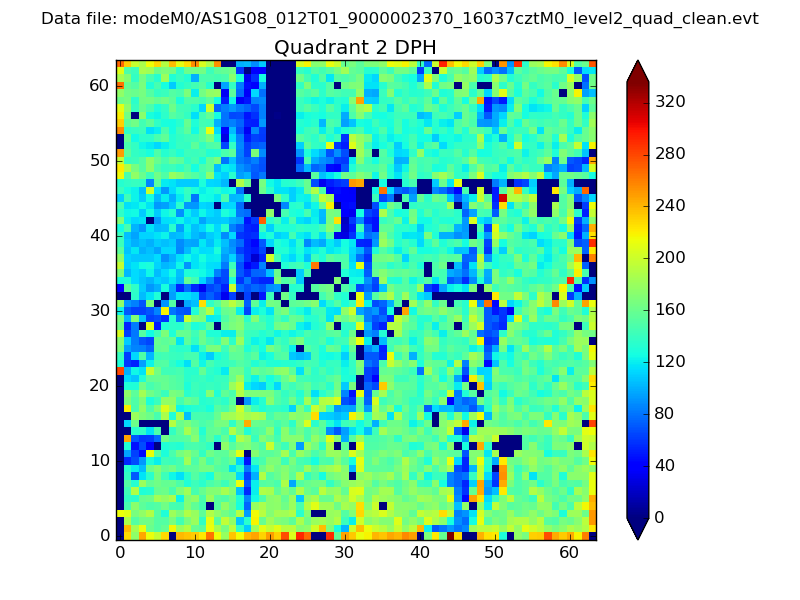 |
Quadrant C |
| Plot type | Count rate plots | Images |
|---|---|---|
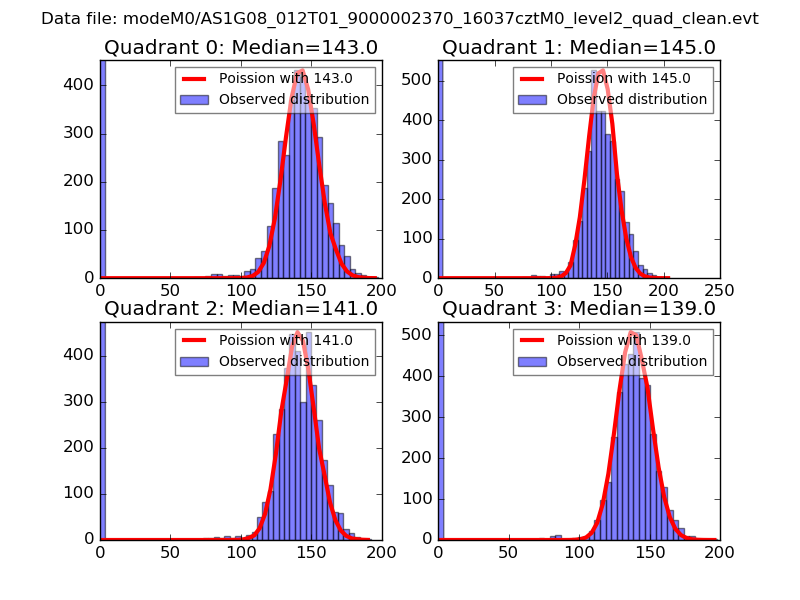
| Comparison with Poisson distribution Blue bars denote a histogram of data divided into 1 sec bins. Red curve is a Poisson curve with rate = median count rate of data. |
 |
 |
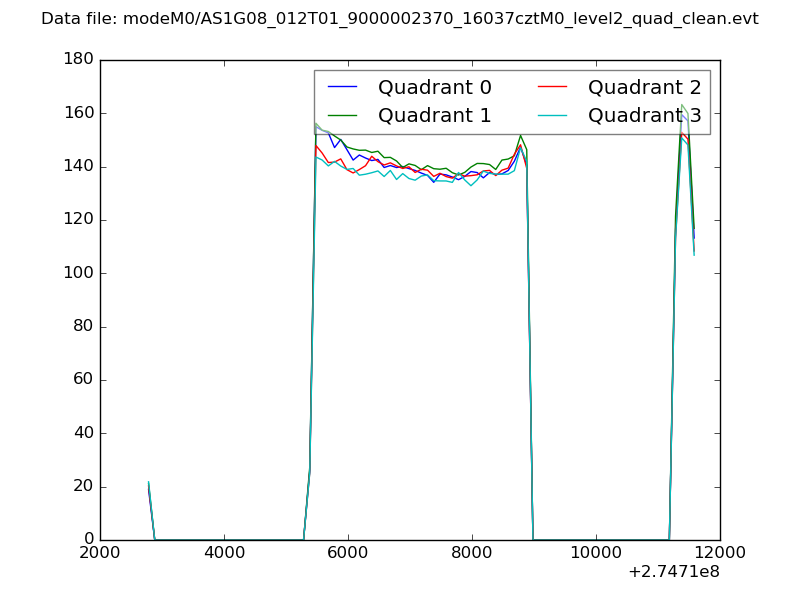
| Quadrant-wise count rates Data is divided into 100 sec bins |
 |
|
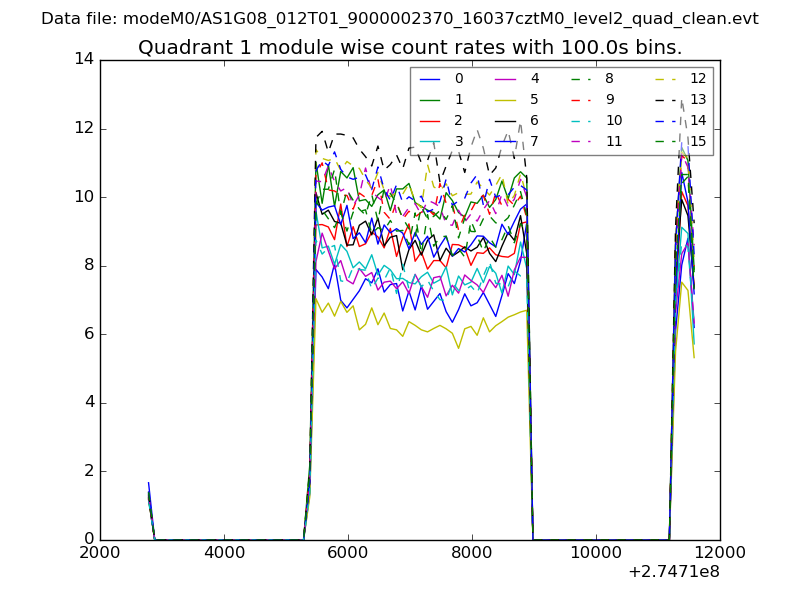
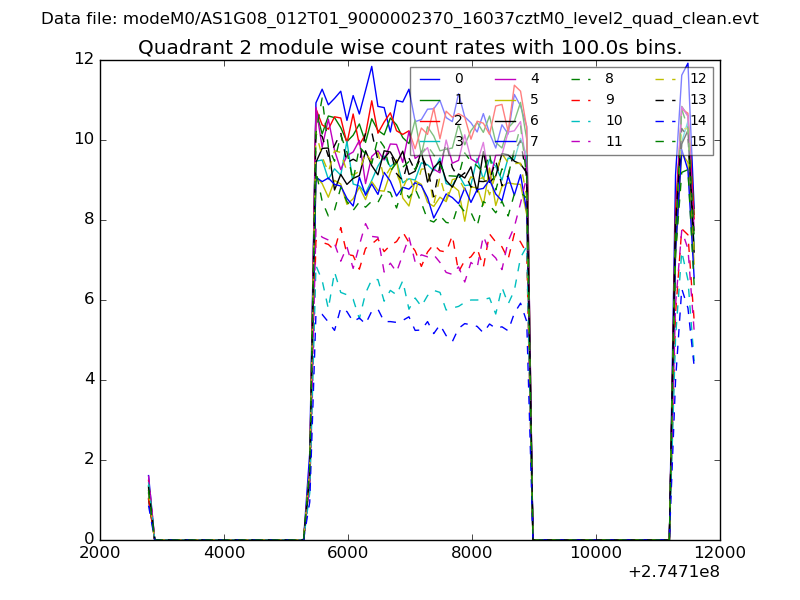
| Module-wise count rates for Quadrant A Data is divided into 100 sec bins |
 |
 |
| Module-wise count rates for Quadrant B Data is divided into 100 sec bins |
 |
 |
| Module-wise count rates for Quadrant C Data is divided into 100 sec bins |
 |
 |
| Module-wise count rates for Quadrant D Data is divided into 100 sec bins |
 |
 |
| Parameter | Plot |
|---|---|
| CZT HV Monitor |  |
| D_VDD | 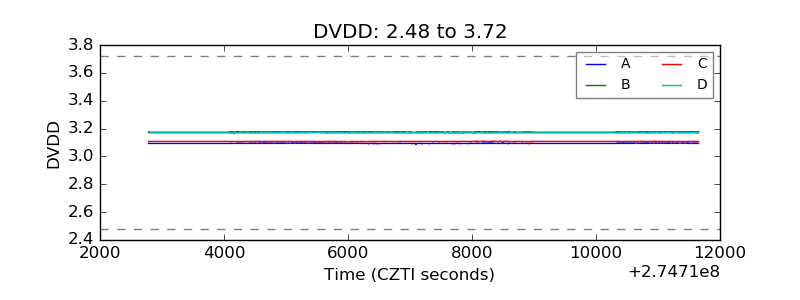 |
| Temperature 1 | 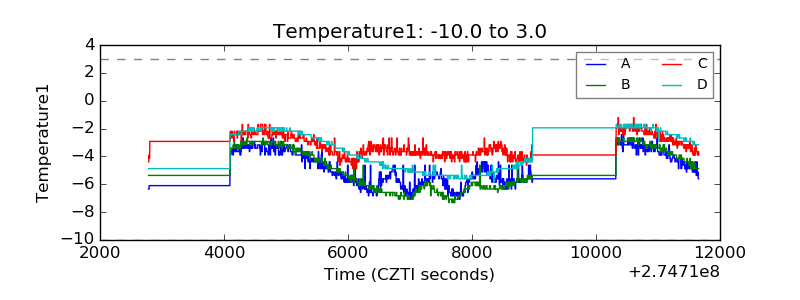 |
| Veto HV Monitor | 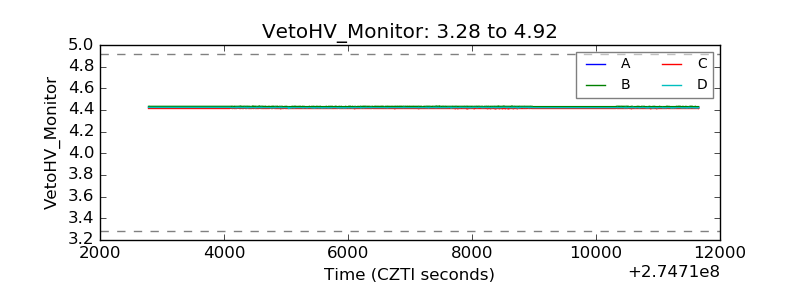 |
| Veto LLD | 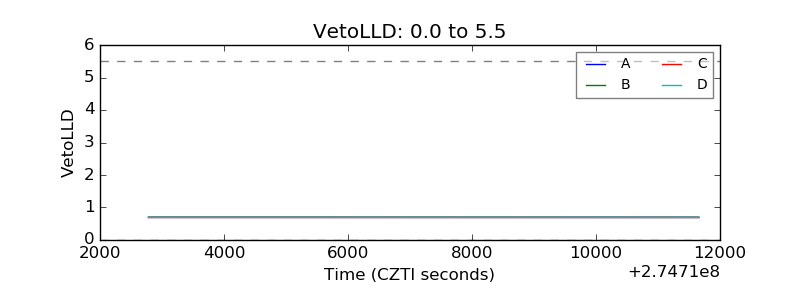 |
| Alpha Counter | 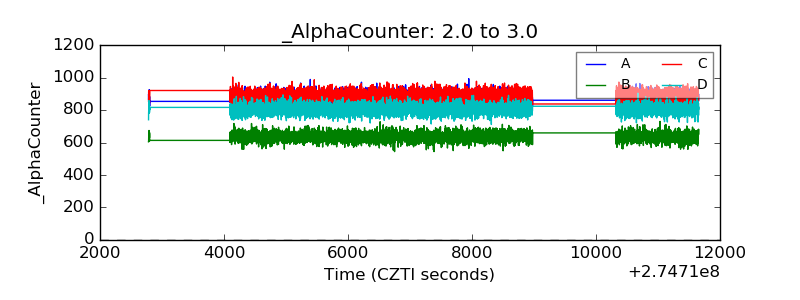 |
| _CPM_Rate | 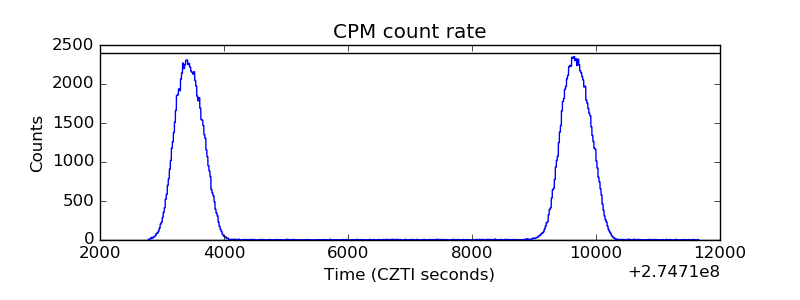 |
| CZT Counter | 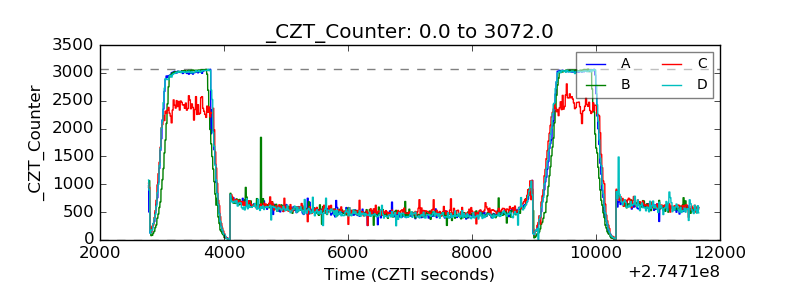 |
| +2.5 Volts monitor |  |
| +5 Volts monitor |  |
| _ROLL_ROT | 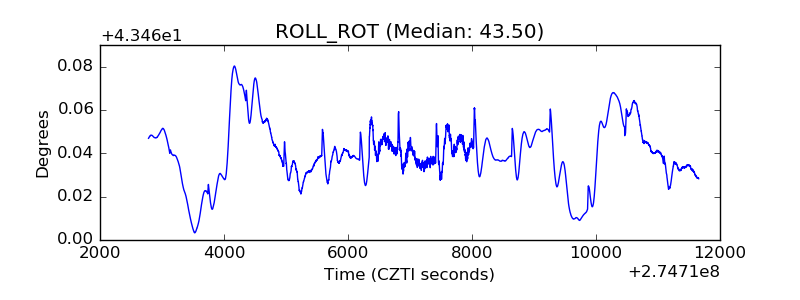 |
| _Roll_DEC | 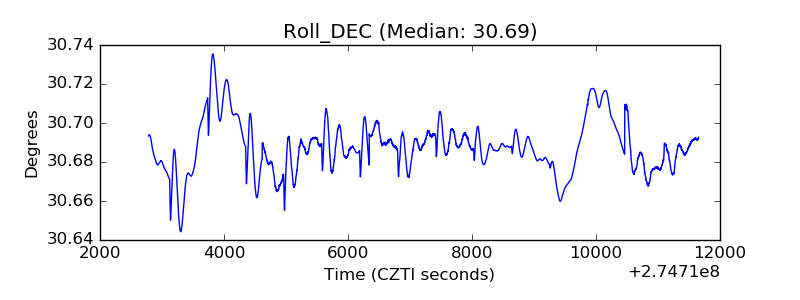 |
| _Roll_RA | 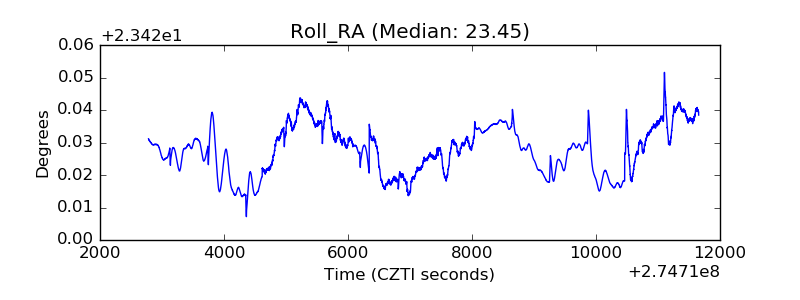 |
| Veto Counter | 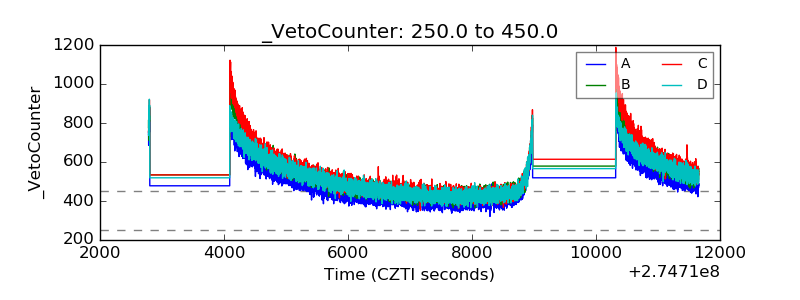 |