| Param | Original file | Final file |
|---|---|---|
| Filename | modeM0/AS1G08_012T01_9000002370_16038cztM0_level2.evt | modeM0/AS1G08_012T01_9000002370_16038cztM0_level2_quad_clean.evt |
| Size (bytes) | 478,206,720 | 100,310,400 |
| Size | 456.1 MB | 95.7 MB |
| Events in quadrant A | 3,641,865 | 641,663 |
| Events in quadrant B | 3,458,662 | 666,803 |
| Events in quadrant C | 3,567,828 | 647,331 |
| Events in quadrant D | 3,380,453 | 636,539 |
| Mode M0 | |||
|---|---|---|---|
| Quadrant | BADHDUFLAG | Total packets | Discarded packets |
| A | 0 | 15036 | 3 |
| B | 0 | 14354 | 2 |
| C | 0 | 14687 | 2 |
| D | 0 | 14217 | 2 |
| Mode M9 | |||
|---|---|---|---|
| Quadrant | BADHDUFLAG | Total packets | Discarded packets |
| A | 0 | 27 | 0 |
| B | 0 | 27 | 0 |
| C | 0 | 27 | 0 |
| D | 0 | 27 | 0 |
| Mode SS | |||
|---|---|---|---|
| Quadrant | BADHDUFLAG | Total packets | Discarded packets |
| A | 0 | 132 | 0 |
| B | 0 | 132 | 0 |
| C | 0 | 132 | 0 |
| D | 0 | 132 | 0 |
| Quadrant | Total seconds | Saturated seconds | Saturation percentage |
|---|---|---|---|
| A | 6384 | 240 | 3.759398% |
| B | 6384 | 138 | 2.161654% |
| C | 6384 | 171 | 2.678571% |
| D | 6384 | 108 | 1.691729% |
Noise dominated data is calculated using 1-second bins in cleaned event files. If a bin has >2000 counts, and if more than 50% of those come from <1% of pixels, then it is considered to be noise-dominated and hence unusable.
| Quadrant | # 1 sec bins | Bins with >0 counts | Bins with >2000 counts | High rate bins dominated by noise | Noise dominated (total time) | Noise dominated (detector-on time) | Marked lightcurve |
|---|---|---|---|---|---|---|---|
| A | 9075 | 6385 | 116 | 116 | 1.28% | 1.82% | 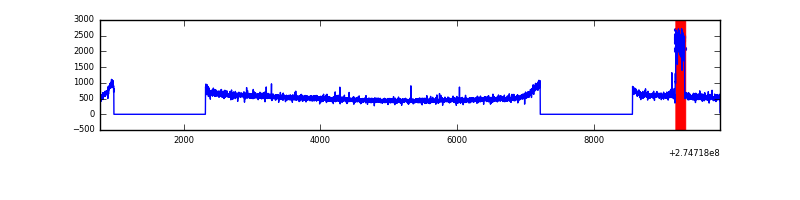 |
| B | 9075 | 6385 | 0 | 0 | 0.00% | 0.00% | 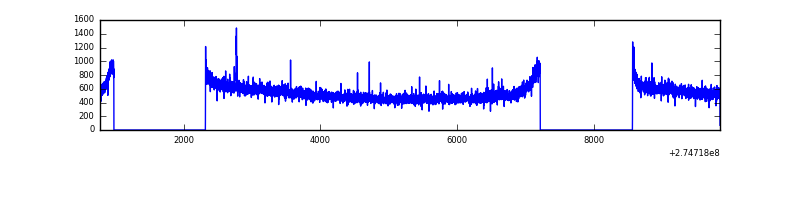 |
| C | 9075 | 6385 | 2 | 2 | 0.02% | 0.03% |  |
| D | 9075 | 6385 | 1 | 1 | 0.01% | 0.02% | 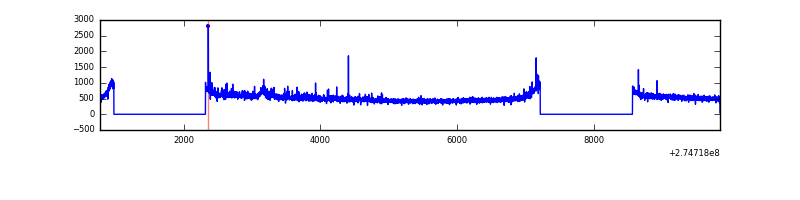 |
Top three noisy pixels from each quadrant. If the there are fewer than three noisy pixels in the level2.evt file, extra rows are filled as -1
| Pixel properties | Quadrant properties | ||||||
|---|---|---|---|---|---|---|---|
| Quadrant | DetID | PixID | Counts | Sigma | Mean | Median | Sigma |
| A | 15 | 223 | 241846 | 1392.75 | 871 | 855 | 173.0 |
| A | 15 | 239 | 47989 | 272.4 | 871 | 855 | 173.0 |
| A | 0 | 226 | 7813 | 40.21 | 871 | 855 | 173.0 |
| B | 12 | 111 | 18870 | 107.49 | 881 | 862 | 167.5 |
| B | 11 | 111 | 15855 | 89.5 | 881 | 862 | 167.5 |
| B | 14 | 111 | 13375 | 74.69 | 881 | 862 | 167.5 |
| C | 14 | 238 | 133735 | 670.41 | 858 | 864 | 198.2 |
| C | 3 | 233 | 75448 | 376.32 | 858 | 864 | 198.2 |
| C | 13 | 61 | 6016 | 25.99 | 858 | 864 | 198.2 |
| D | 12 | 110 | 39492 | 186.3 | 870 | 849 | 207.4 |
| D | 2 | 152 | 36847 | 173.55 | 870 | 849 | 207.4 |
| D | 2 | 234 | 20355 | 94.04 | 870 | 849 | 207.4 |
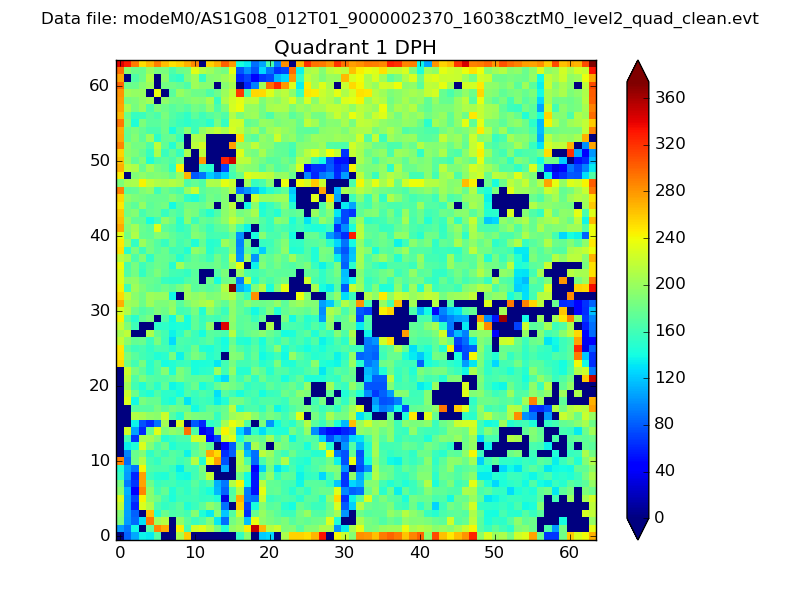
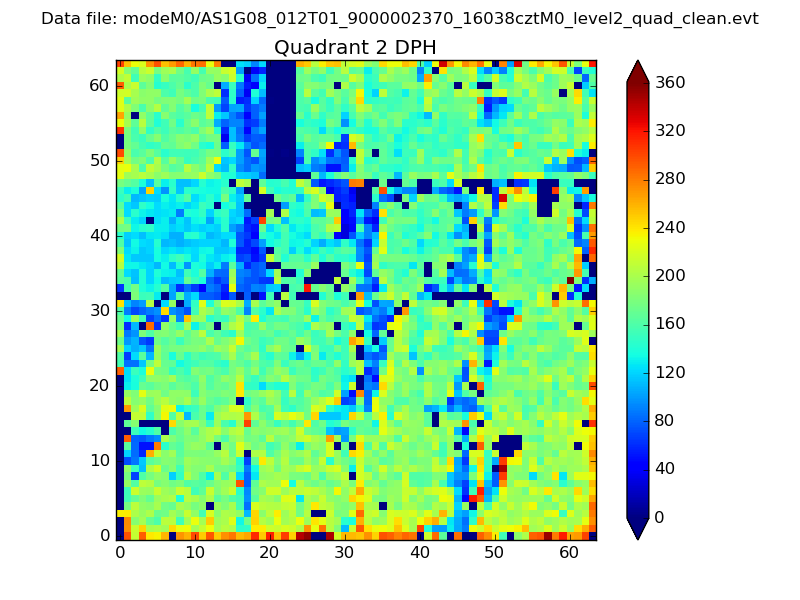
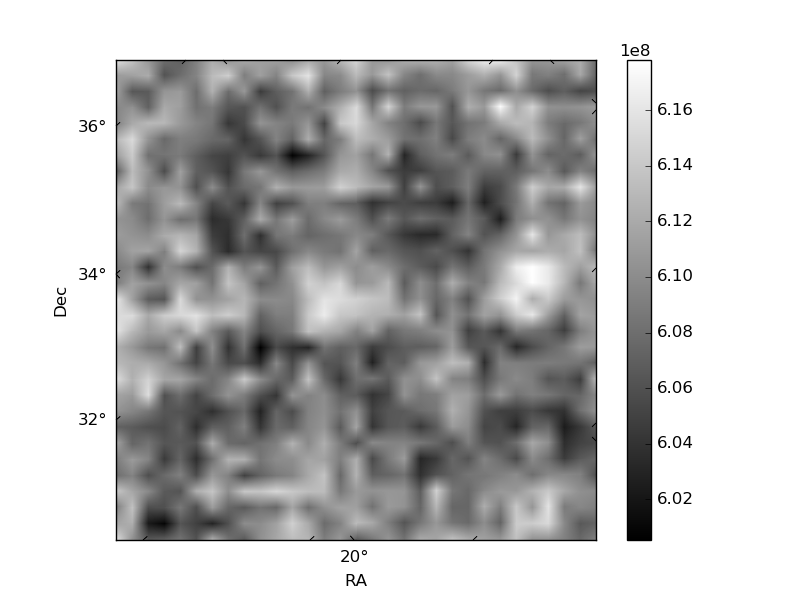
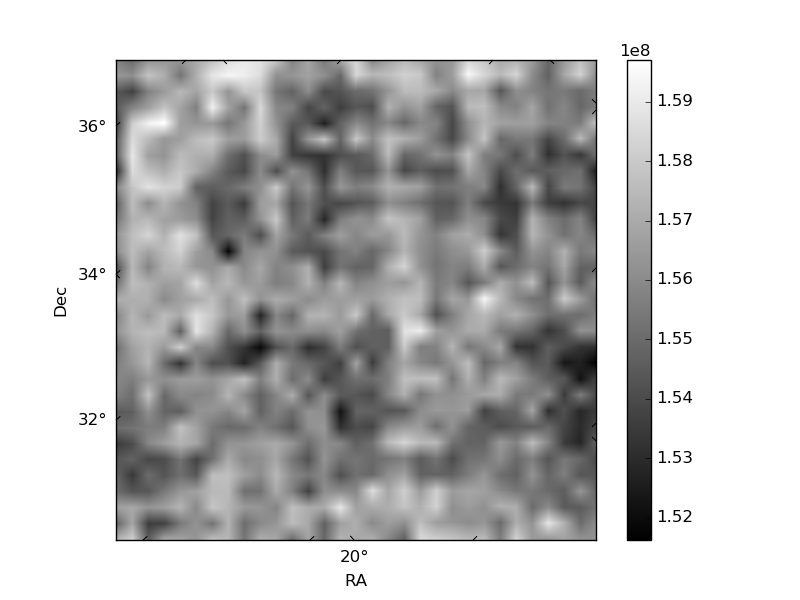
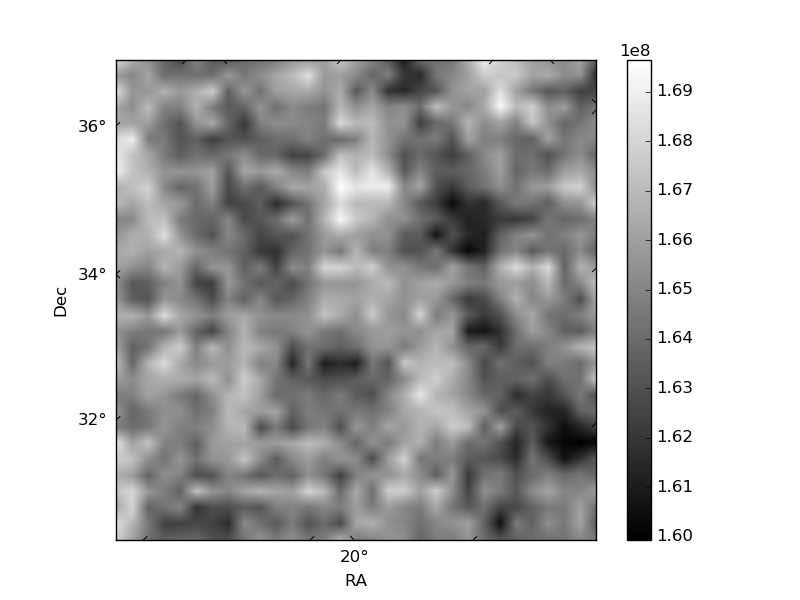
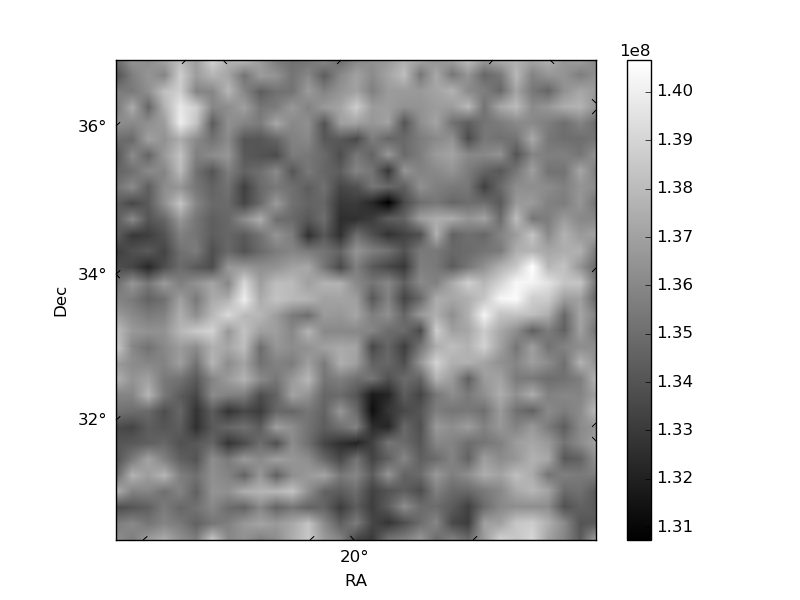
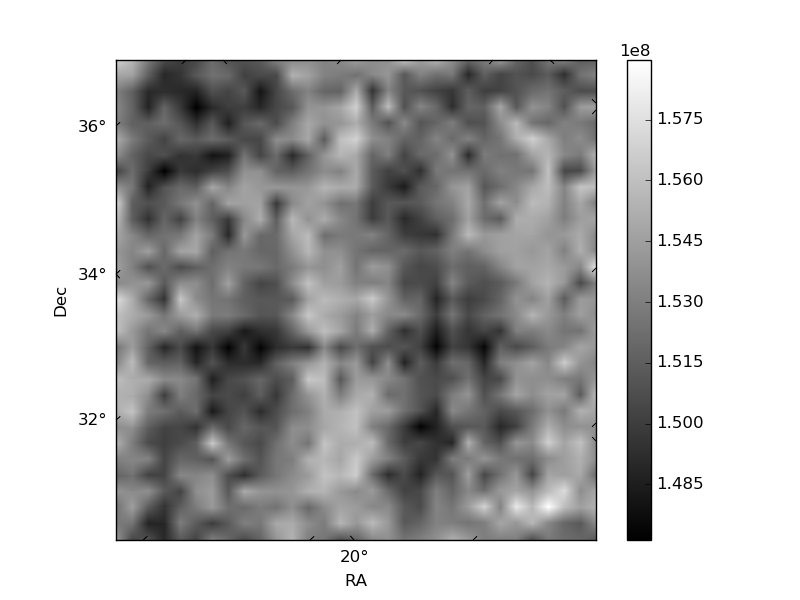
Histogram calculated using DETX and DETY for each event in the final _common_clean file
| Quadrant A | 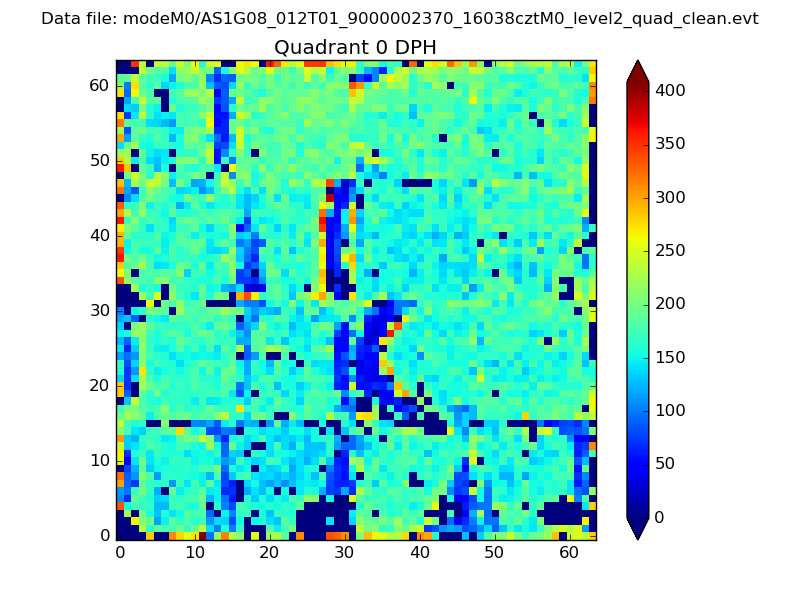 |
 |
Quadrant B |
|---|---|---|---|
| Quadrant D | 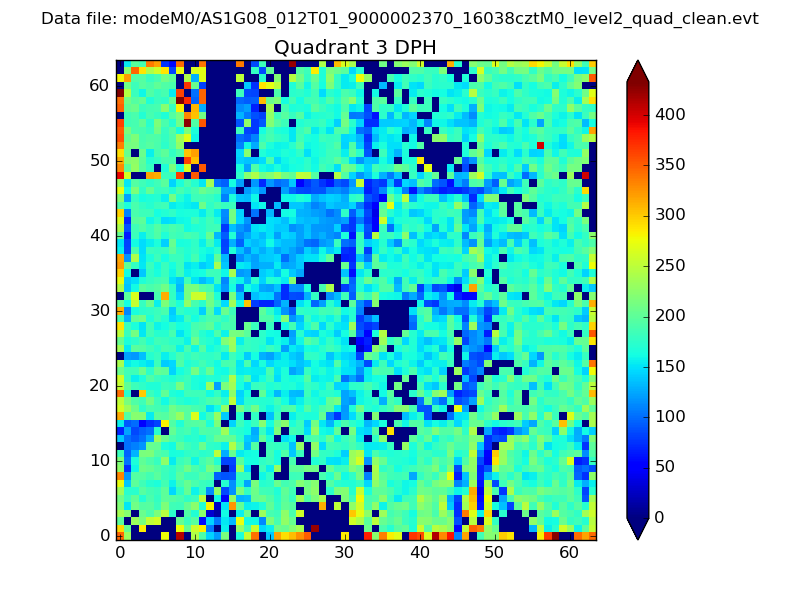 |
 |
Quadrant C |
| Plot type | Count rate plots | Images |
|---|---|---|
| Comparison with Poisson distribution Blue bars denote a histogram of data divided into 1 sec bins. Red curve is a Poisson curve with rate = median count rate of data. |
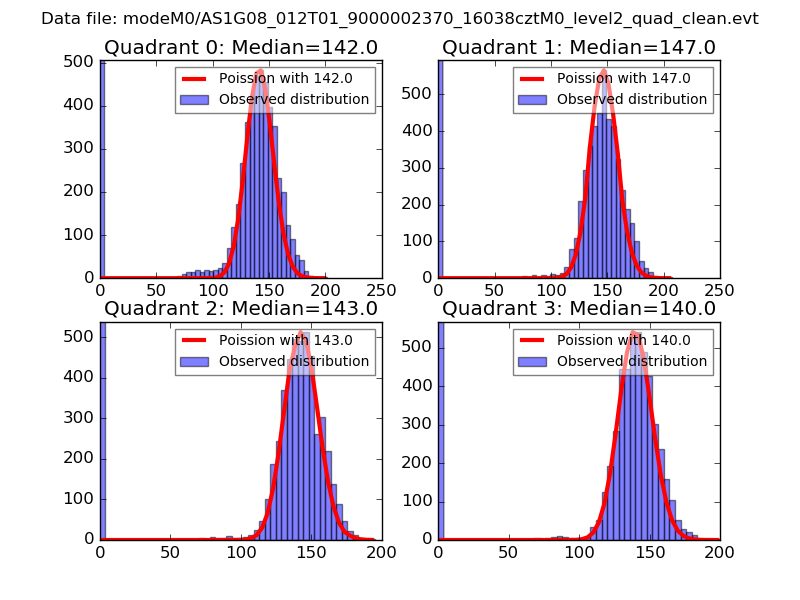 |
 |
| Quadrant-wise count rates Data is divided into 100 sec bins |
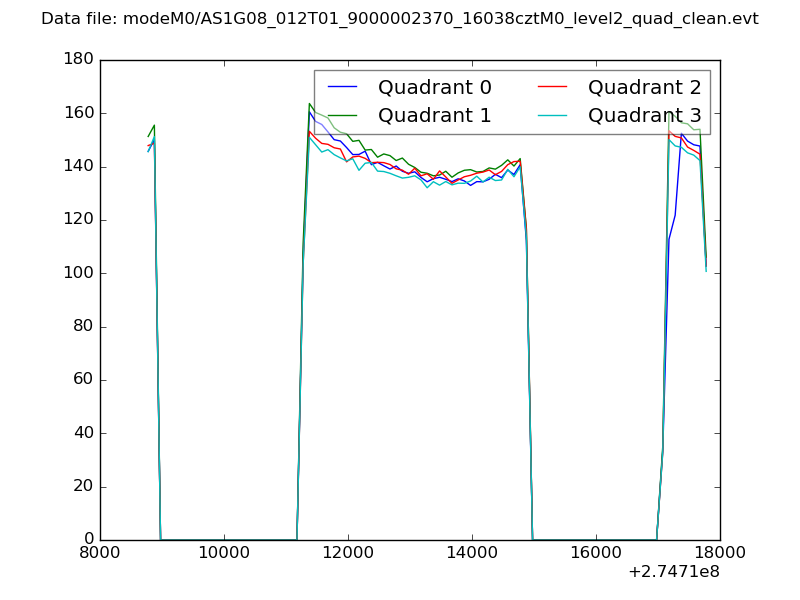 |
|
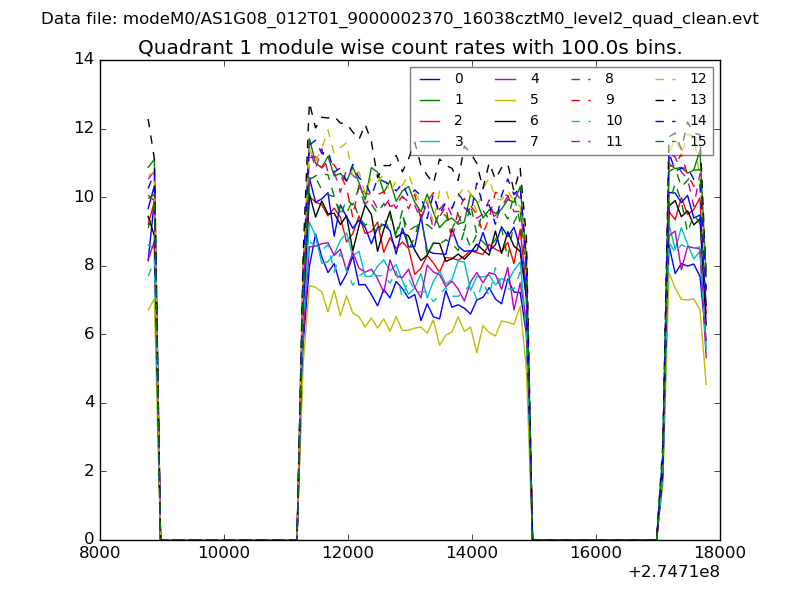
| Module-wise count rates for Quadrant A Data is divided into 100 sec bins |
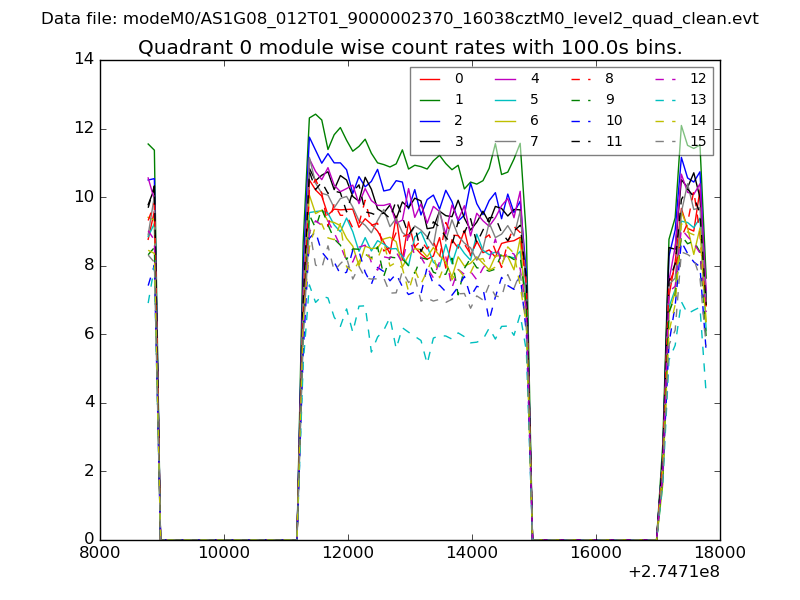 |
 |
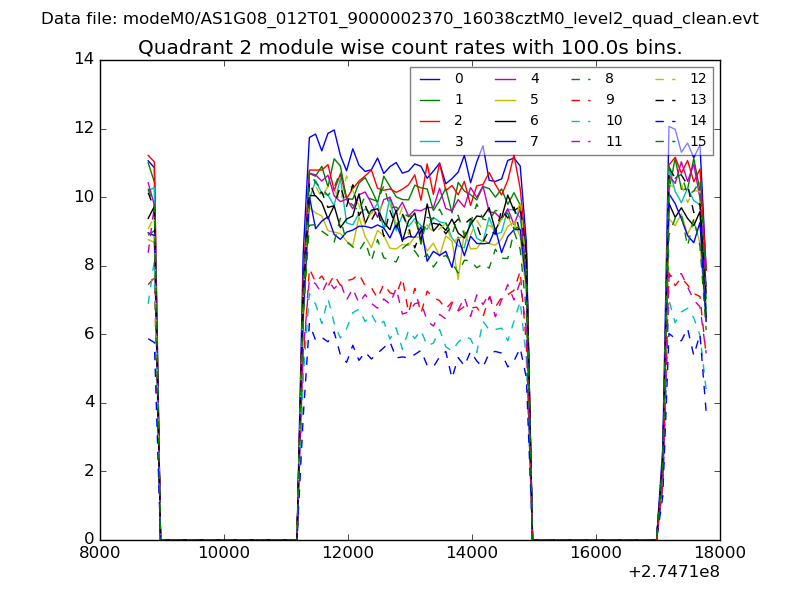
| Module-wise count rates for Quadrant B Data is divided into 100 sec bins |
 |
 |
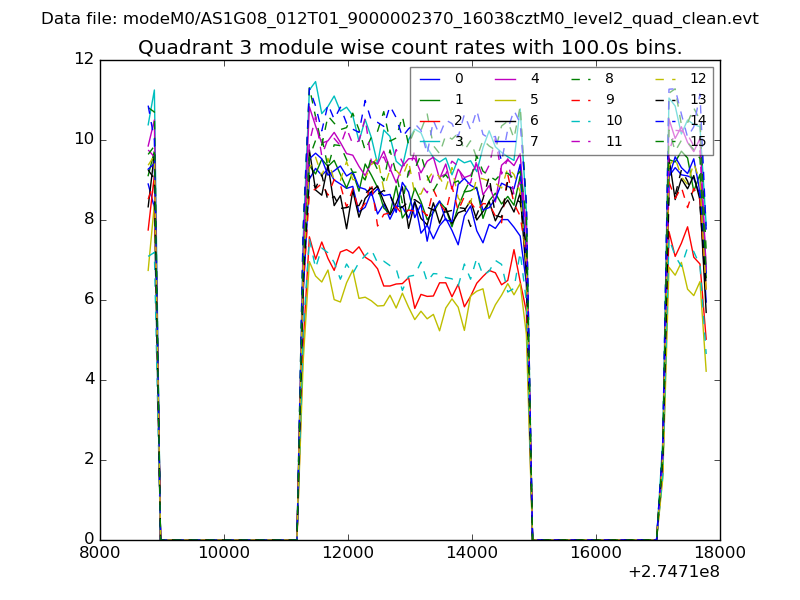
| Module-wise count rates for Quadrant C Data is divided into 100 sec bins |
 |
 |
| Module-wise count rates for Quadrant D Data is divided into 100 sec bins |
 |
 |
| Parameter | Plot |
|---|---|
| CZT HV Monitor | 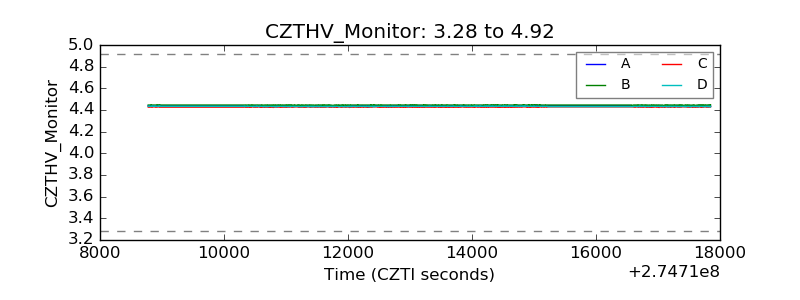 |
| D_VDD | 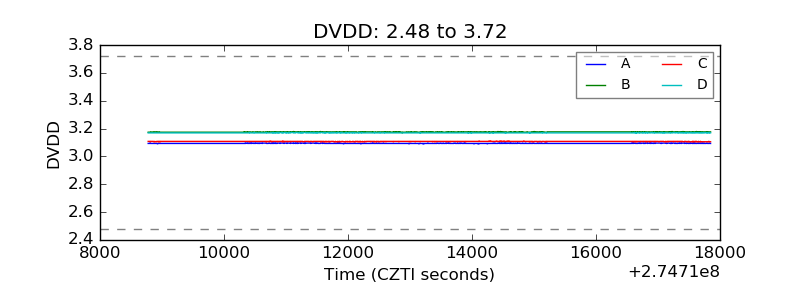 |
| Temperature 1 | 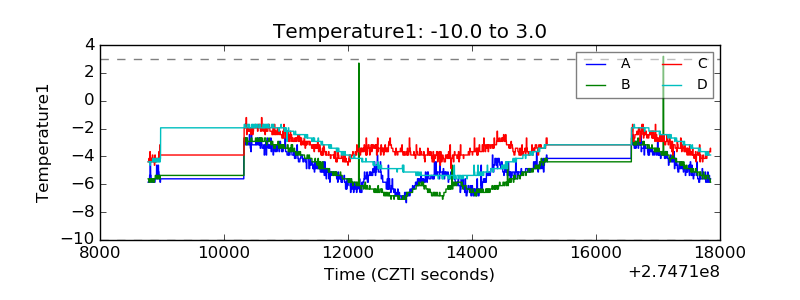 |
| Veto HV Monitor | 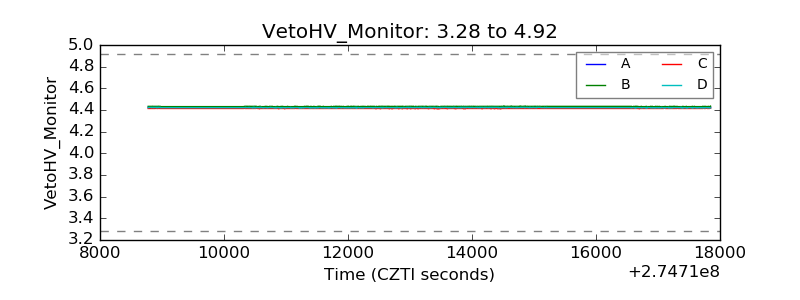 |
| Veto LLD |  |
| Alpha Counter | 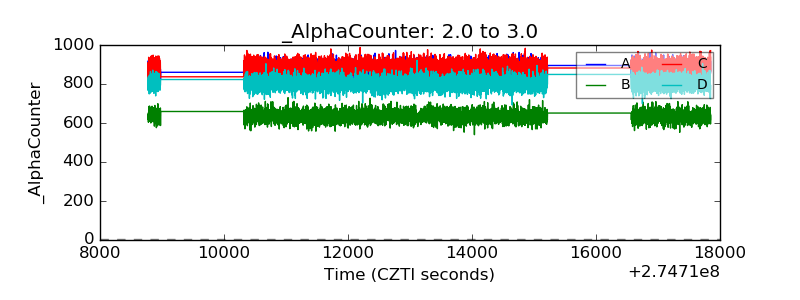 |
| _CPM_Rate | 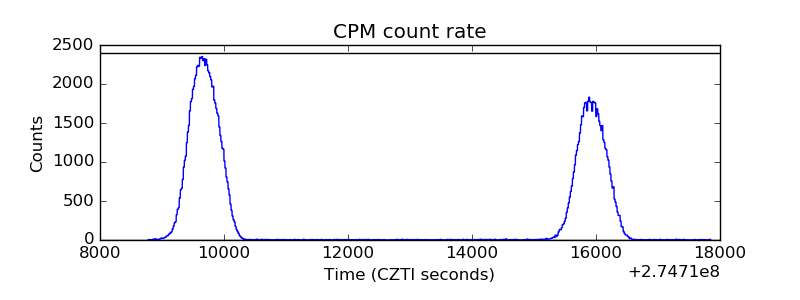 |
| CZT Counter | 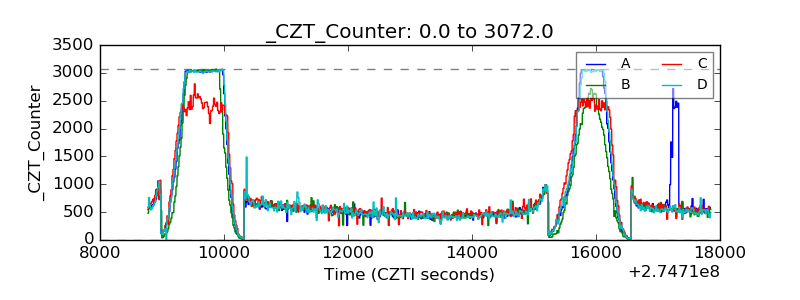 |
| +2.5 Volts monitor |  |
| +5 Volts monitor |  |
| _ROLL_ROT | 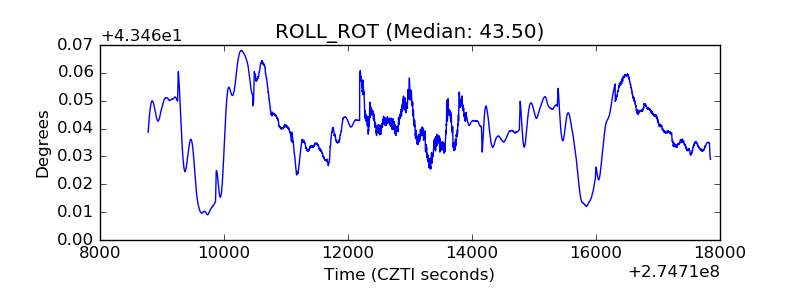 |
| _Roll_DEC | 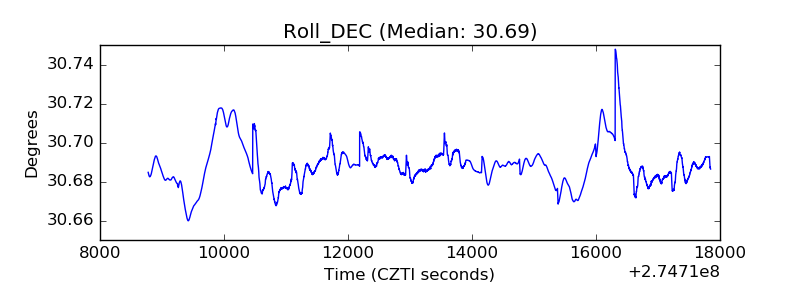 |
| _Roll_RA | 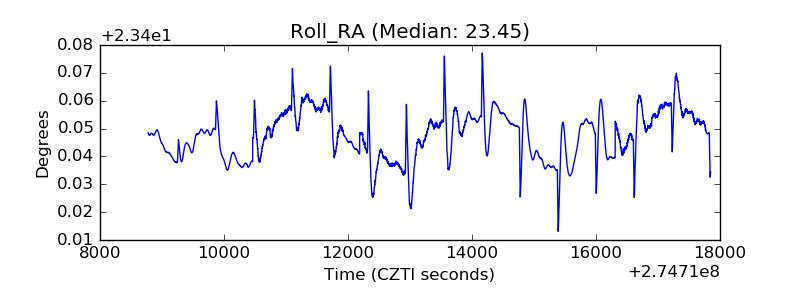 |
| Veto Counter | 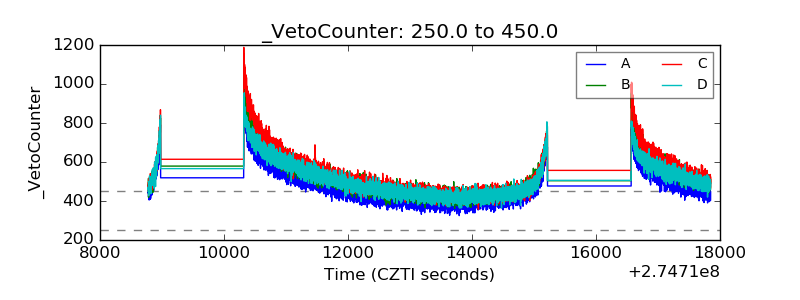 |