| Param | Original file | Final file |
|---|---|---|
| Filename | modeM0/AS1G08_012T01_9000002370_16039cztM0_level2.evt | modeM0/AS1G08_012T01_9000002370_16039cztM0_level2_quad_clean.evt |
| Size (bytes) | 479,822,400 | 105,480,000 |
| Size | 457.6 MB | 100.6 MB |
| Events in quadrant A | 3,661,522 | 673,714 |
| Events in quadrant B | 3,504,849 | 699,111 |
| Events in quadrant C | 3,558,341 | 682,237 |
| Events in quadrant D | 3,349,153 | 669,979 |
| Mode M0 | |||
|---|---|---|---|
| Quadrant | BADHDUFLAG | Total packets | Discarded packets |
| A | 0 | 15312 | 3 |
| B | 0 | 14688 | 2 |
| C | 0 | 14749 | 2 |
| D | 0 | 14362 | 2 |
| Mode M9 | |||
|---|---|---|---|
| Quadrant | BADHDUFLAG | Total packets | Discarded packets |
| A | 0 | 26 | 0 |
| B | 0 | 26 | 0 |
| C | 0 | 26 | 0 |
| D | 0 | 26 | 0 |
| Mode SS | |||
|---|---|---|---|
| Quadrant | BADHDUFLAG | Total packets | Discarded packets |
| A | 0 | 140 | 0 |
| B | 0 | 140 | 0 |
| C | 0 | 140 | 0 |
| D | 0 | 140 | 0 |
| Quadrant | Total seconds | Saturated seconds | Saturation percentage |
|---|---|---|---|
| A | 6731 | 210 | 3.119893% |
| B | 6731 | 120 | 1.782796% |
| C | 6731 | 133 | 1.975932% |
| D | 6731 | 83 | 1.233101% |
Noise dominated data is calculated using 1-second bins in cleaned event files. If a bin has >2000 counts, and if more than 50% of those come from <1% of pixels, then it is considered to be noise-dominated and hence unusable.
| Quadrant | # 1 sec bins | Bins with >0 counts | Bins with >2000 counts | High rate bins dominated by noise | Noise dominated (total time) | Noise dominated (detector-on time) | Marked lightcurve |
|---|---|---|---|---|---|---|---|
| A | 9352 | 6733 | 116 | 116 | 1.24% | 1.72% | 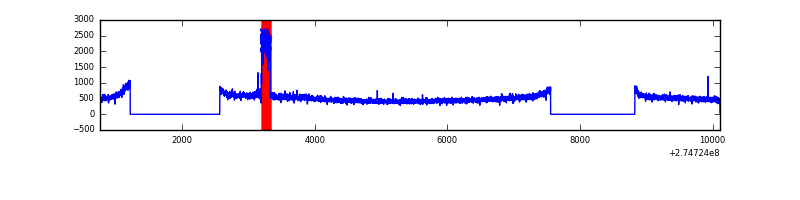 |
| B | 9352 | 6732 | 2 | 2 | 0.02% | 0.03% | 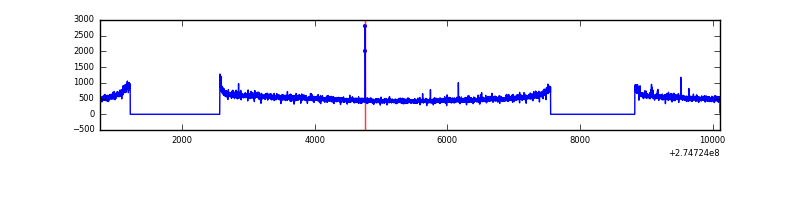 |
| C | 9352 | 6732 | 2 | 2 | 0.02% | 0.03% | 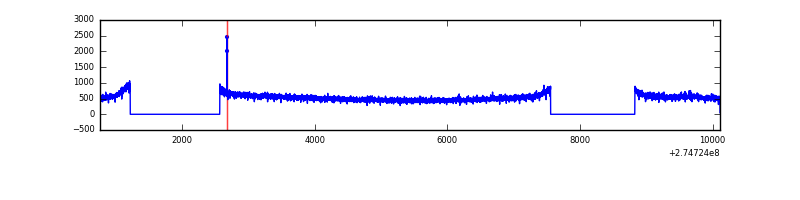 |
| D | 9352 | 6733 | 3 | 3 | 0.03% | 0.04% | 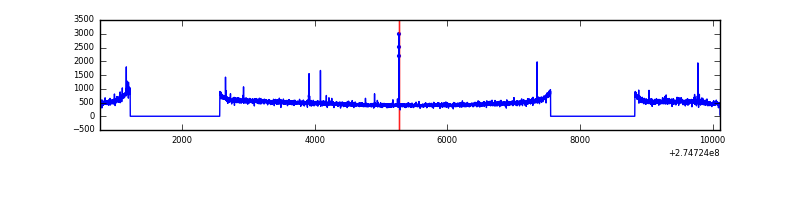 |
Top three noisy pixels from each quadrant. If the there are fewer than three noisy pixels in the level2.evt file, extra rows are filled as -1
| Pixel properties | Quadrant properties | ||||||
|---|---|---|---|---|---|---|---|
| Quadrant | DetID | PixID | Counts | Sigma | Mean | Median | Sigma |
| A | 15 | 223 | 244790 | 1396.98 | 875 | 857 | 174.6 |
| A | 15 | 239 | 49627 | 279.3 | 875 | 857 | 174.6 |
| A | 0 | 226 | 7702 | 39.2 | 875 | 857 | 174.6 |
| B | 12 | 111 | 19649 | 111.89 | 885 | 864 | 167.9 |
| B | 4 | 216 | 18490 | 104.98 | 885 | 864 | 167.9 |
| B | 11 | 111 | 16878 | 95.38 | 885 | 864 | 167.9 |
| C | 14 | 238 | 132689 | 659.45 | 865 | 872 | 199.9 |
| C | 3 | 233 | 38121 | 186.35 | 865 | 872 | 199.9 |
| C | 9 | 15 | 8322 | 37.27 | 865 | 872 | 199.9 |
| D | 2 | 152 | 34365 | 158.9 | 874 | 850 | 210.9 |
| D | 2 | 234 | 21183 | 96.4 | 874 | 850 | 210.9 |
| D | 13 | 238 | 11039 | 48.31 | 874 | 850 | 210.9 |
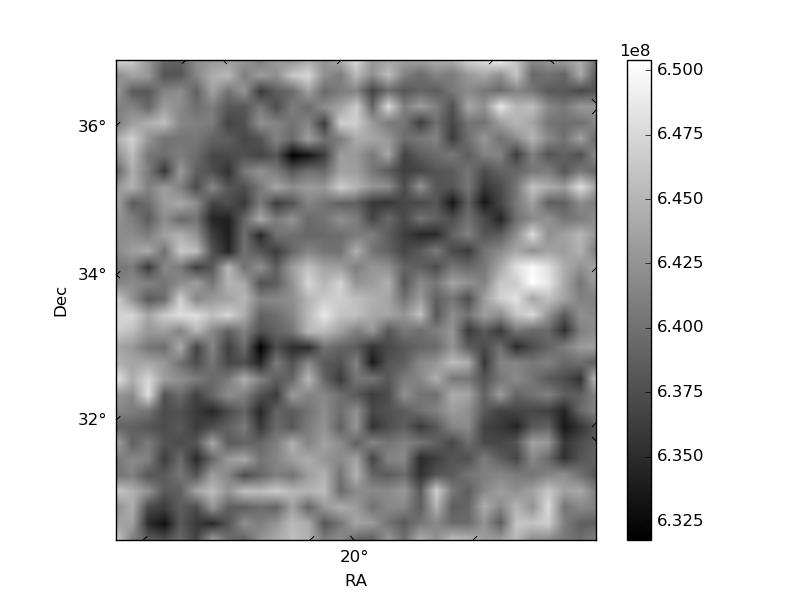
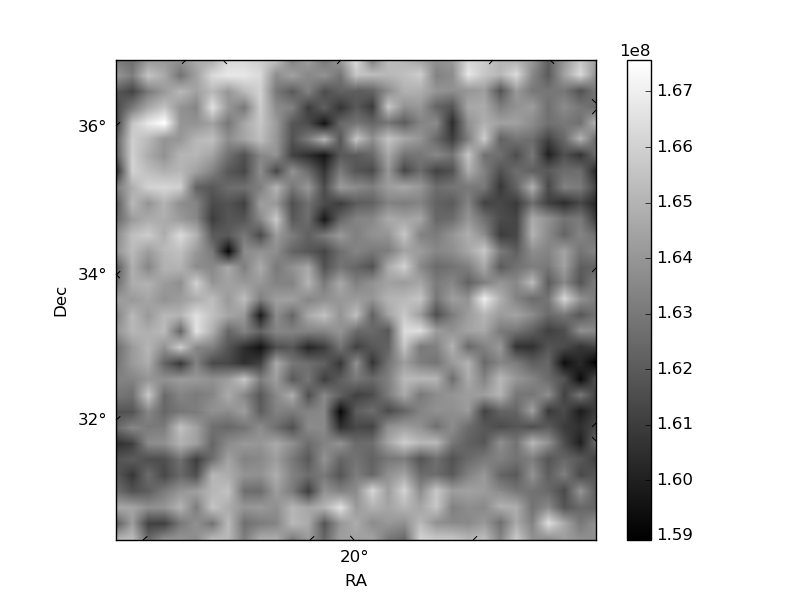
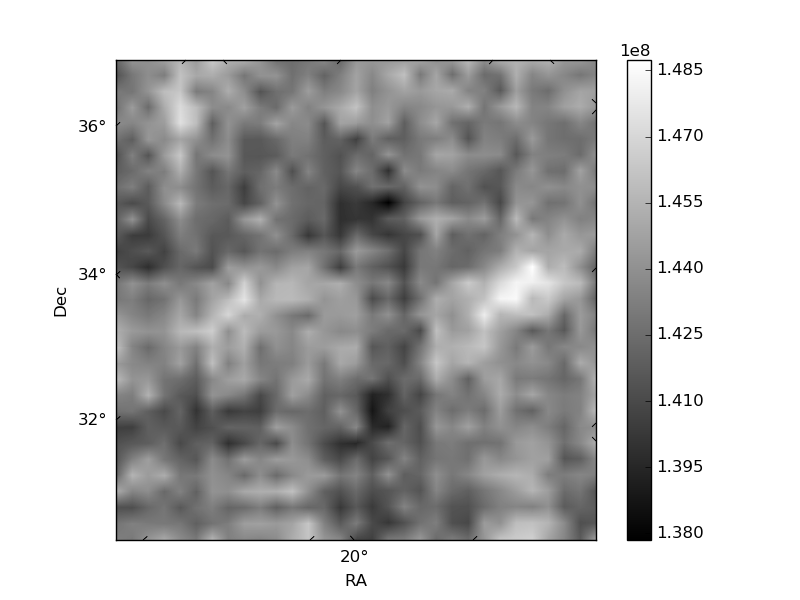
Histogram calculated using DETX and DETY for each event in the final _common_clean file
| Quadrant A | 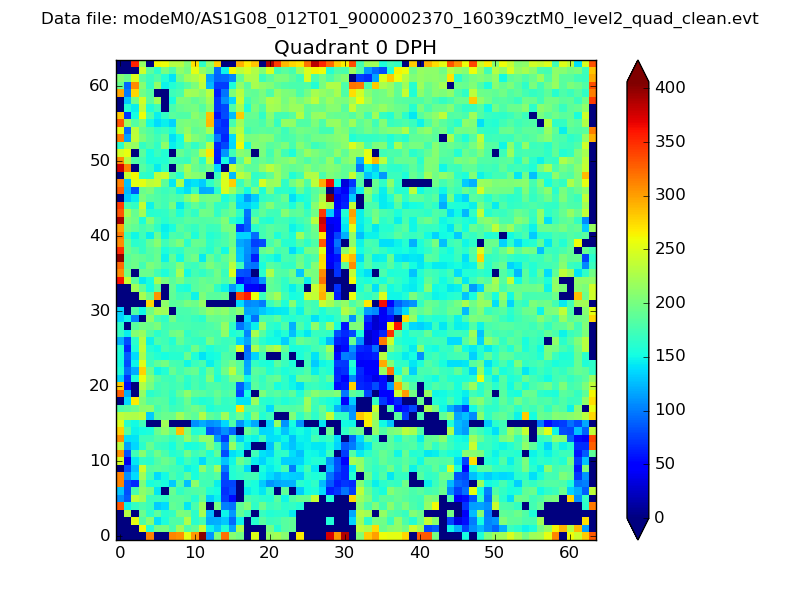 |
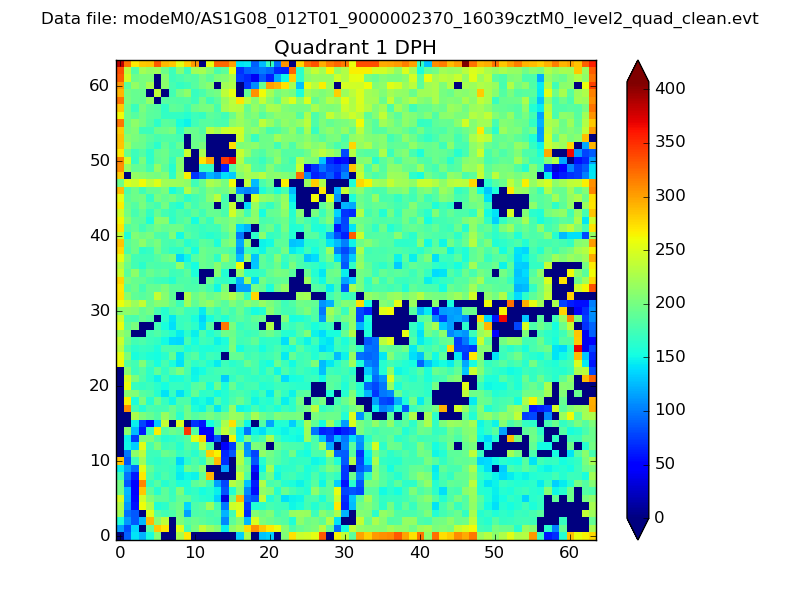 |
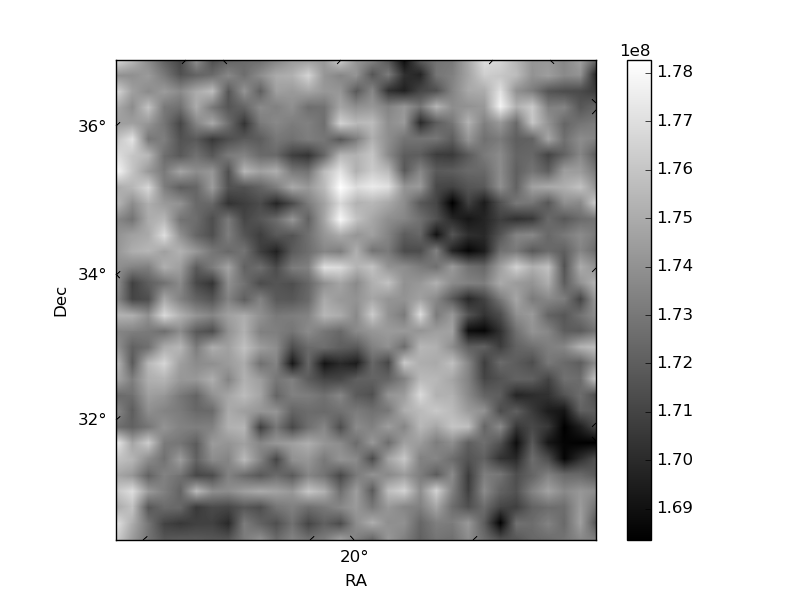
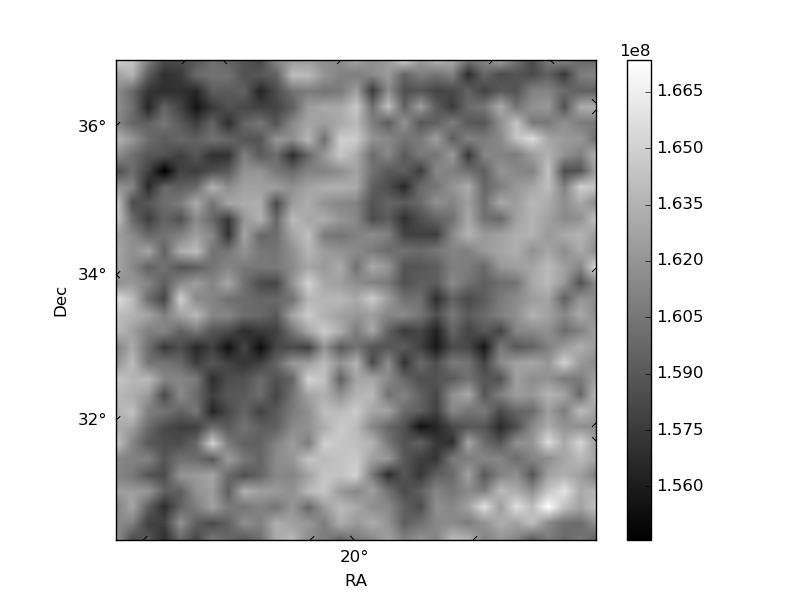
Quadrant B |
|---|---|---|---|
| Quadrant D | 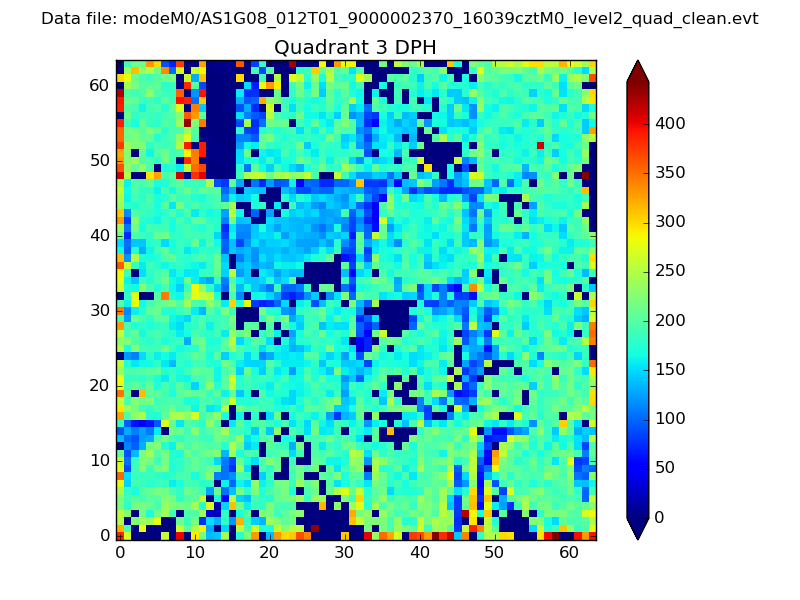 |
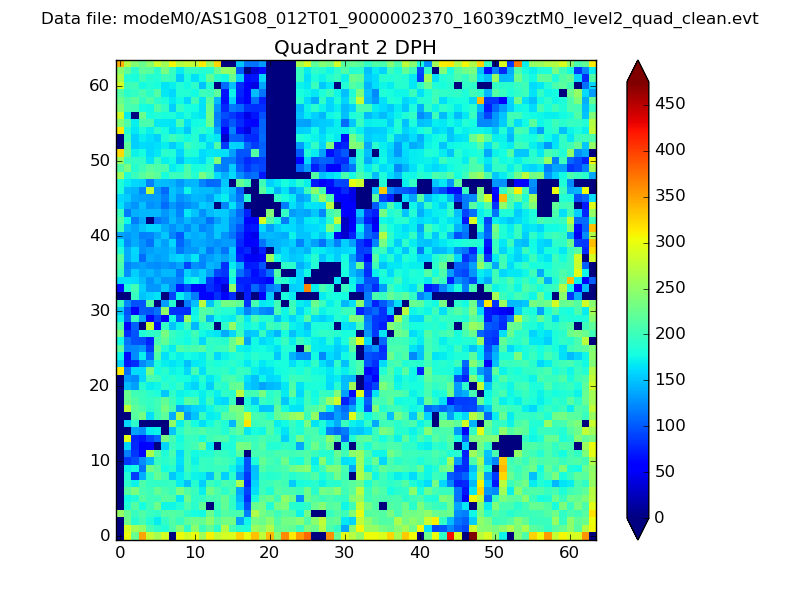 |
Quadrant C |
| Plot type | Count rate plots | Images |
|---|---|---|
| Comparison with Poisson distribution Blue bars denote a histogram of data divided into 1 sec bins. Red curve is a Poisson curve with rate = median count rate of data. |
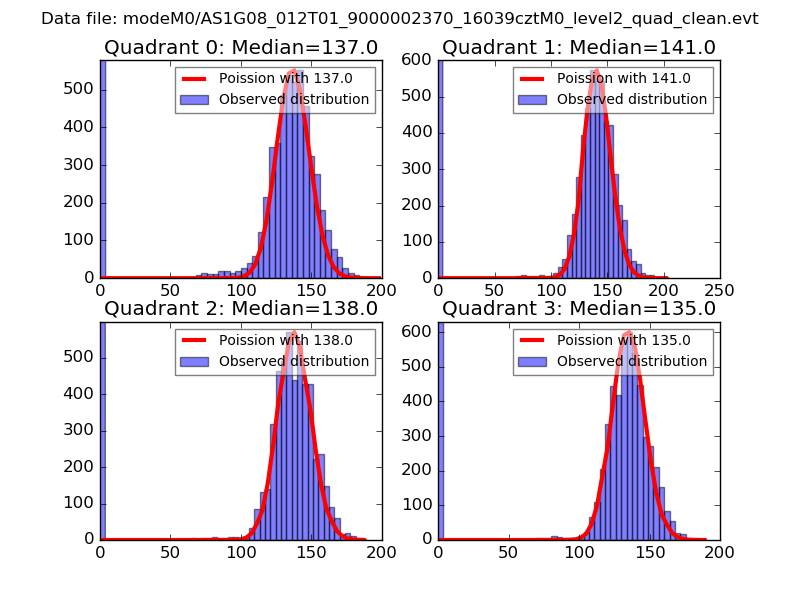 |
 |
| Quadrant-wise count rates Data is divided into 100 sec bins |
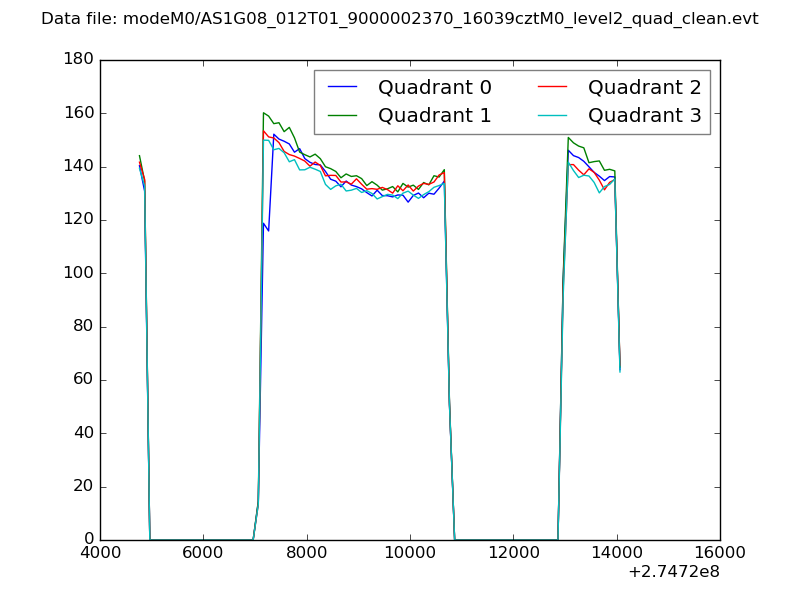 |
|
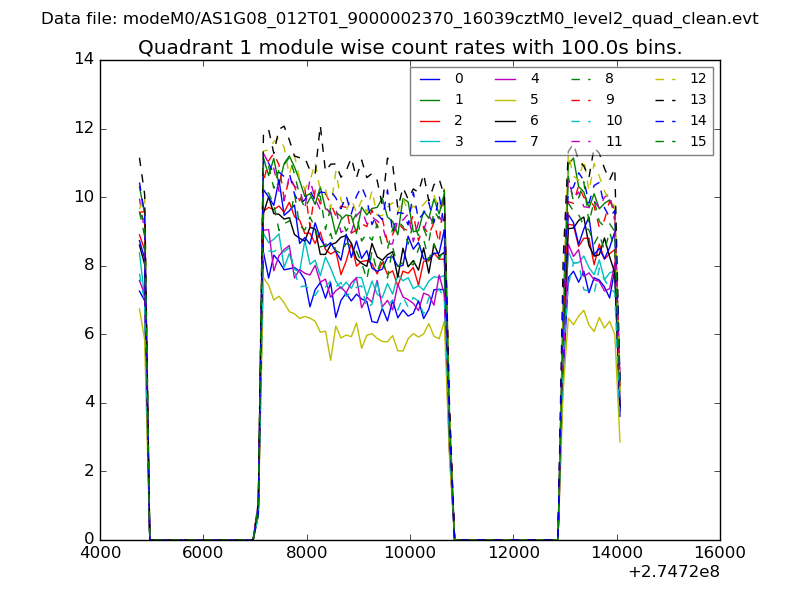
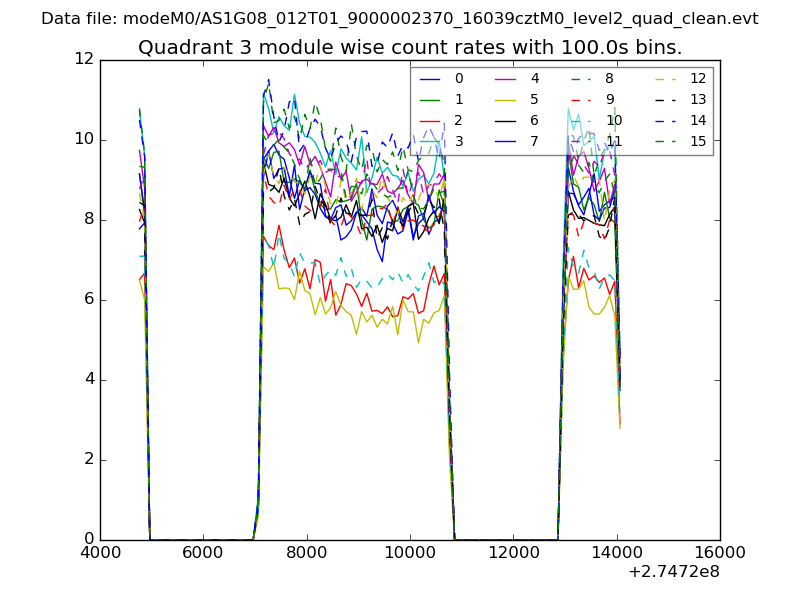
| Module-wise count rates for Quadrant A Data is divided into 100 sec bins |
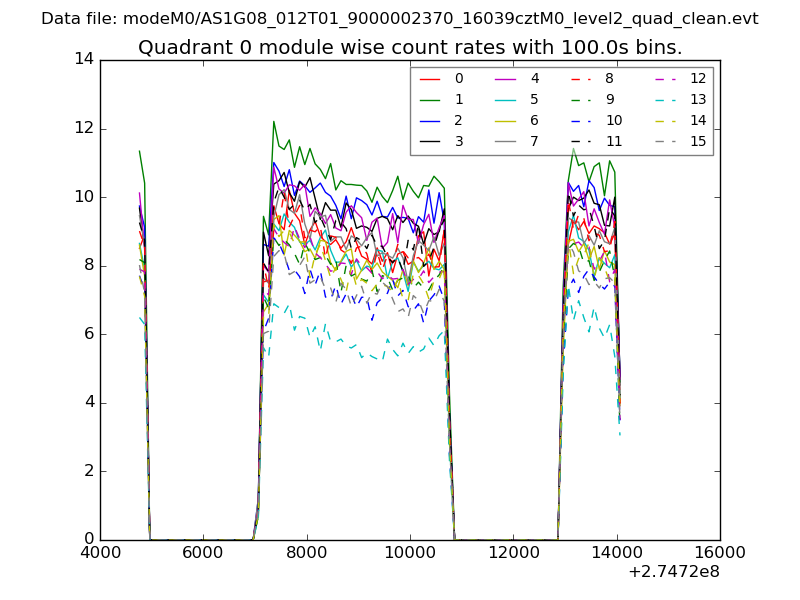 |
 |
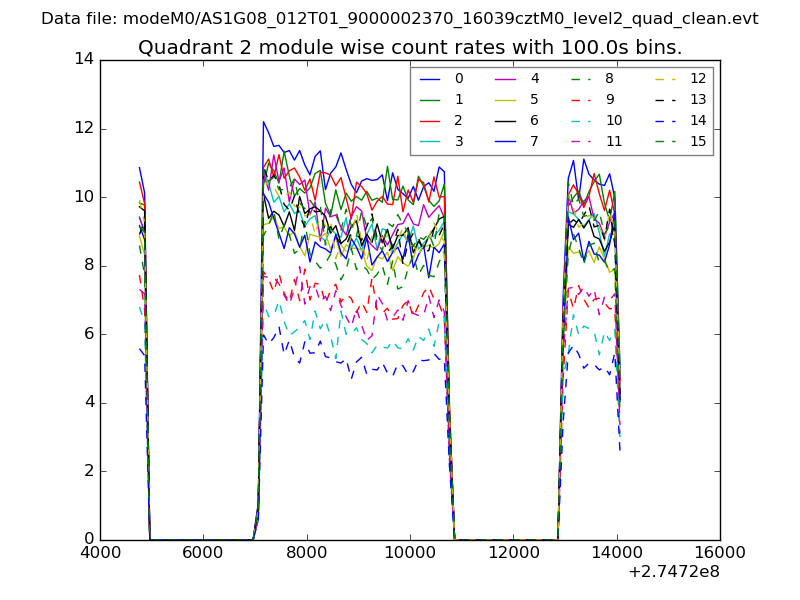
| Module-wise count rates for Quadrant B Data is divided into 100 sec bins |
 |
 |
| Module-wise count rates for Quadrant C Data is divided into 100 sec bins |
 |
 |
| Module-wise count rates for Quadrant D Data is divided into 100 sec bins |
 |
 |
| Parameter | Plot |
|---|---|
| CZT HV Monitor | 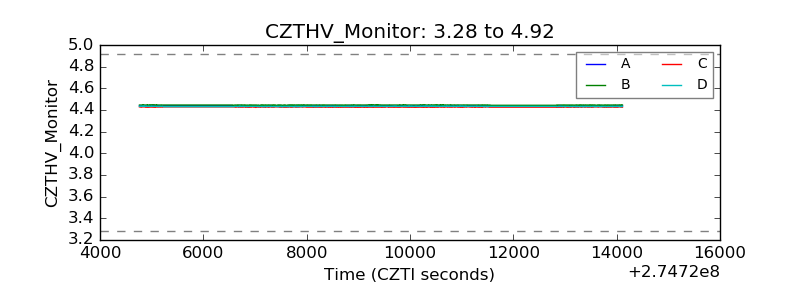 |
| D_VDD | 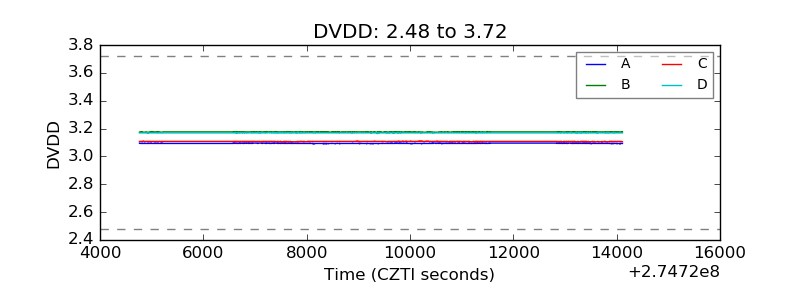 |
| Temperature 1 | 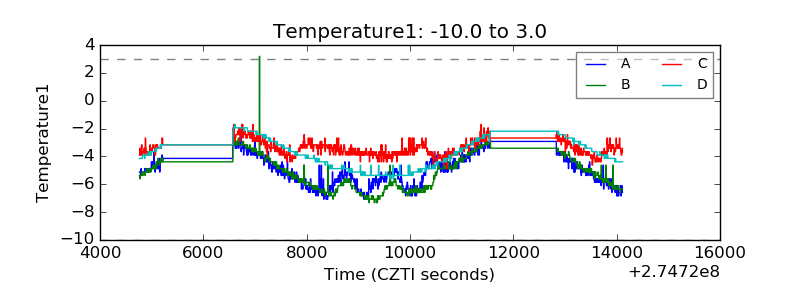 |
| Veto HV Monitor | 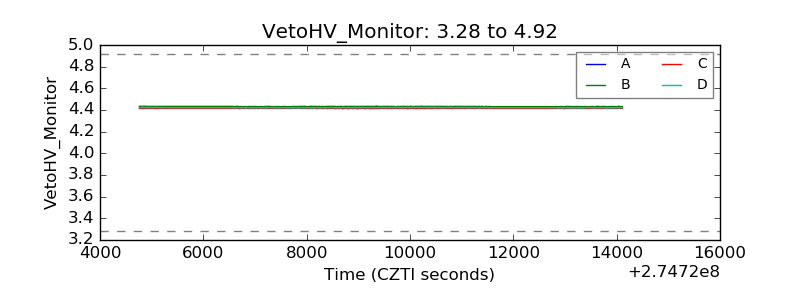 |
| Veto LLD | 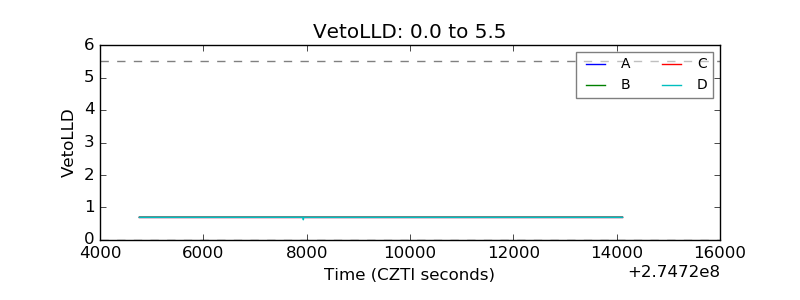 |
| Alpha Counter | 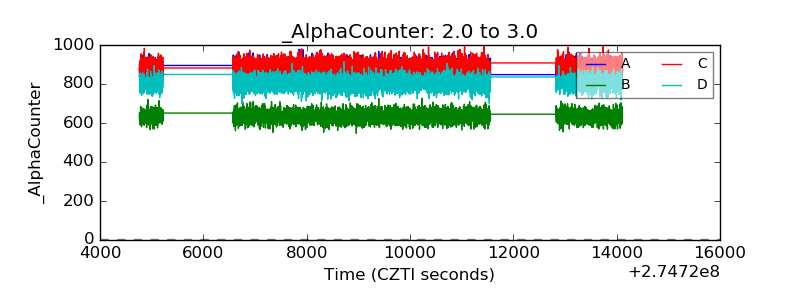 |
| _CPM_Rate | 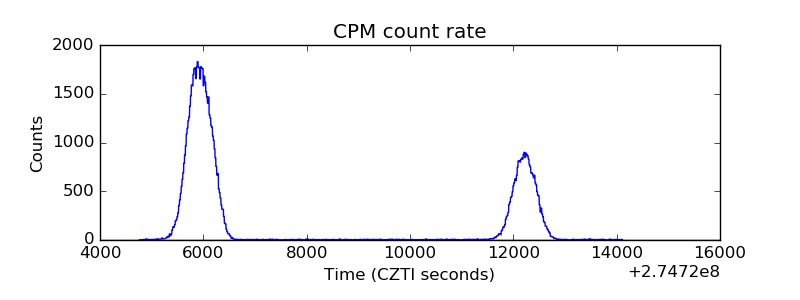 |
| CZT Counter | 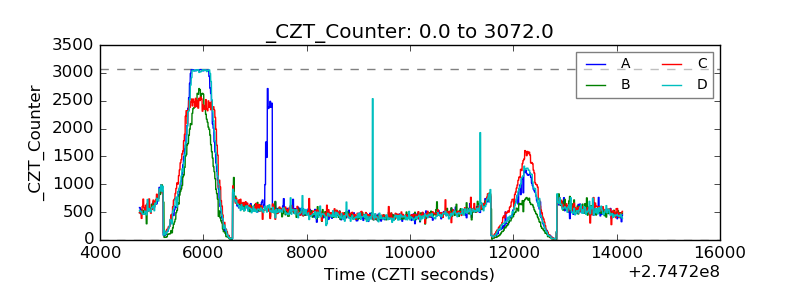 |
| +2.5 Volts monitor | 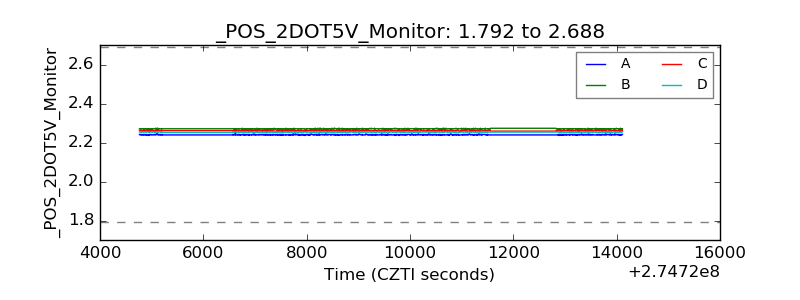 |
| +5 Volts monitor | 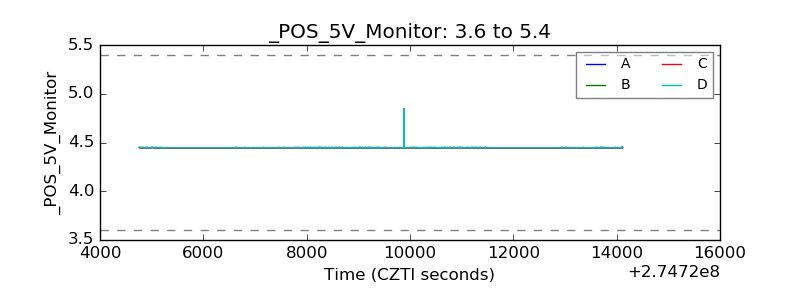 |
| _ROLL_ROT | 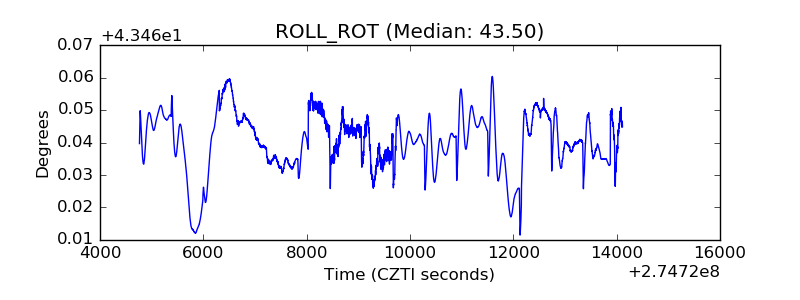 |
| _Roll_DEC | 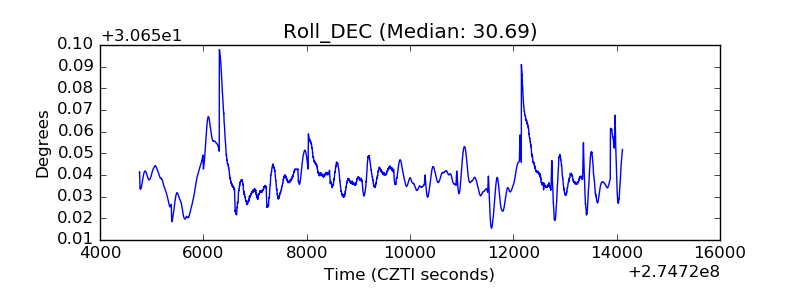 |
| _Roll_RA | 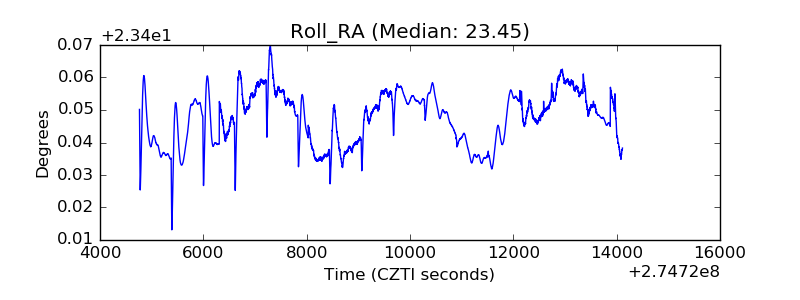 |
| Veto Counter | 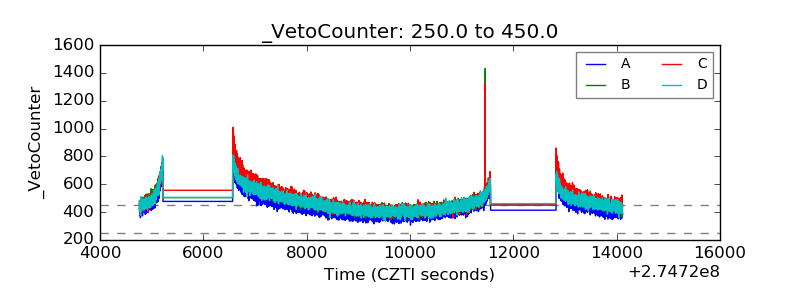 |