| Param | Original file | Final file |
|---|---|---|
| Filename | modeM0/AS1G08_012T01_9000002370_16040cztM0_level2.evt | modeM0/AS1G08_012T01_9000002370_16040cztM0_level2_quad_clean.evt |
| Size (bytes) | 498,850,560 | 104,284,800 |
| Size | 475.7 MB | 99.5 MB |
| Events in quadrant A | 3,598,047 | 658,518 |
| Events in quadrant B | 3,734,418 | 673,983 |
| Events in quadrant C | 3,742,958 | 658,854 |
| Events in quadrant D | 3,525,717 | 647,975 |
| Mode M0 | |||
|---|---|---|---|
| Quadrant | BADHDUFLAG | Total packets | Discarded packets |
| A | 0 | 15609 | 3 |
| B | 0 | 15882 | 2 |
| C | 0 | 15767 | 2 |
| D | 0 | 15578 | 2 |
| Mode M9 | |||
|---|---|---|---|
| Quadrant | BADHDUFLAG | Total packets | Discarded packets |
| A | 0 | 22 | 0 |
| B | 0 | 22 | 0 |
| C | 0 | 22 | 0 |
| D | 0 | 22 | 0 |
| Mode SS | |||
|---|---|---|---|
| Quadrant | BADHDUFLAG | Total packets | Discarded packets |
| A | 0 | 154 | 0 |
| B | 0 | 154 | 0 |
| C | 0 | 154 | 0 |
| D | 0 | 154 | 0 |
| Quadrant | Total seconds | Saturated seconds | Saturation percentage |
|---|---|---|---|
| A | 7455 | 47 | 0.630449% |
| B | 7455 | 80 | 1.073105% |
| C | 7455 | 105 | 1.408451% |
| D | 7455 | 35 | 0.469484% |
Noise dominated data is calculated using 1-second bins in cleaned event files. If a bin has >2000 counts, and if more than 50% of those come from <1% of pixels, then it is considered to be noise-dominated and hence unusable.
| Quadrant | # 1 sec bins | Bins with >0 counts | Bins with >2000 counts | High rate bins dominated by noise | Noise dominated (total time) | Noise dominated (detector-on time) | Marked lightcurve |
|---|---|---|---|---|---|---|---|
| A | 9656 | 7458 | 0 | 0 | 0.00% | 0.00% | 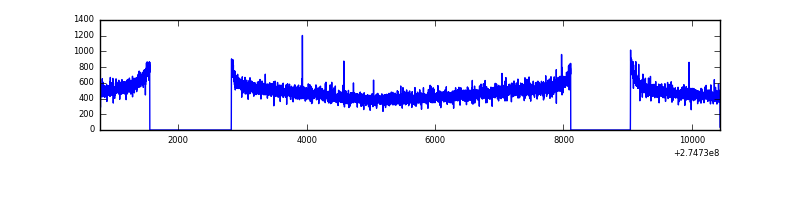 |
| B | 9656 | 7457 | 1 | 1 | 0.01% | 0.01% | 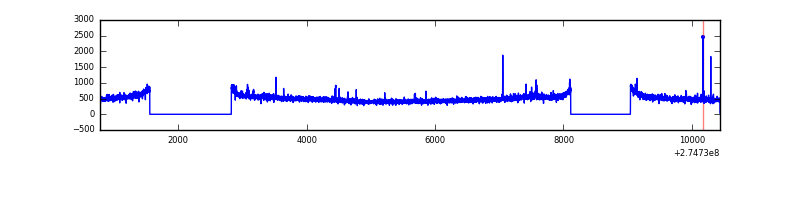 |
| C | 9656 | 7457 | 0 | 0 | 0.00% | 0.00% | 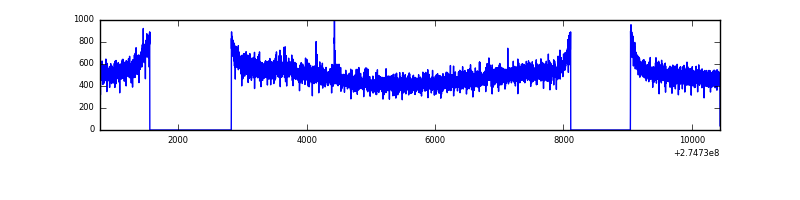 |
| D | 9656 | 7458 | 1 | 1 | 0.01% | 0.01% |  |
Top three noisy pixels from each quadrant. If the there are fewer than three noisy pixels in the level2.evt file, extra rows are filled as -1
| Pixel properties | Quadrant properties | ||||||
|---|---|---|---|---|---|---|---|
| Quadrant | DetID | PixID | Counts | Sigma | Mean | Median | Sigma |
| A | 0 | 226 | 8214 | 38.9 | 933 | 914 | 187.7 |
| A | 12 | 194 | 6941 | 32.12 | 933 | 914 | 187.7 |
| A | 3 | 137 | 6702 | 30.84 | 933 | 914 | 187.7 |
| B | 12 | 111 | 21219 | 113.55 | 938 | 916 | 178.8 |
| B | 4 | 216 | 18635 | 99.1 | 938 | 916 | 178.8 |
| B | 11 | 111 | 18123 | 96.24 | 938 | 916 | 178.8 |
| C | 14 | 238 | 139180 | 649.62 | 911 | 916 | 212.8 |
| C | 3 | 233 | 37456 | 171.68 | 911 | 916 | 212.8 |
| C | 7 | 247 | 7946 | 33.03 | 911 | 916 | 212.8 |
| D | 2 | 152 | 32420 | 142.45 | 920 | 894 | 221.3 |
| D | 2 | 234 | 23057 | 100.14 | 920 | 894 | 221.3 |
| D | 14 | 226 | 9155 | 37.33 | 920 | 894 | 221.3 |
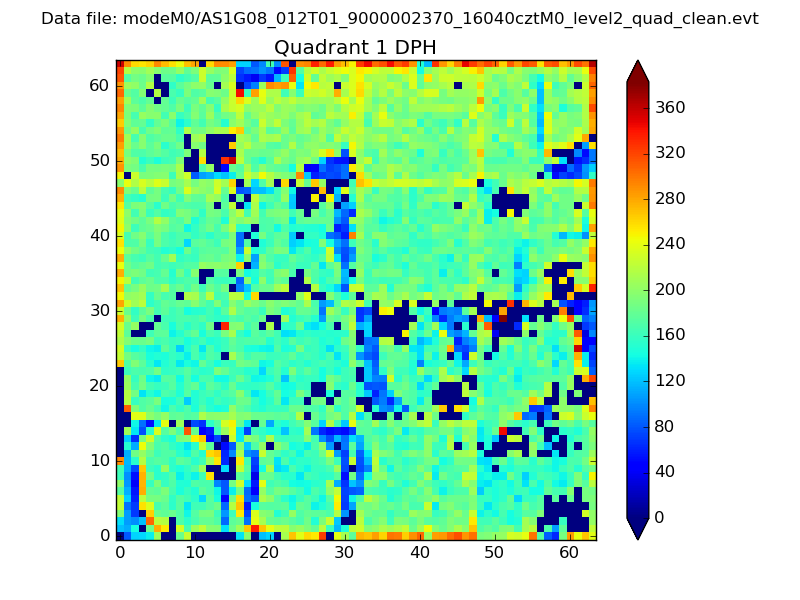
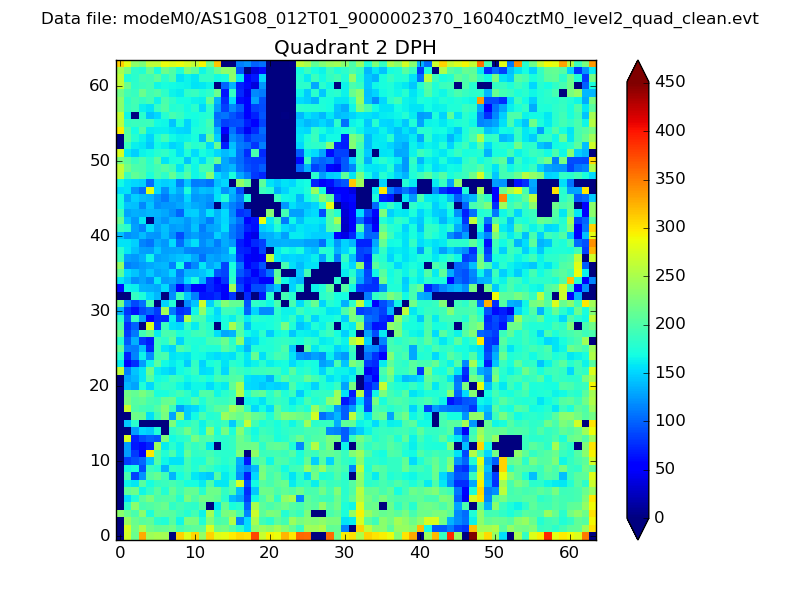
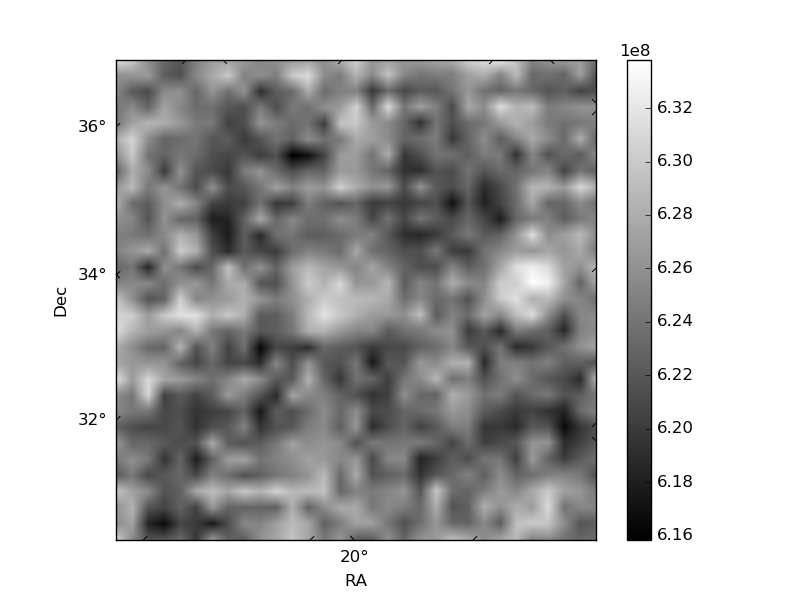
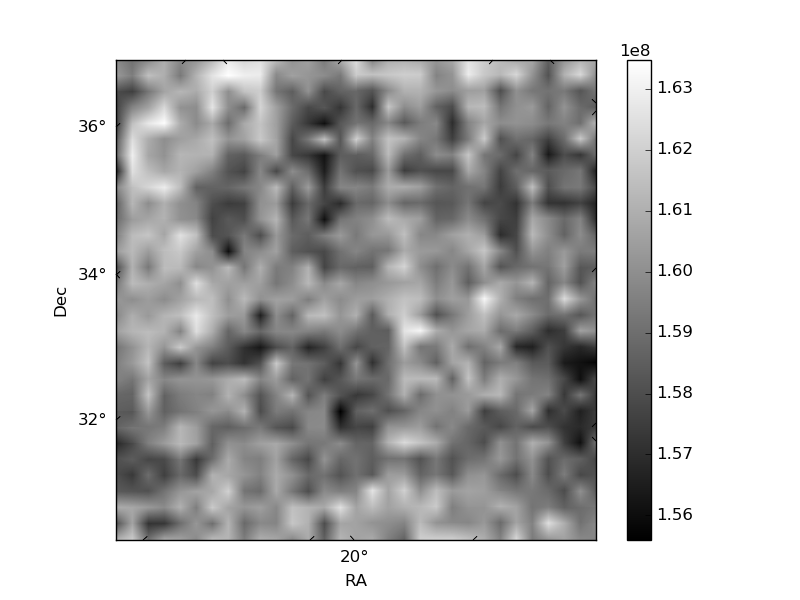
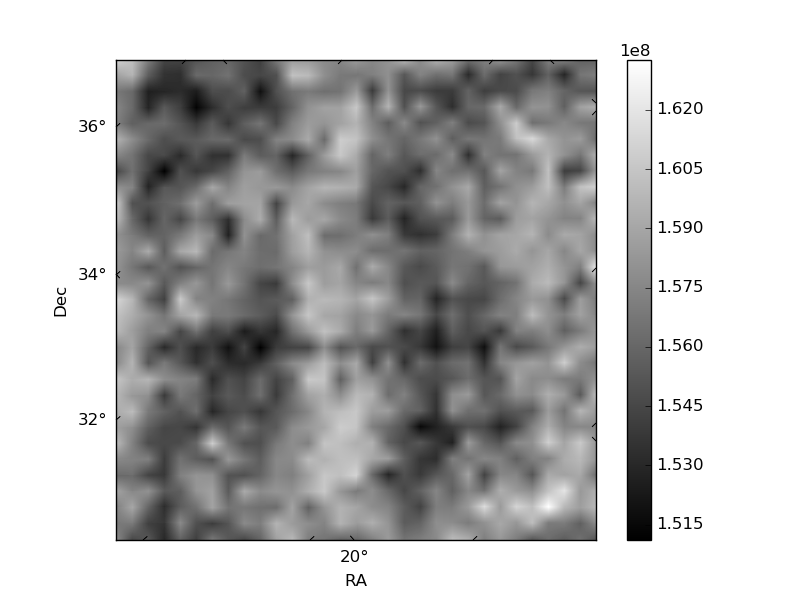
Histogram calculated using DETX and DETY for each event in the final _common_clean file
| Quadrant A | 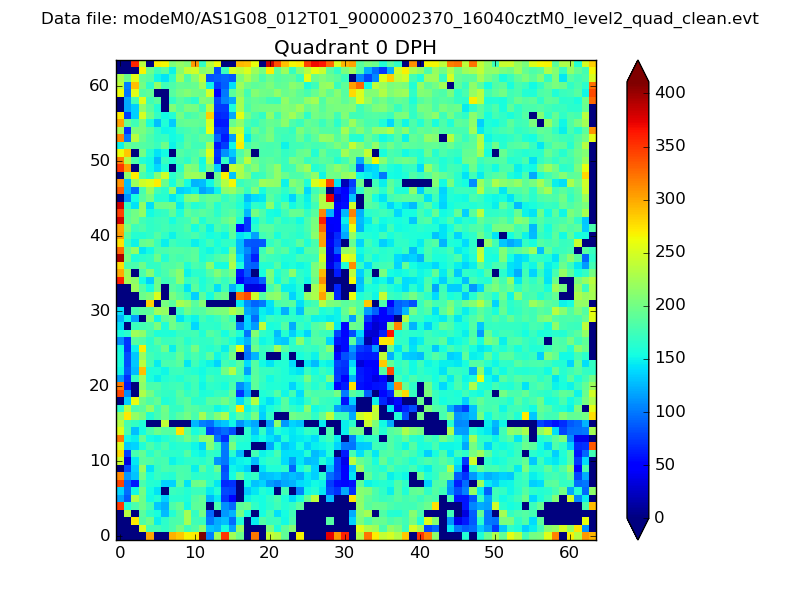 |
 |
Quadrant B |
|---|---|---|---|
| Quadrant D | 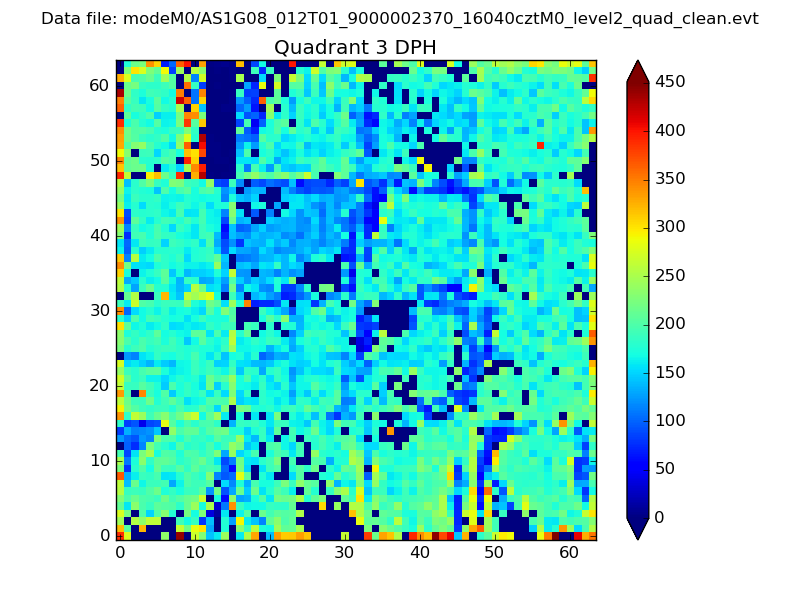 |
 |
Quadrant C |
| Plot type | Count rate plots | Images |
|---|---|---|
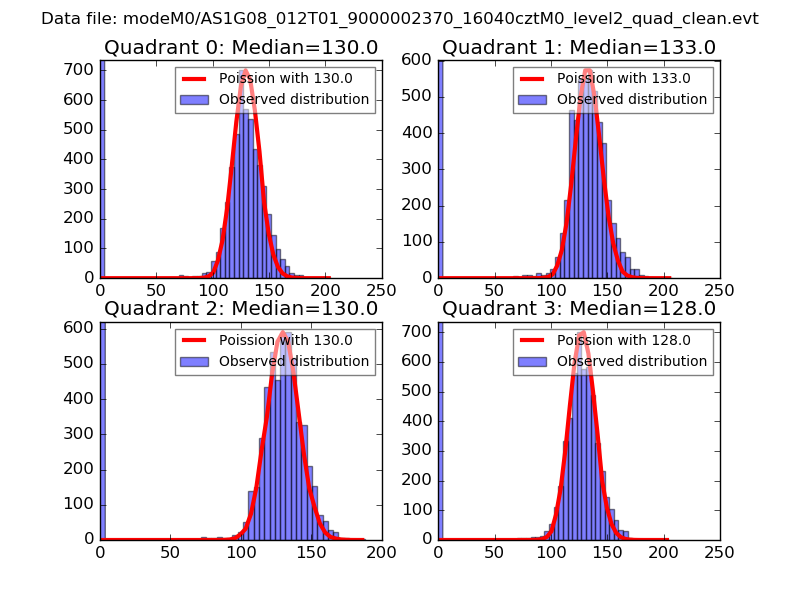
| Comparison with Poisson distribution Blue bars denote a histogram of data divided into 1 sec bins. Red curve is a Poisson curve with rate = median count rate of data. |
 |
 |
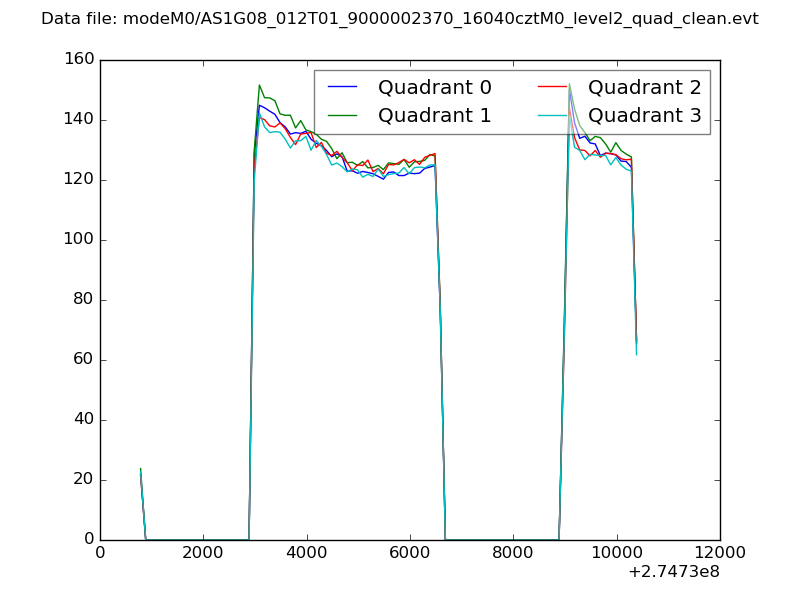
| Quadrant-wise count rates Data is divided into 100 sec bins |
 |
|
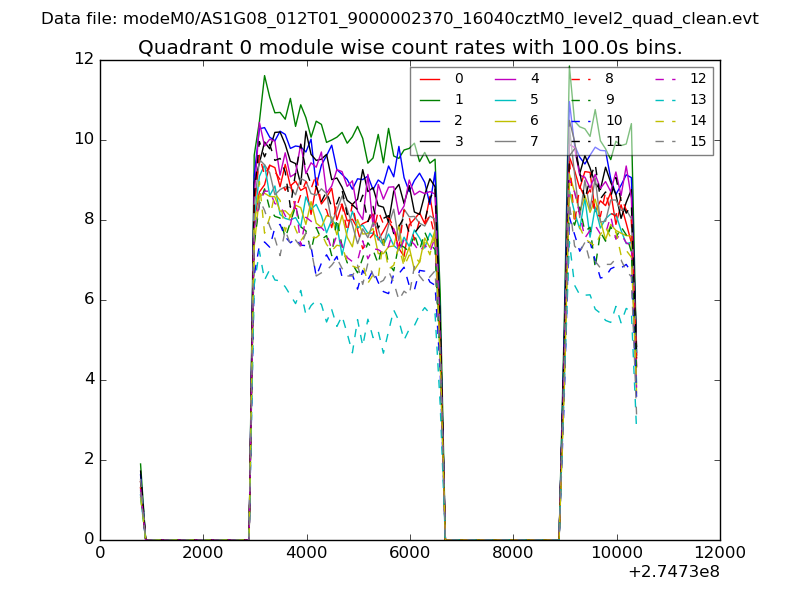
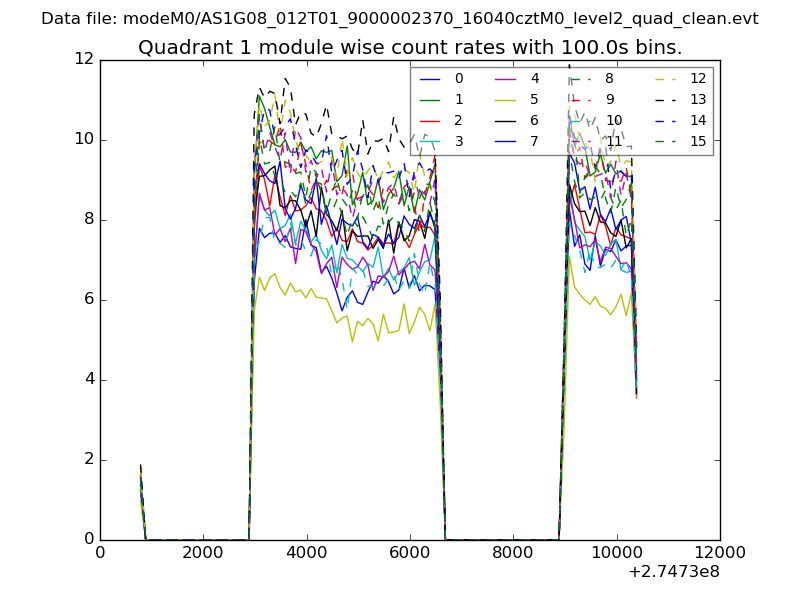
| Module-wise count rates for Quadrant A Data is divided into 100 sec bins |
 |
 |
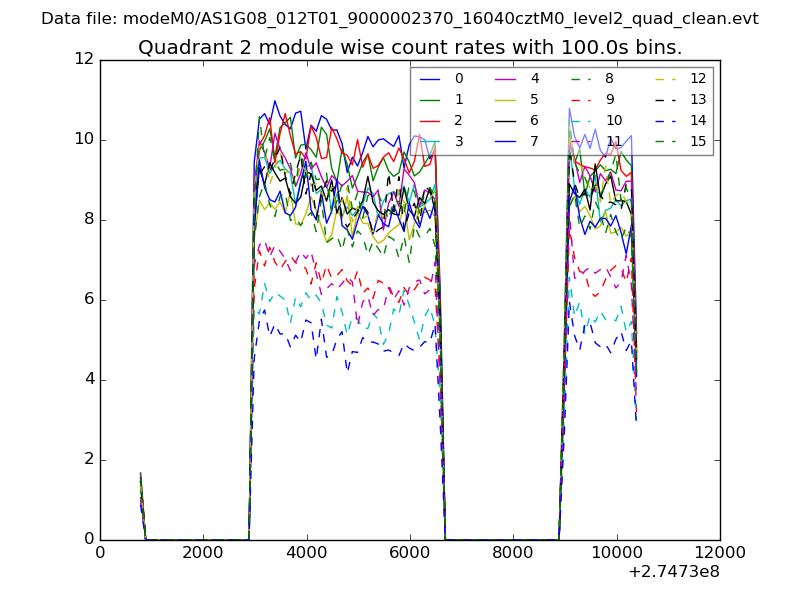
| Module-wise count rates for Quadrant B Data is divided into 100 sec bins |
 |
 |
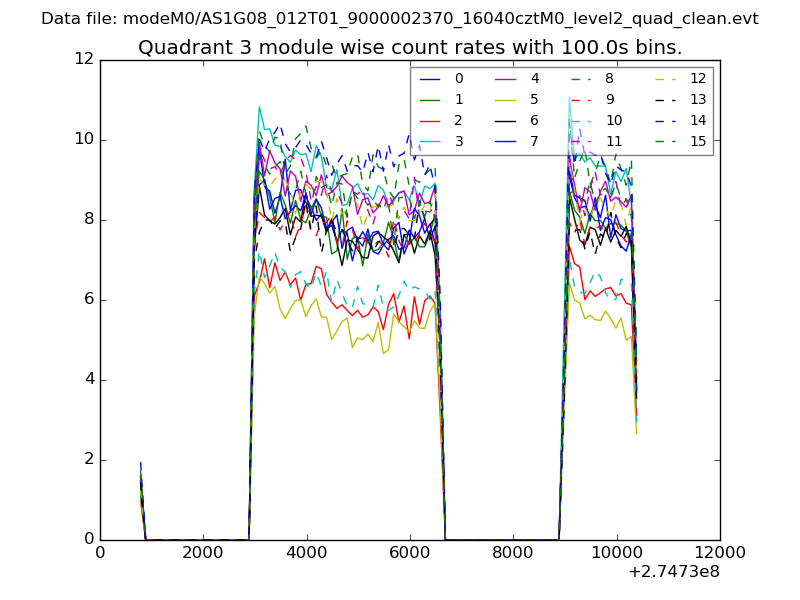
| Module-wise count rates for Quadrant C Data is divided into 100 sec bins |
 |
 |
| Module-wise count rates for Quadrant D Data is divided into 100 sec bins |
 |
 |
| Parameter | Plot |
|---|---|
| CZT HV Monitor | 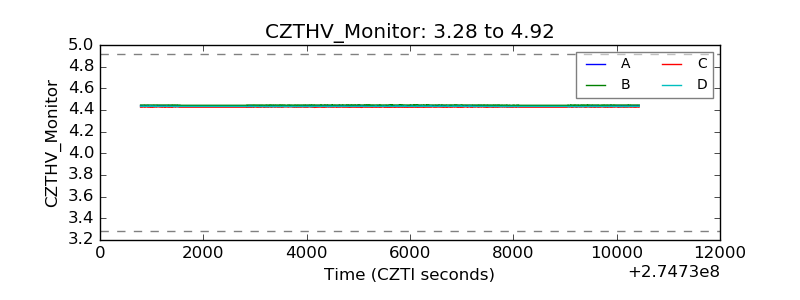 |
| D_VDD | 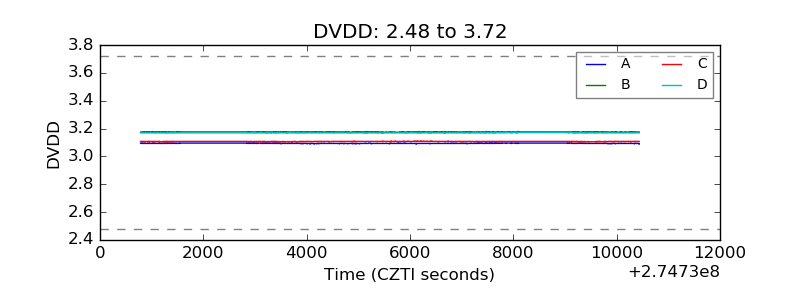 |
| Temperature 1 | 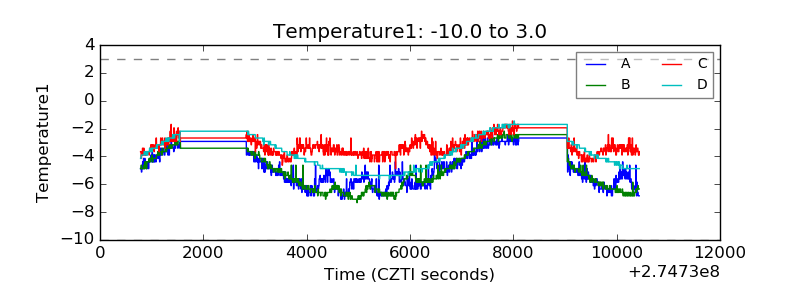 |
| Veto HV Monitor | 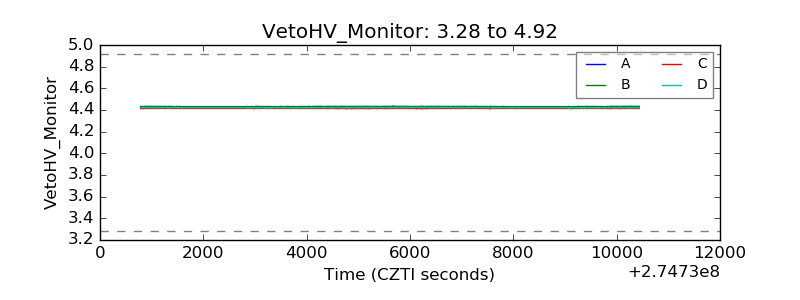 |
| Veto LLD | 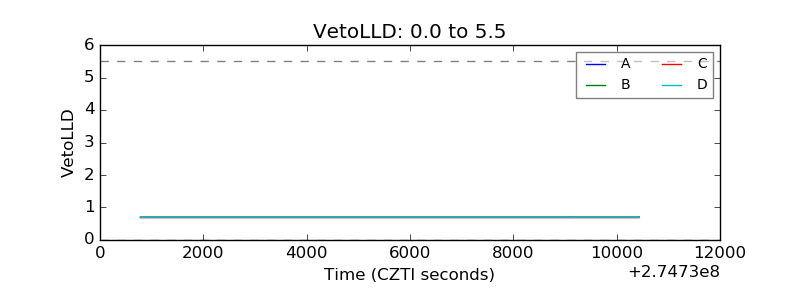 |
| Alpha Counter | 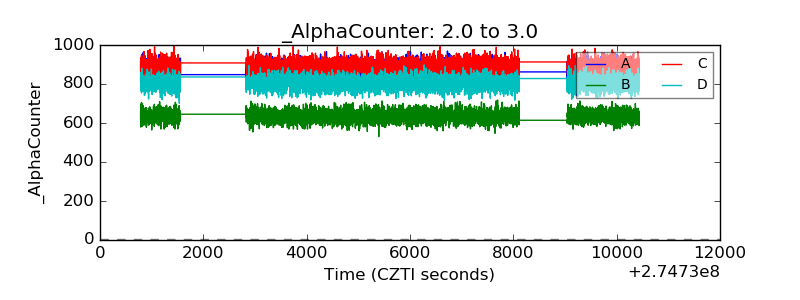 |
| _CPM_Rate | 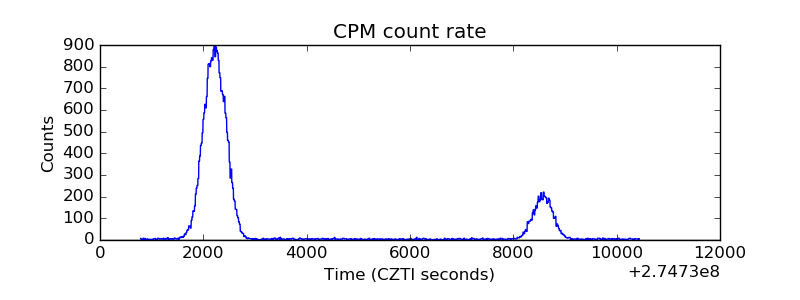 |
| CZT Counter | 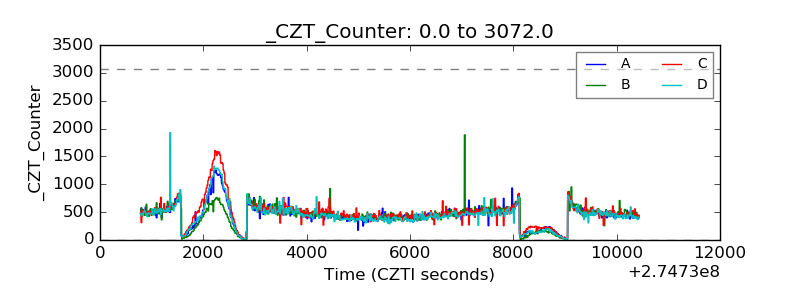 |
| +2.5 Volts monitor |  |
| +5 Volts monitor |  |
| _ROLL_ROT | 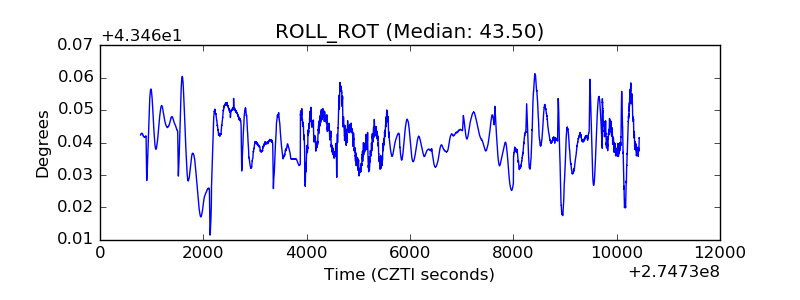 |
| _Roll_DEC | 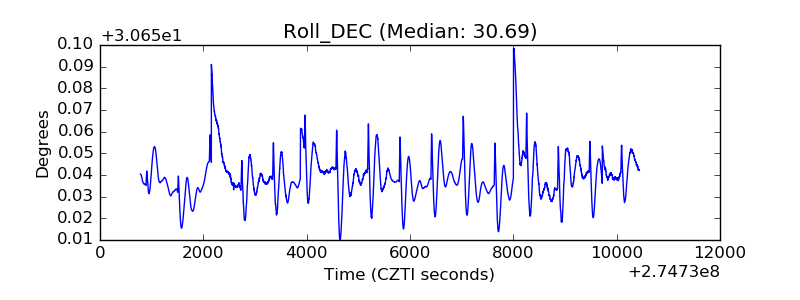 |
| _Roll_RA | 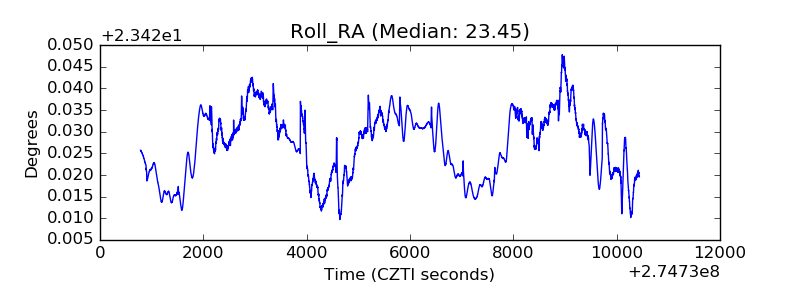 |
| Veto Counter | 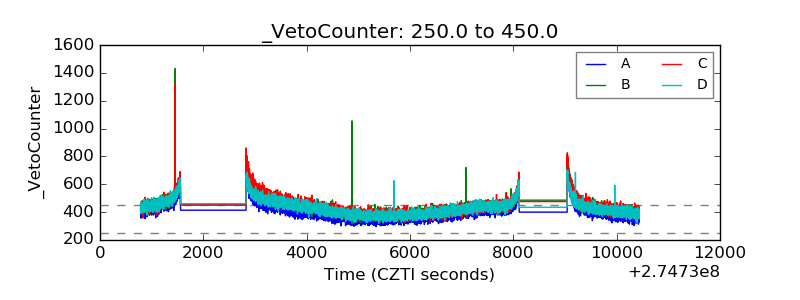 |