| Param | Original file | Final file |
|---|---|---|
| Filename | modeM0/AS1G08_012T01_9000002370_16041cztM0_level2.evt | modeM0/AS1G08_012T01_9000002370_16041cztM0_level2_quad_clean.evt |
| Size (bytes) | 548,997,120 | 100,765,440 |
| Size | 523.6 MB | 96.1 MB |
| Events in quadrant A | 3,980,407 | 618,133 |
| Events in quadrant B | 4,146,884 | 632,145 |
| Events in quadrant C | 4,055,019 | 618,598 |
| Events in quadrant D | 3,881,480 | 606,892 |
| Mode M0 | |||
|---|---|---|---|
| Quadrant | BADHDUFLAG | Total packets | Discarded packets |
| A | 0 | 17334 | 3 |
| B | 0 | 17707 | 2 |
| C | 0 | 17271 | 2 |
| D | 0 | 17269 | 2 |
| Mode M9 | |||
|---|---|---|---|
| Quadrant | BADHDUFLAG | Total packets | Discarded packets |
| A | 0 | 14 | 0 |
| B | 0 | 14 | 0 |
| C | 0 | 14 | 0 |
| D | 0 | 14 | 0 |
| Mode SS | |||
|---|---|---|---|
| Quadrant | BADHDUFLAG | Total packets | Discarded packets |
| A | 0 | 170 | 0 |
| B | 0 | 170 | 0 |
| C | 0 | 170 | 0 |
| D | 0 | 170 | 0 |
| Quadrant | Total seconds | Saturated seconds | Saturation percentage |
|---|---|---|---|
| A | 8287 | 51 | 0.615422% |
| B | 8287 | 82 | 0.989502% |
| C | 8287 | 117 | 1.411850% |
| D | 8287 | 34 | 0.410281% |
Noise dominated data is calculated using 1-second bins in cleaned event files. If a bin has >2000 counts, and if more than 50% of those come from <1% of pixels, then it is considered to be noise-dominated and hence unusable.
| Quadrant | # 1 sec bins | Bins with >0 counts | Bins with >2000 counts | High rate bins dominated by noise | Noise dominated (total time) | Noise dominated (detector-on time) | Marked lightcurve |
|---|---|---|---|---|---|---|---|
| A | 9723 | 8289 | 0 | 0 | 0.00% | 0.00% | 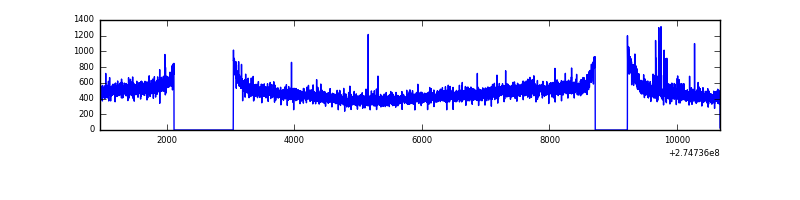 |
| B | 9723 | 8290 | 3 | 3 | 0.03% | 0.04% | 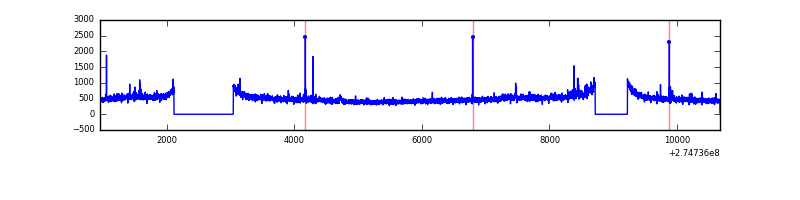 |
| C | 9723 | 8290 | 0 | 0 | 0.00% | 0.00% | 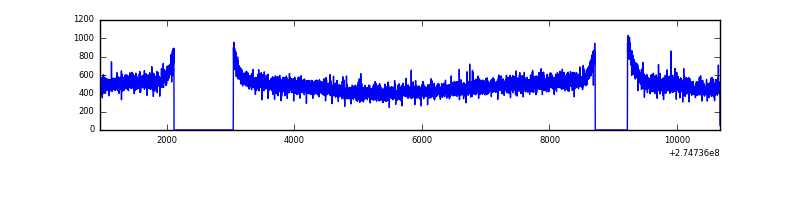 |
| D | 9723 | 8290 | 4 | 4 | 0.04% | 0.05% | 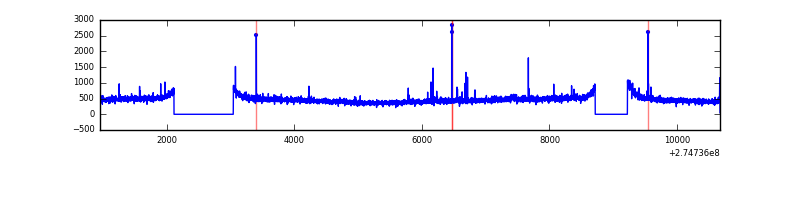 |
Top three noisy pixels from each quadrant. If the there are fewer than three noisy pixels in the level2.evt file, extra rows are filled as -1
| Pixel properties | Quadrant properties | ||||||
|---|---|---|---|---|---|---|---|
| Quadrant | DetID | PixID | Counts | Sigma | Mean | Median | Sigma |
| A | 12 | 96 | 19971 | 91.27 | 1026 | 1006 | 207.8 |
| A | 0 | 226 | 9140 | 39.14 | 1026 | 1006 | 207.8 |
| A | 12 | 194 | 7653 | 31.99 | 1026 | 1006 | 207.8 |
| B | 0 | 245 | 38899 | 193.69 | 1029 | 1003 | 195.7 |
| B | 0 | 229 | 25883 | 127.16 | 1029 | 1003 | 195.7 |
| B | 12 | 111 | 23441 | 114.68 | 1029 | 1003 | 195.7 |
| C | 14 | 238 | 153253 | 648.71 | 993 | 1002 | 234.7 |
| C | 3 | 233 | 22183 | 90.25 | 993 | 1002 | 234.7 |
| C | 13 | 61 | 6972 | 25.44 | 993 | 1002 | 234.7 |
| D | 13 | 232 | 32867 | 129.64 | 1007 | 979 | 246.0 |
| D | 2 | 152 | 27678 | 108.55 | 1007 | 979 | 246.0 |
| D | 2 | 234 | 27266 | 106.87 | 1007 | 979 | 246.0 |
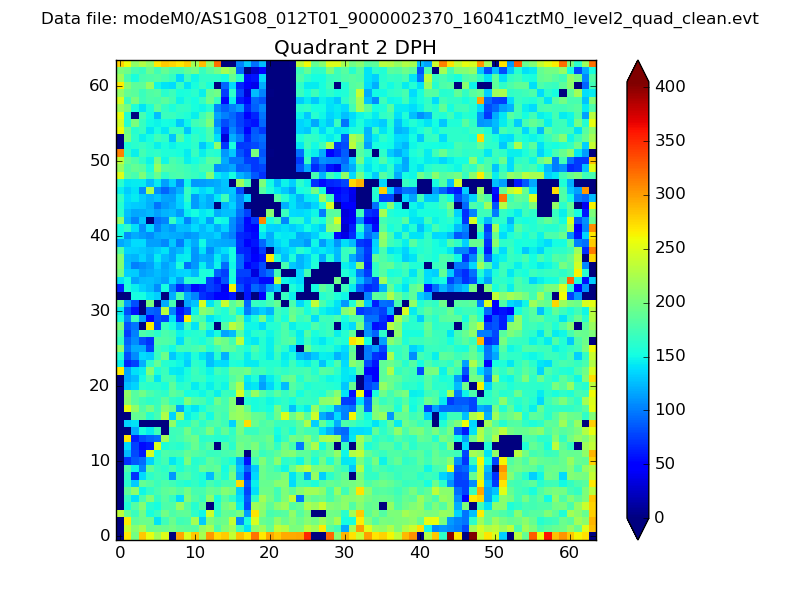
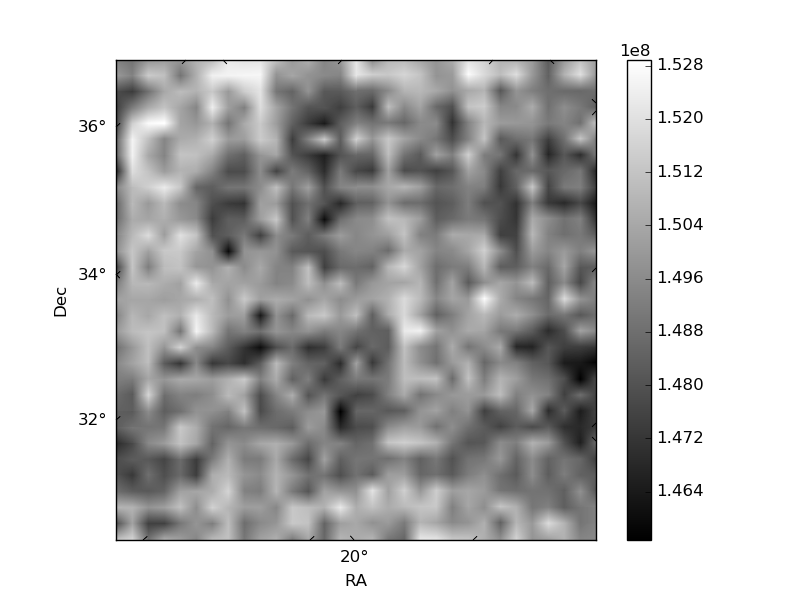
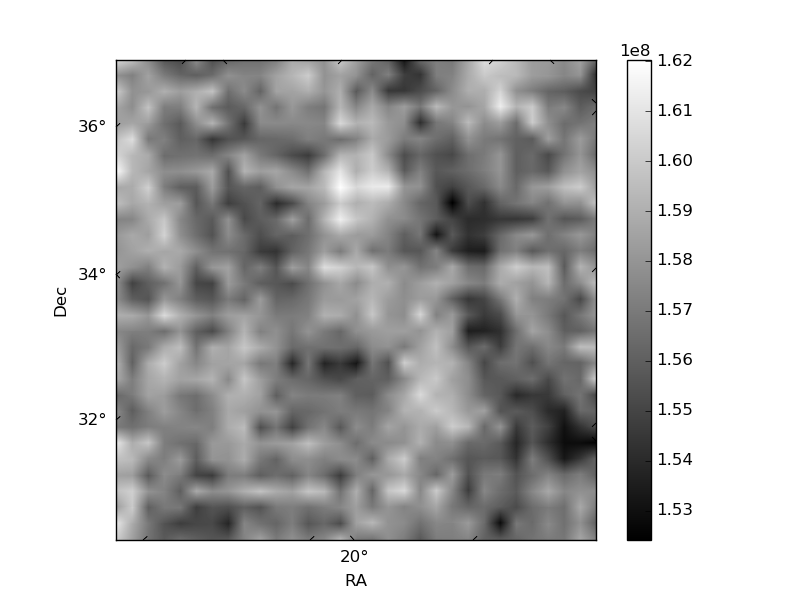
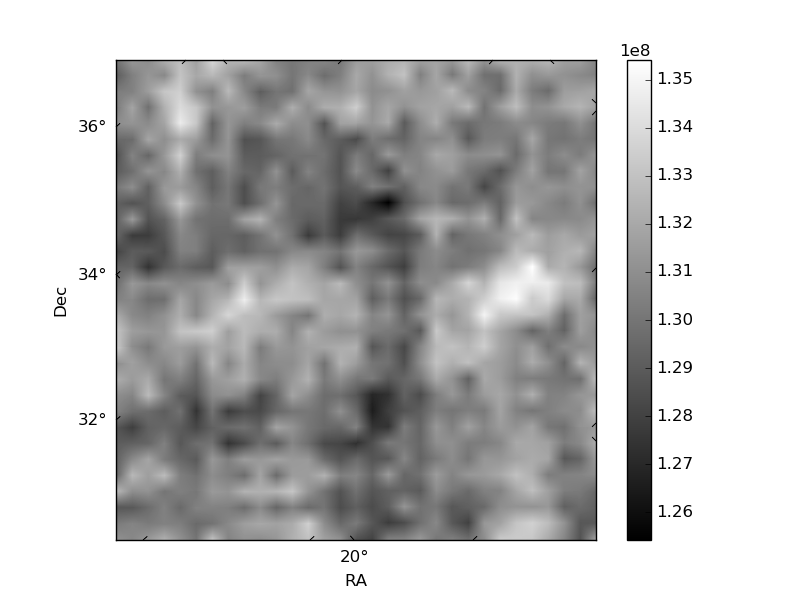
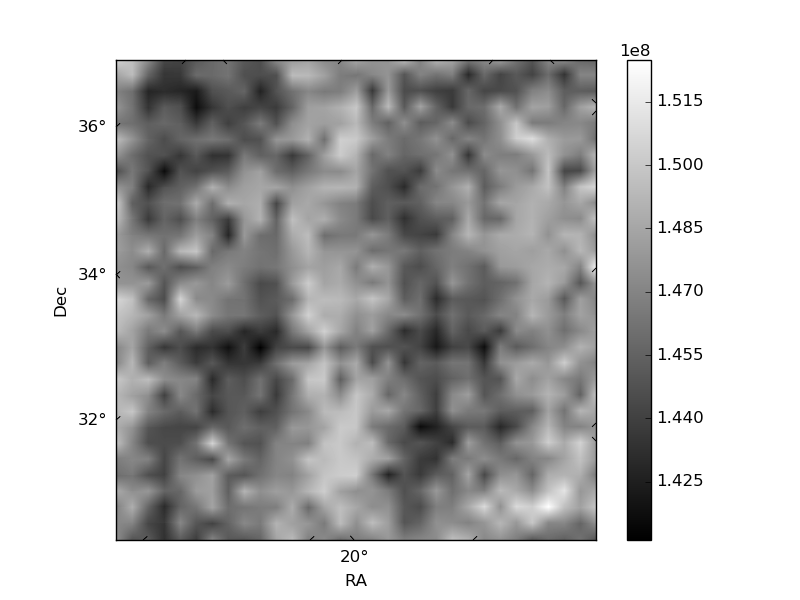
Histogram calculated using DETX and DETY for each event in the final _common_clean file
| Quadrant A | 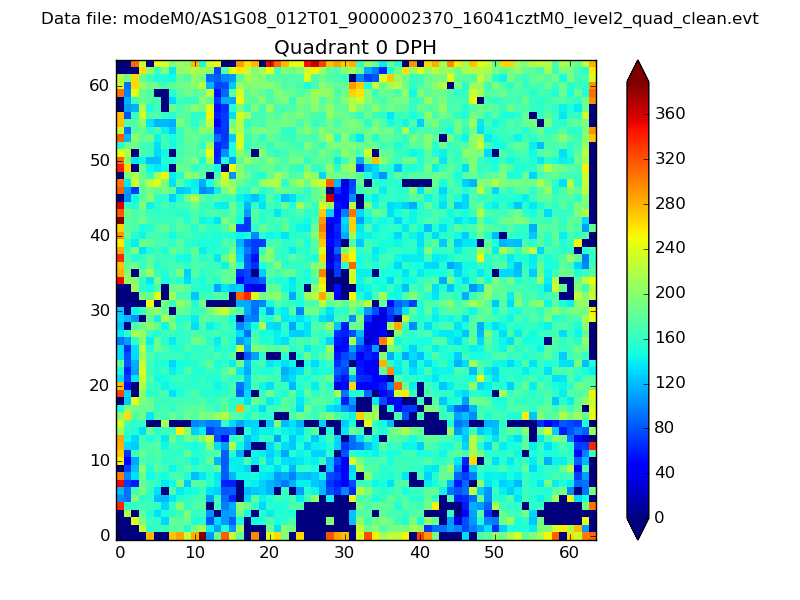 |
 |
Quadrant B |
|---|---|---|---|
| Quadrant D |  |
 |
Quadrant C |
| Plot type | Count rate plots | Images |
|---|---|---|
| Comparison with Poisson distribution Blue bars denote a histogram of data divided into 1 sec bins. Red curve is a Poisson curve with rate = median count rate of data. |
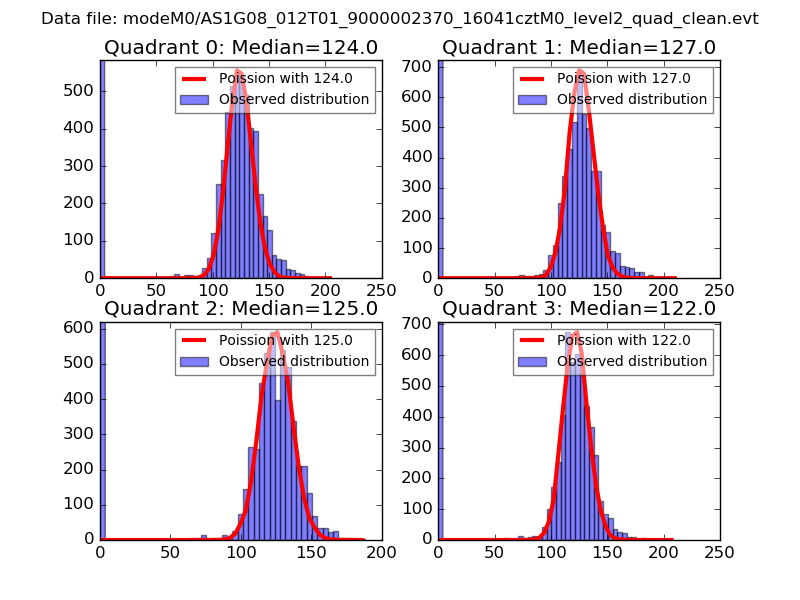 |
 |
| Quadrant-wise count rates Data is divided into 100 sec bins |
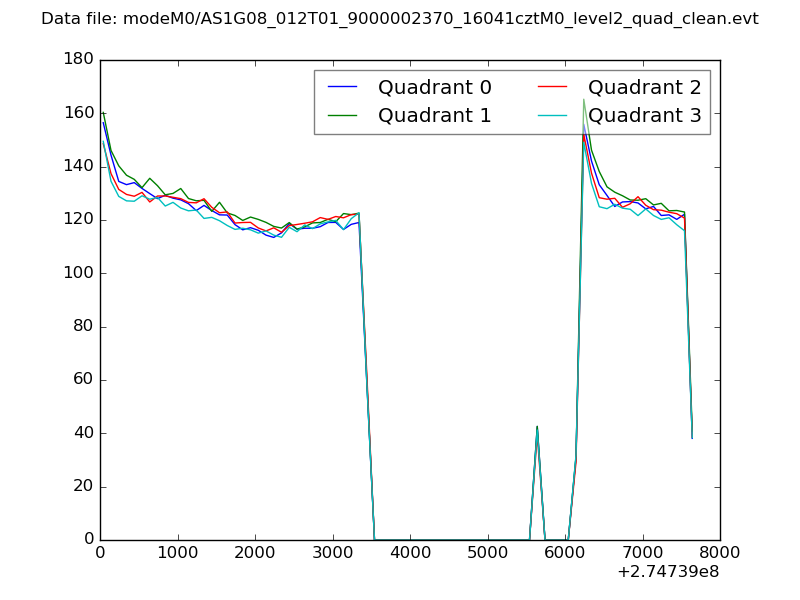 |
|
| Module-wise count rates for Quadrant A Data is divided into 100 sec bins |
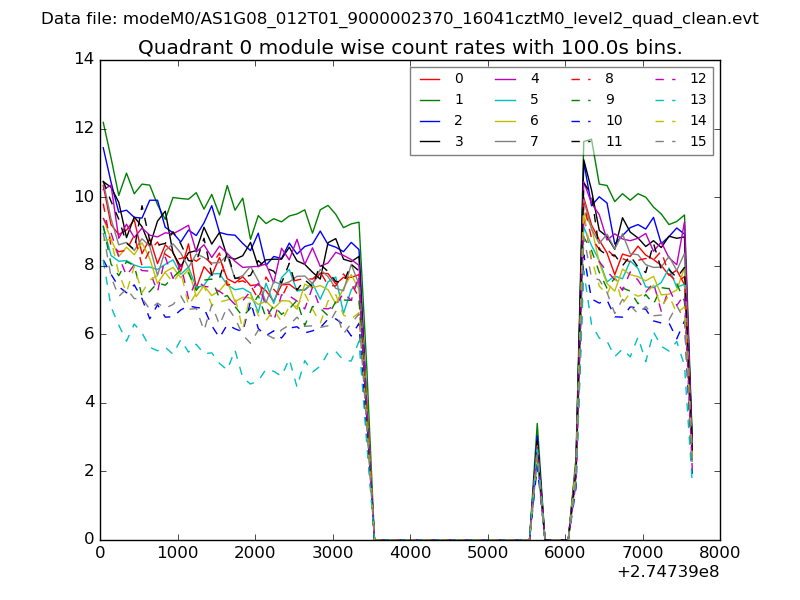 |
 |
| Module-wise count rates for Quadrant B Data is divided into 100 sec bins |
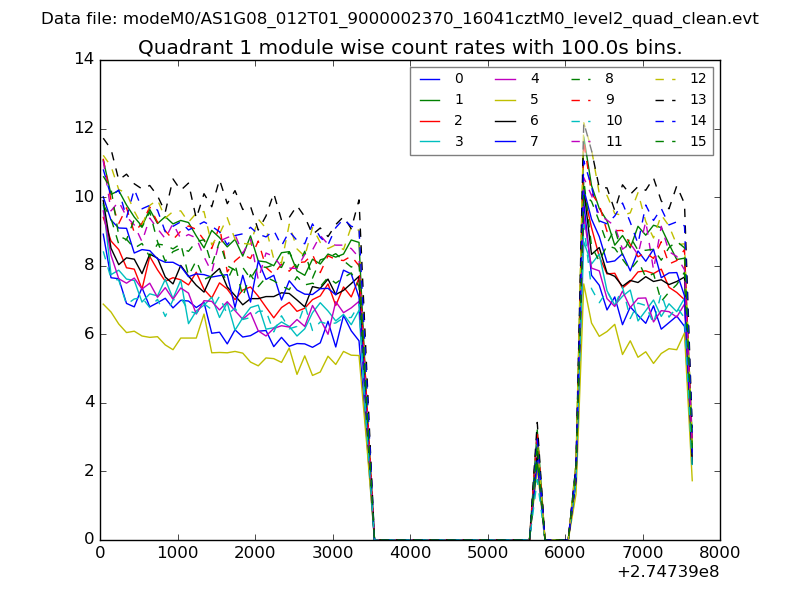 |
 |
| Module-wise count rates for Quadrant C Data is divided into 100 sec bins |
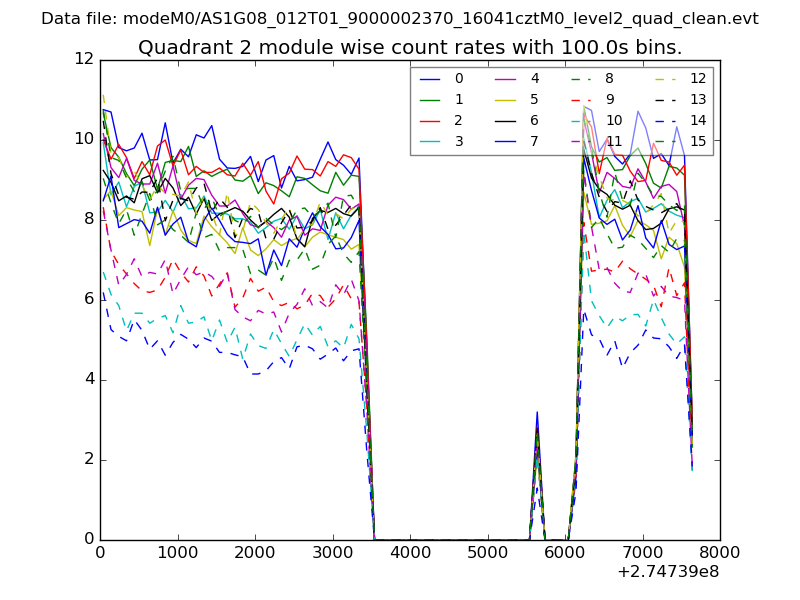 |
 |
| Module-wise count rates for Quadrant D Data is divided into 100 sec bins |
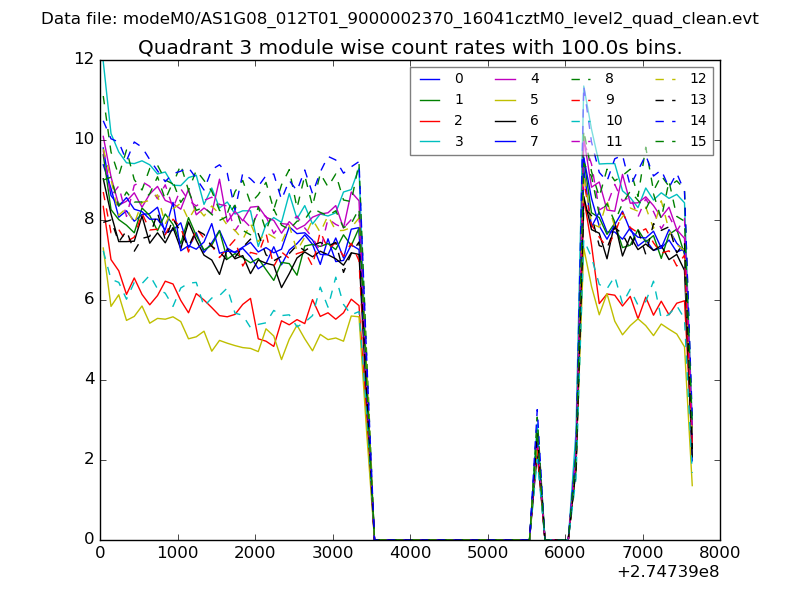 |
 |
| Parameter | Plot |
|---|---|
| CZT HV Monitor | 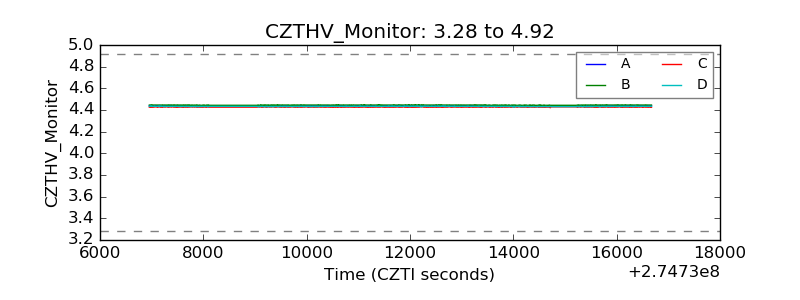 |
| D_VDD | 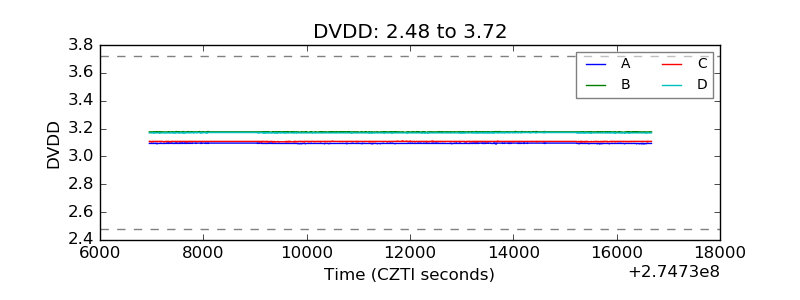 |
| Temperature 1 | 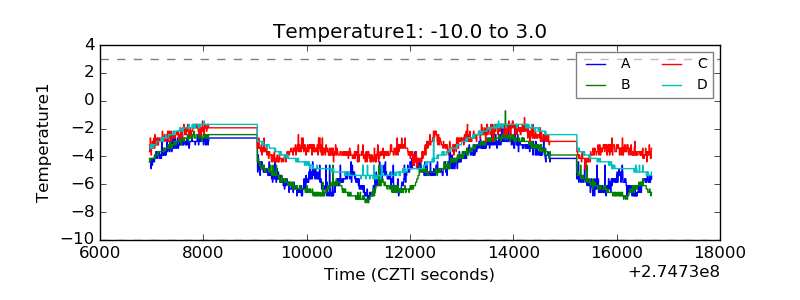 |
| Veto HV Monitor | 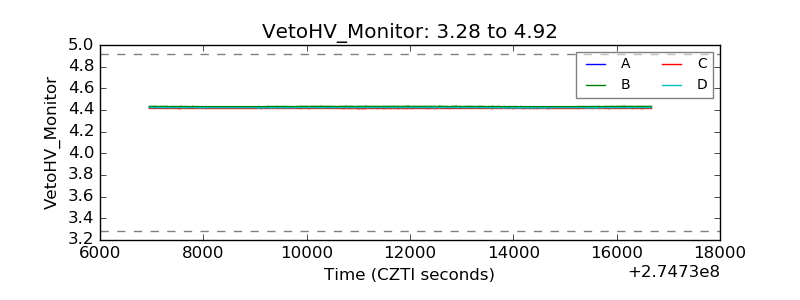 |
| Veto LLD | 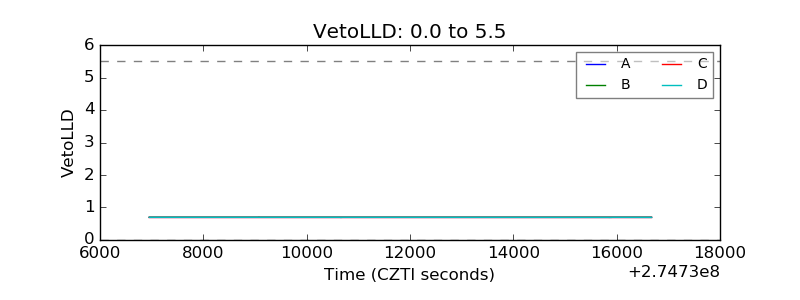 |
| Alpha Counter | 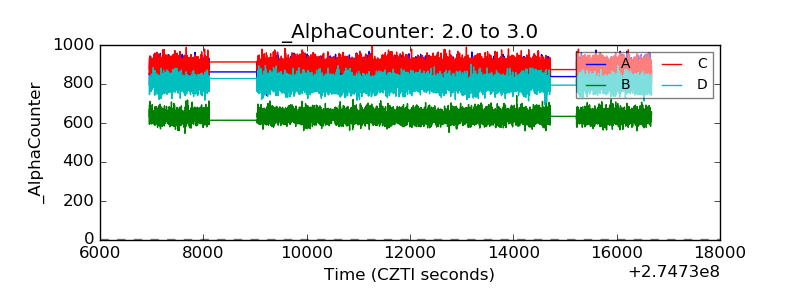 |
| _CPM_Rate | 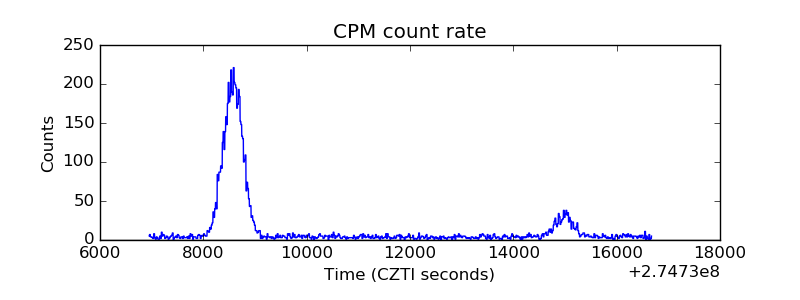 |
| CZT Counter | 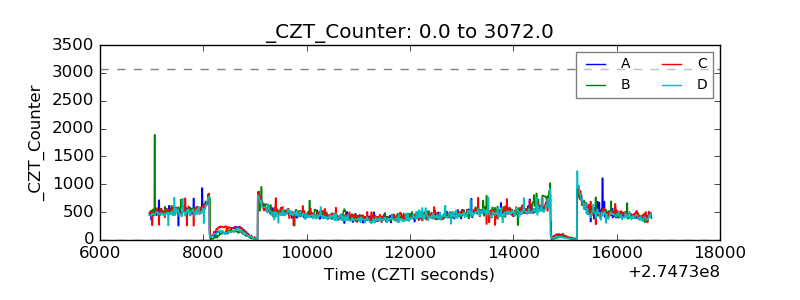 |
| +2.5 Volts monitor |  |
| +5 Volts monitor | 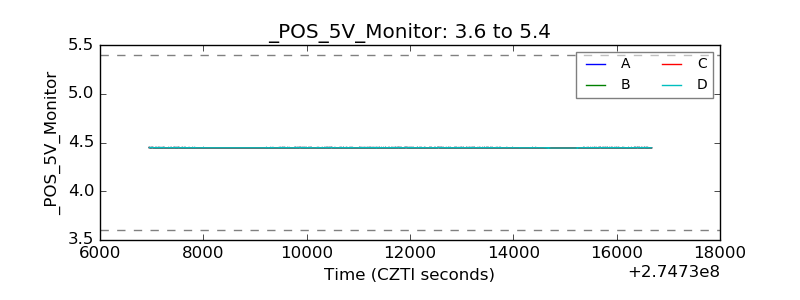 |
| _ROLL_ROT | 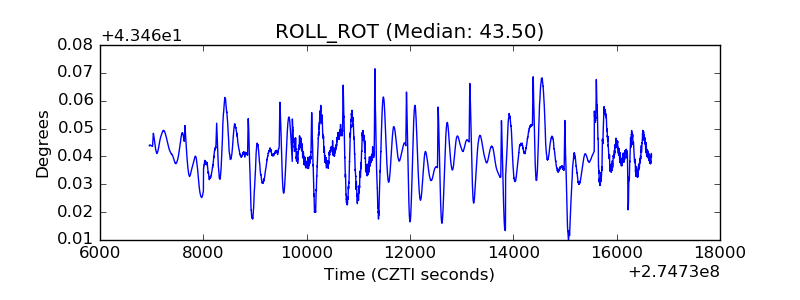 |
| _Roll_DEC | 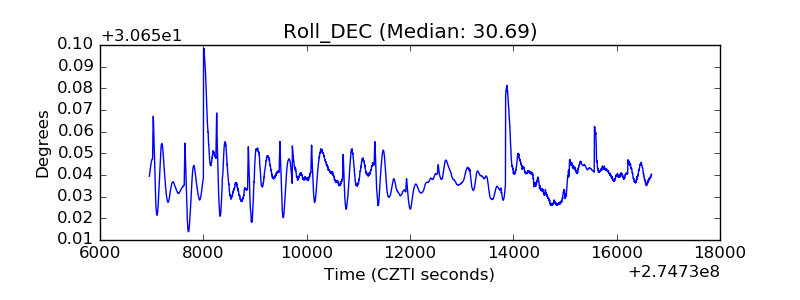 |
| _Roll_RA | 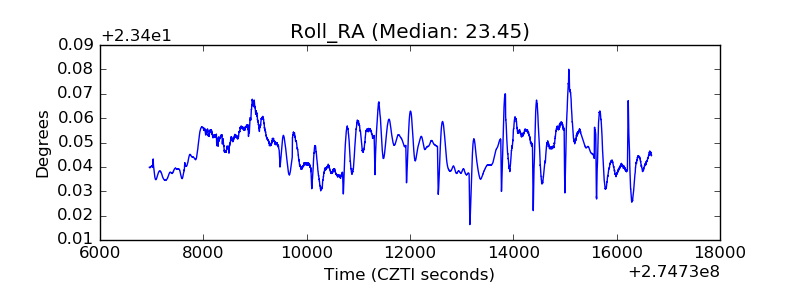 |
| Veto Counter | 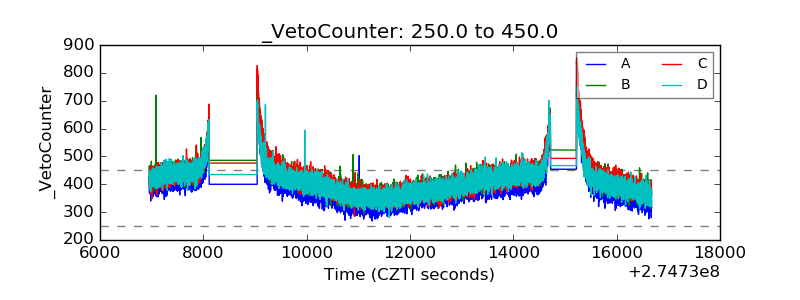 |