| Param | Original file | Final file |
|---|---|---|
| Filename | modeM0/AS1G08_012T01_9000002370_16042cztM0_level2.evt | modeM0/AS1G08_012T01_9000002370_16042cztM0_level2_quad_clean.evt |
| Size (bytes) | 513,679,680 | 107,305,920 |
| Size | 489.9 MB | 102.3 MB |
| Events in quadrant A | 3,761,799 | 679,051 |
| Events in quadrant B | 3,859,598 | 693,183 |
| Events in quadrant C | 3,802,363 | 676,710 |
| Events in quadrant D | 3,611,531 | 666,874 |
| Mode M0 | |||
|---|---|---|---|
| Quadrant | BADHDUFLAG | Total packets | Discarded packets |
| A | 0 | 16478 | 3 |
| B | 0 | 16685 | 2 |
| C | 0 | 16374 | 2 |
| D | 0 | 16307 | 2 |
| Mode M9 | |||
|---|---|---|---|
| Quadrant | BADHDUFLAG | Total packets | Discarded packets |
| A | 0 | 6 | 0 |
| B | 0 | 6 | 0 |
| C | 0 | 6 | 0 |
| D | 0 | 6 | 0 |
| Mode SS | |||
|---|---|---|---|
| Quadrant | BADHDUFLAG | Total packets | Discarded packets |
| A | 0 | 158 | 0 |
| B | 0 | 158 | 0 |
| C | 0 | 158 | 0 |
| D | 0 | 158 | 0 |
| Quadrant | Total seconds | Saturated seconds | Saturation percentage |
|---|---|---|---|
| A | 7673 | 197 | 2.567444% |
| B | 7673 | 263 | 3.427603% |
| C | 7673 | 280 | 3.649159% |
| D | 7673 | 114 | 1.485729% |
Noise dominated data is calculated using 1-second bins in cleaned event files. If a bin has >2000 counts, and if more than 50% of those come from <1% of pixels, then it is considered to be noise-dominated and hence unusable.
| Quadrant | # 1 sec bins | Bins with >0 counts | Bins with >2000 counts | High rate bins dominated by noise | Noise dominated (total time) | Noise dominated (detector-on time) | Marked lightcurve |
|---|---|---|---|---|---|---|---|
| A | 8269 | 7675 | 1 | 1 | 0.01% | 0.01% | 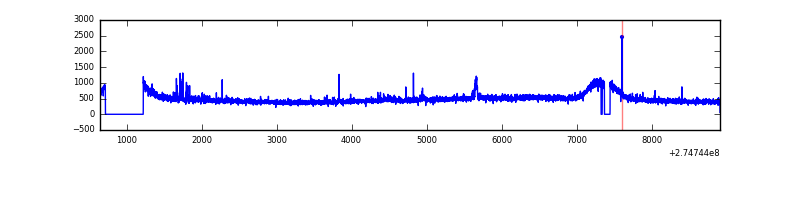 |
| B | 8269 | 7675 | 5 | 5 | 0.06% | 0.07% | 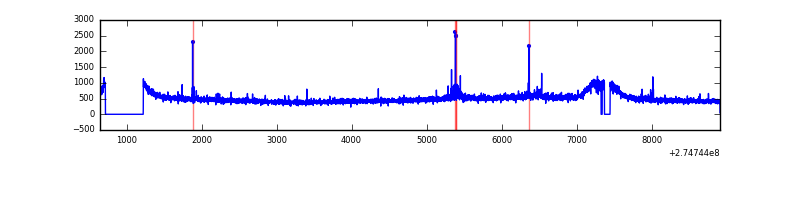 |
| C | 8269 | 7675 | 0 | 0 | 0.00% | 0.00% | 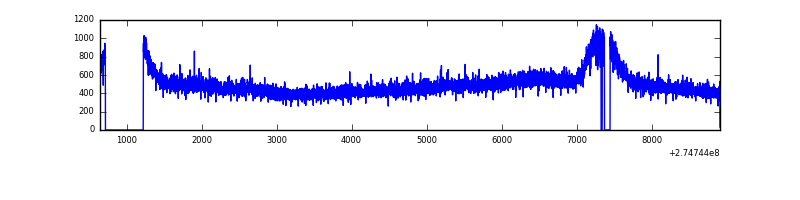 |
| D | 8269 | 7677 | 3 | 3 | 0.04% | 0.04% | 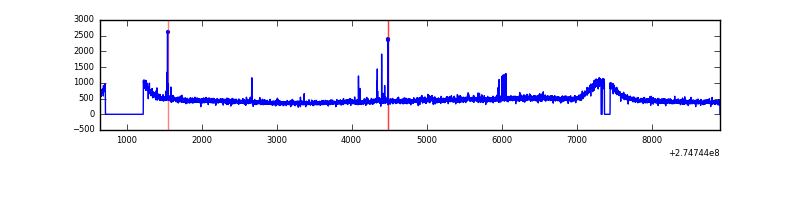 |
Top three noisy pixels from each quadrant. If the there are fewer than three noisy pixels in the level2.evt file, extra rows are filled as -1
| Pixel properties | Quadrant properties | ||||||
|---|---|---|---|---|---|---|---|
| Quadrant | DetID | PixID | Counts | Sigma | Mean | Median | Sigma |
| A | 15 | 157 | 31060 | 154.19 | 957 | 936 | 195.4 |
| A | 3 | 80 | 20143 | 98.31 | 957 | 936 | 195.4 |
| A | 12 | 96 | 19035 | 92.64 | 957 | 936 | 195.4 |
| B | 0 | 189 | 24666 | 127.74 | 958 | 933 | 185.8 |
| B | 0 | 229 | 23435 | 121.11 | 958 | 933 | 185.8 |
| B | 12 | 111 | 22985 | 118.69 | 958 | 933 | 185.8 |
| C | 14 | 238 | 142443 | 638.97 | 929 | 935 | 221.5 |
| C | 3 | 233 | 28281 | 123.48 | 929 | 935 | 221.5 |
| C | 10 | 22 | 8459 | 33.97 | 929 | 935 | 221.5 |
| D | 2 | 152 | 29518 | 124.13 | 939 | 913 | 230.4 |
| D | 2 | 234 | 25584 | 107.06 | 939 | 913 | 230.4 |
| D | 13 | 232 | 20209 | 83.74 | 939 | 913 | 230.4 |
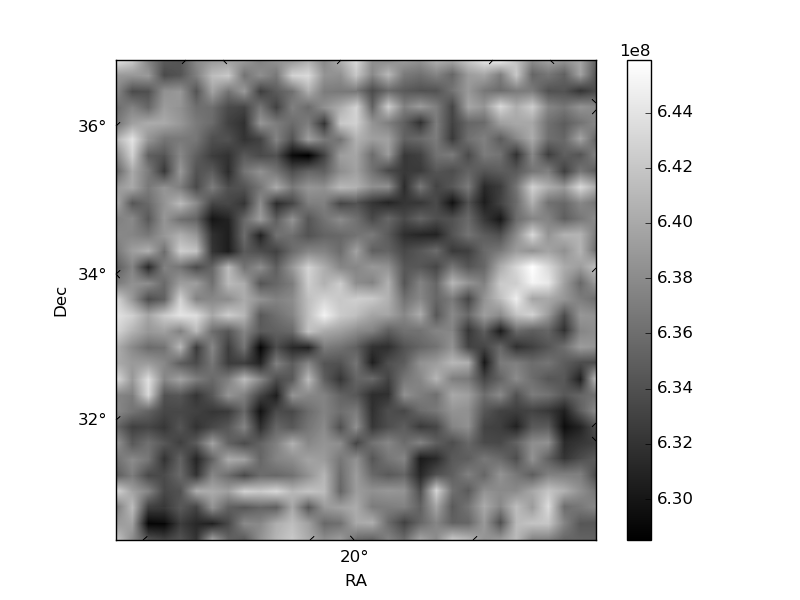
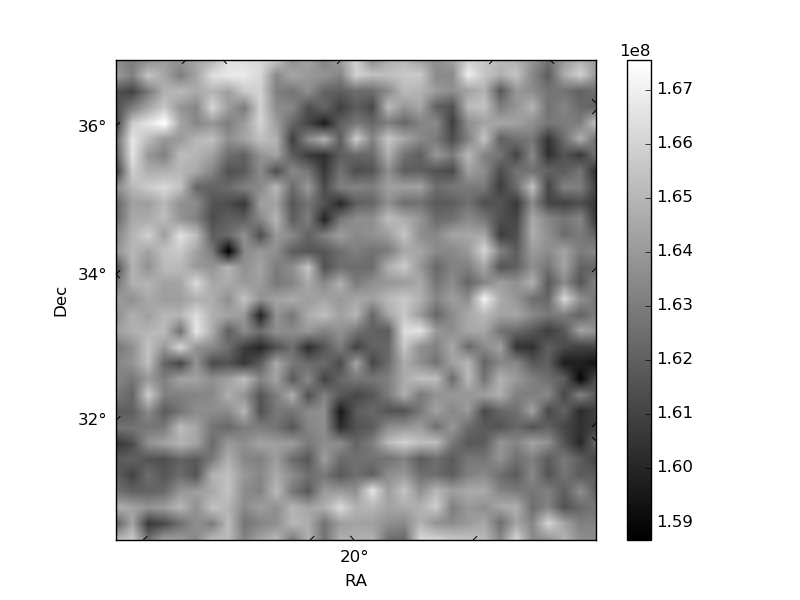
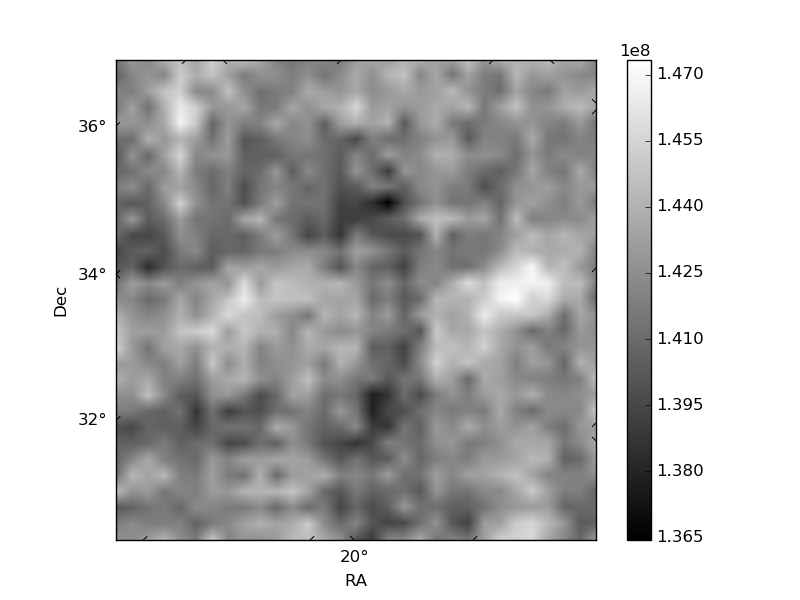
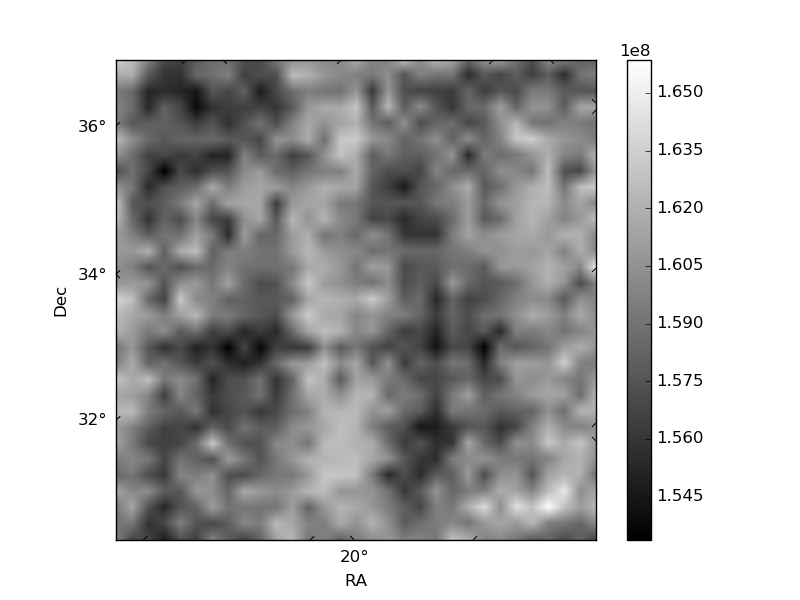
Histogram calculated using DETX and DETY for each event in the final _common_clean file
| Quadrant A | 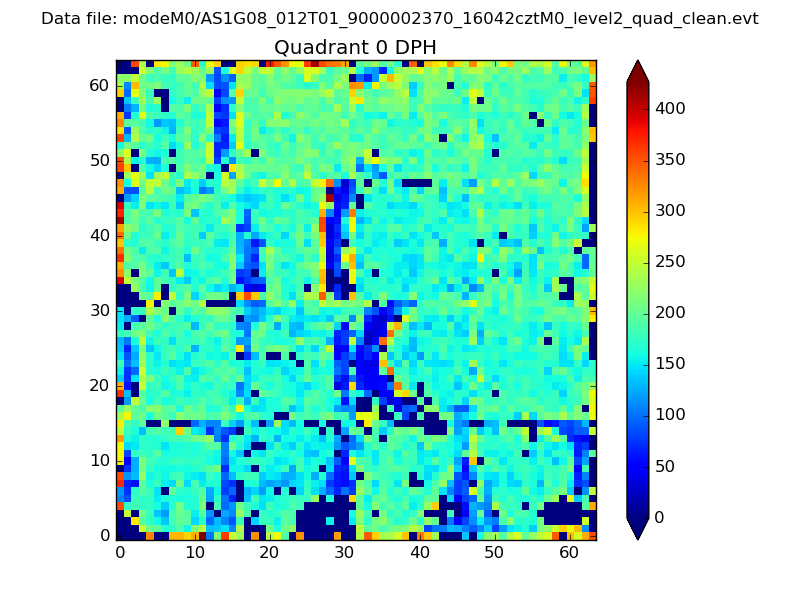 |
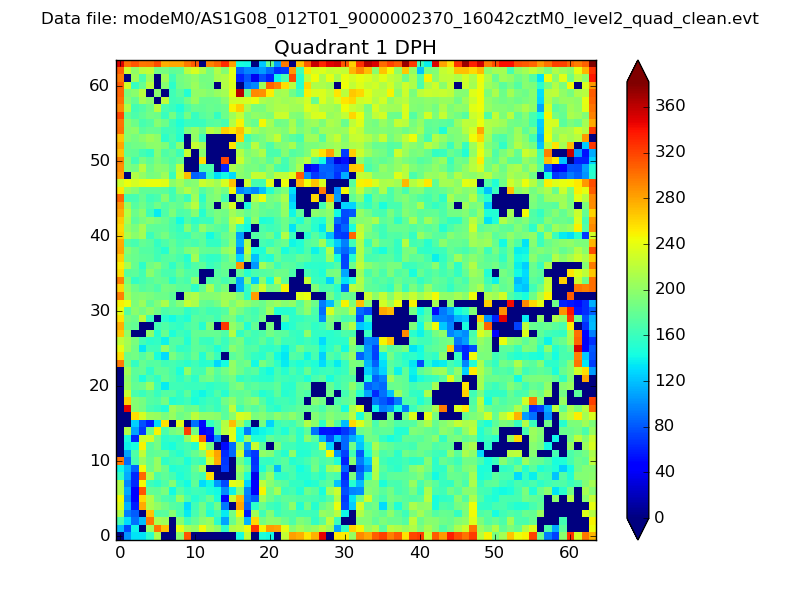 |
Quadrant B |
|---|---|---|---|
| Quadrant D | 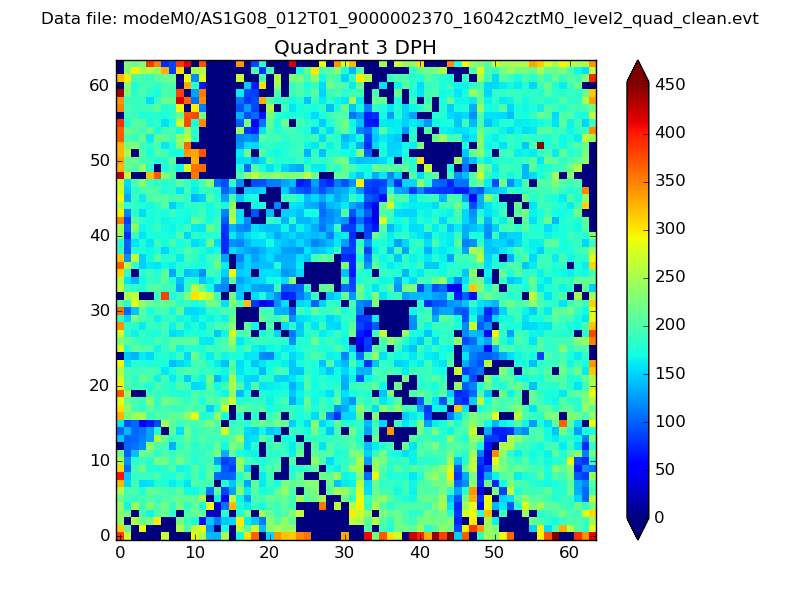 |
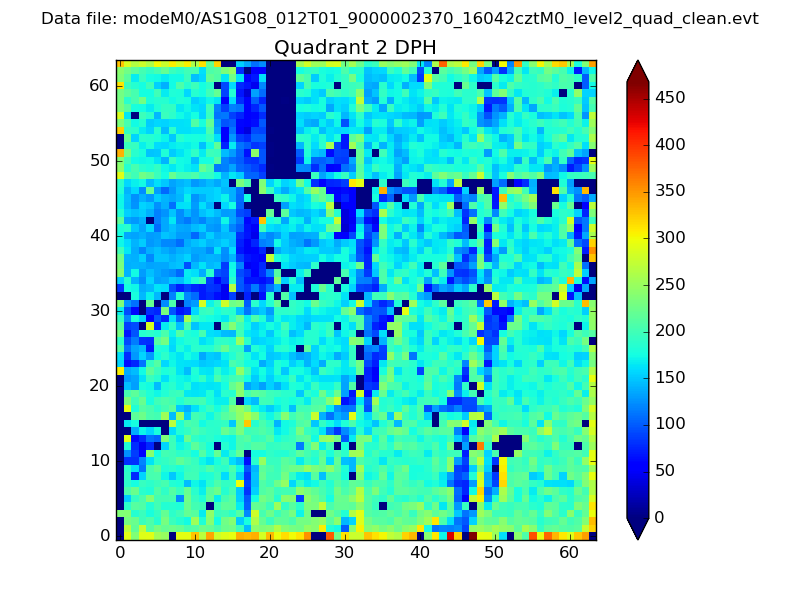 |
Quadrant C |
| Plot type | Count rate plots | Images |
|---|---|---|
| Comparison with Poisson distribution Blue bars denote a histogram of data divided into 1 sec bins. Red curve is a Poisson curve with rate = median count rate of data. |
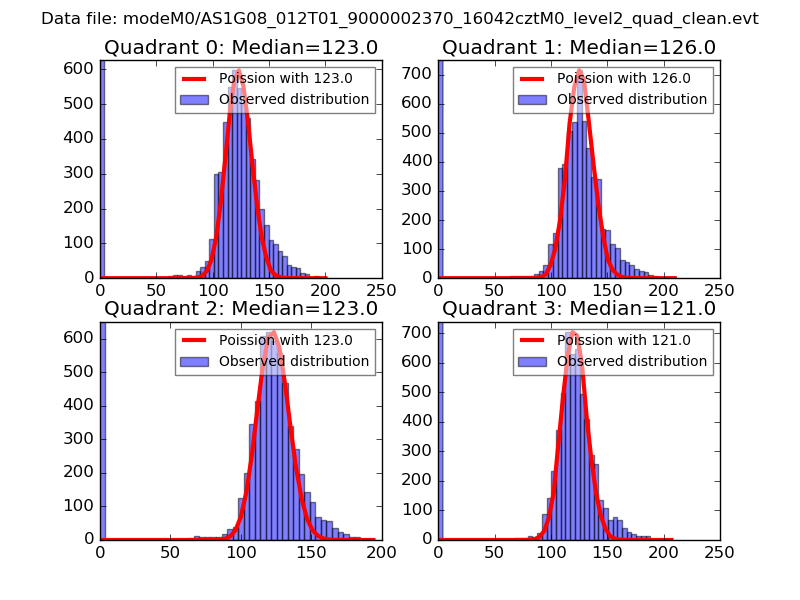 |
 |
| Quadrant-wise count rates Data is divided into 100 sec bins |
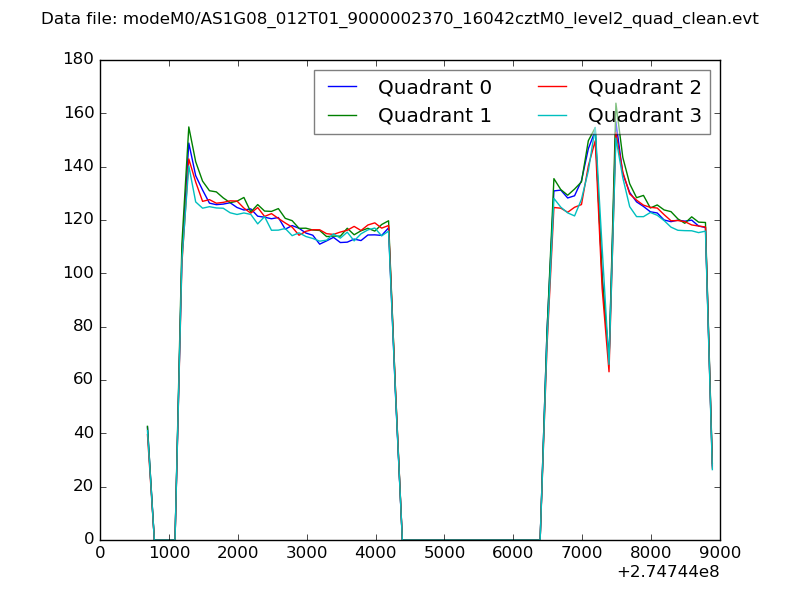 |
|
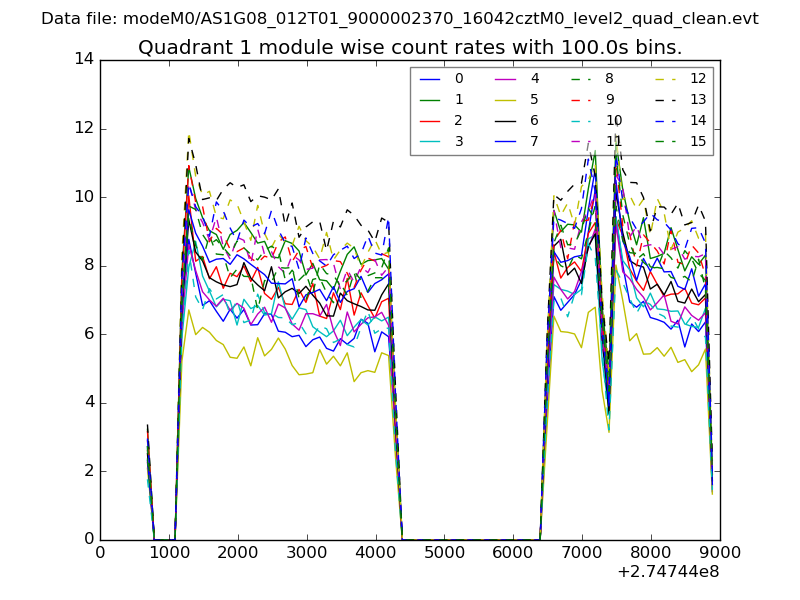
| Module-wise count rates for Quadrant A Data is divided into 100 sec bins |
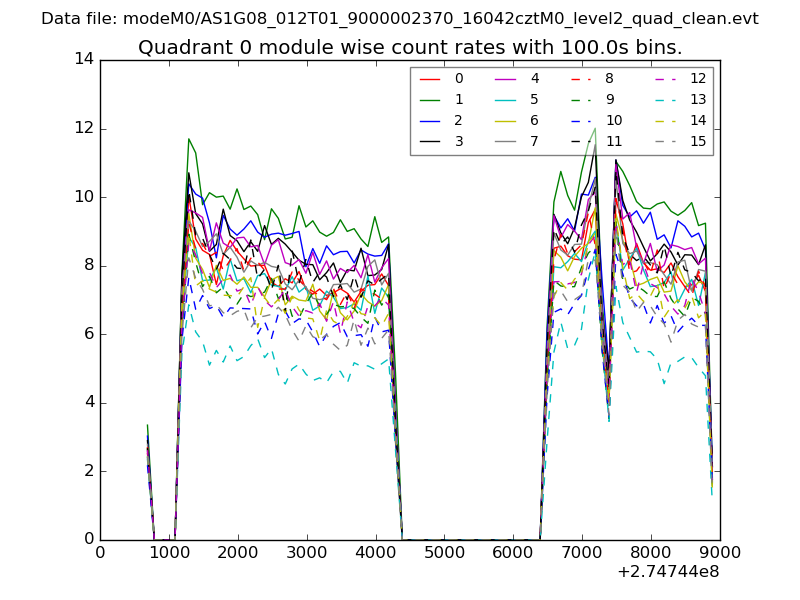 |
 |
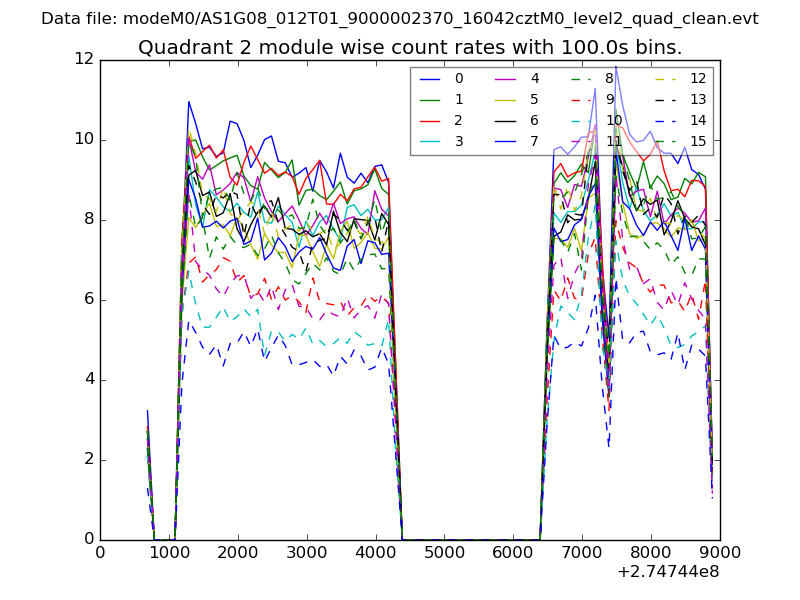
| Module-wise count rates for Quadrant B Data is divided into 100 sec bins |
 |
 |
| Module-wise count rates for Quadrant C Data is divided into 100 sec bins |
 |
 |
| Module-wise count rates for Quadrant D Data is divided into 100 sec bins |
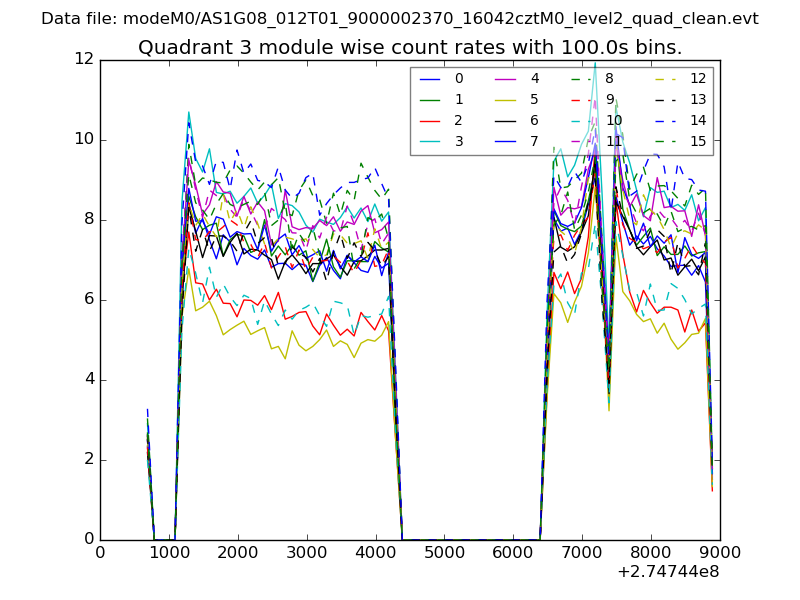 |
 |
| Parameter | Plot |
|---|---|
| CZT HV Monitor | 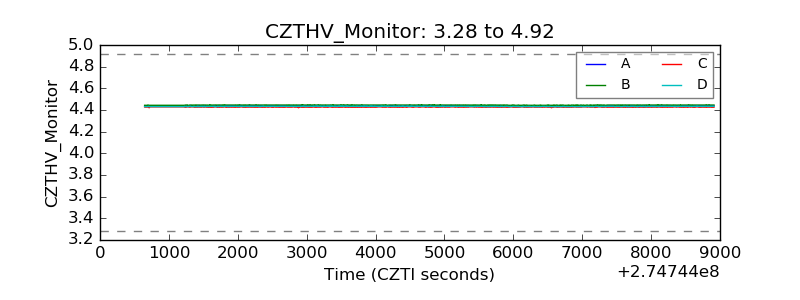 |
| D_VDD | 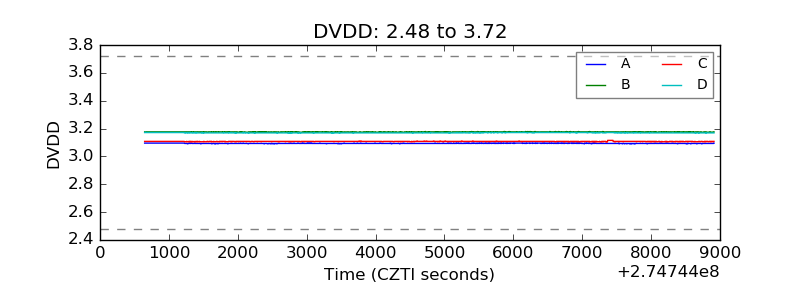 |
| Temperature 1 |  |
| Veto HV Monitor | 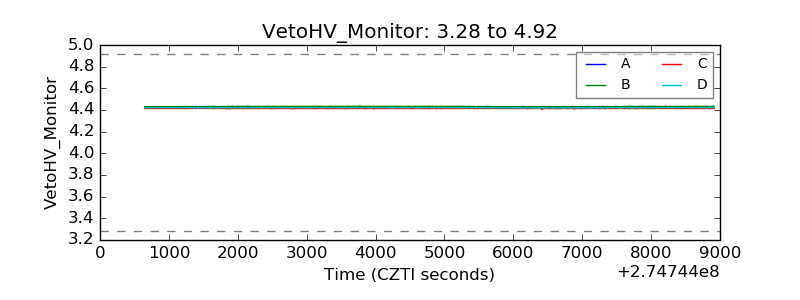 |
| Veto LLD |  |
| Alpha Counter | 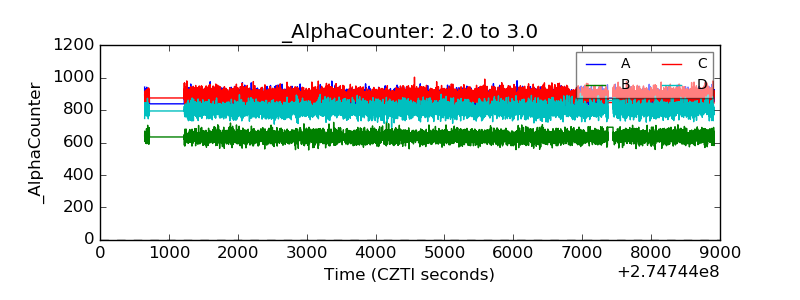 |
| _CPM_Rate | 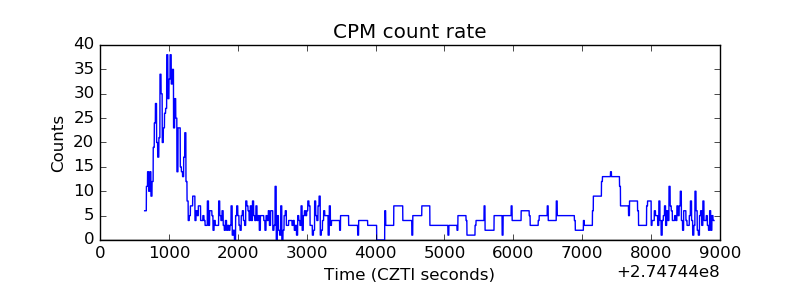 |
| CZT Counter | 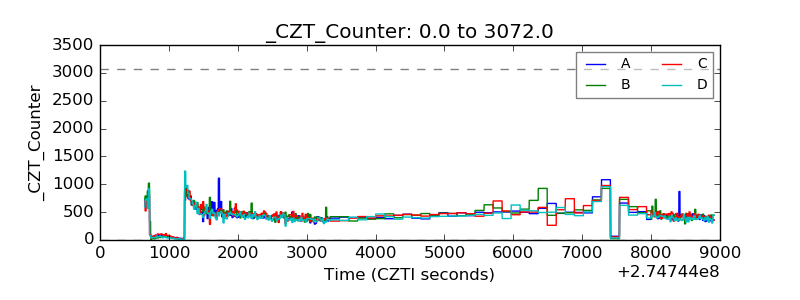 |
| +2.5 Volts monitor |  |
| +5 Volts monitor |  |
| _ROLL_ROT | 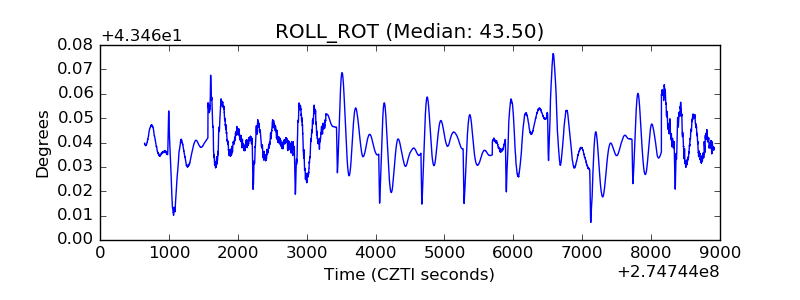 |
| _Roll_DEC | 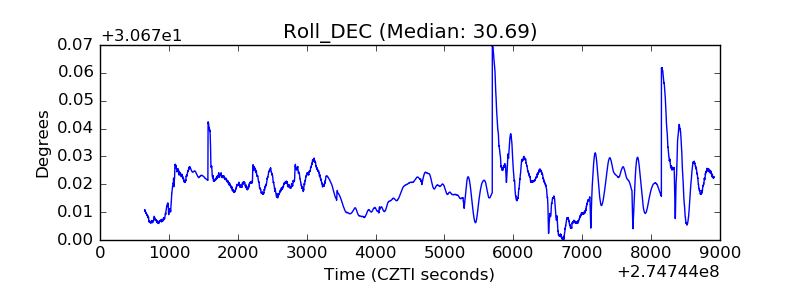 |
| _Roll_RA | 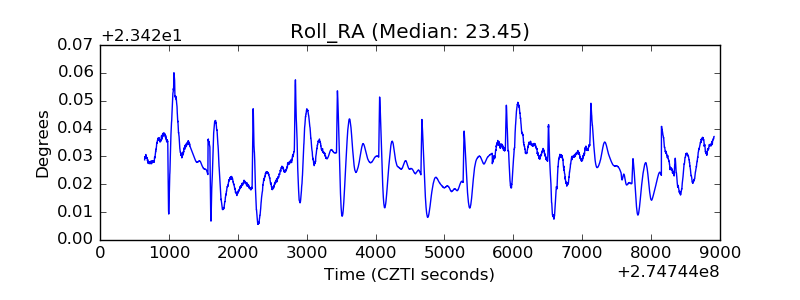 |
| Veto Counter | 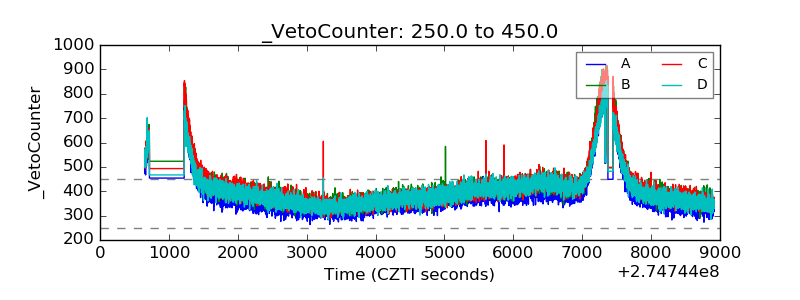 |