| Param | Original file | Final file |
|---|---|---|
| Filename | modeM0/AS1G08_012T01_9000002370_16043cztM0_level2.evt | modeM0/AS1G08_012T01_9000002370_16043cztM0_level2_quad_clean.evt |
| Size (bytes) | 567,256,320 | 123,690,240 |
| Size | 541.0 MB | 118.0 MB |
| Events in quadrant A | 4,123,223 | 790,184 |
| Events in quadrant B | 4,279,810 | 803,515 |
| Events in quadrant C | 4,219,207 | 782,907 |
| Events in quadrant D | 3,974,338 | 773,580 |
| Mode M0 | |||
|---|---|---|---|
| Quadrant | BADHDUFLAG | Total packets | Discarded packets |
| A | 0 | 18159 | 3 |
| B | 0 | 18494 | 2 |
| C | 0 | 18252 | 2 |
| D | 0 | 18053 | 2 |
| Mode M9 | |||
|---|---|---|---|
| Quadrant | BADHDUFLAG | Total packets | Discarded packets |
| A | 0 | 4 | 0 |
| B | 0 | 4 | 0 |
| C | 0 | 4 | 0 |
| D | 0 | 4 | 0 |
| Mode SS | |||
|---|---|---|---|
| Quadrant | BADHDUFLAG | Total packets | Discarded packets |
| A | 0 | 176 | 0 |
| B | 0 | 176 | 0 |
| C | 0 | 176 | 0 |
| D | 0 | 176 | 0 |
| Quadrant | Total seconds | Saturated seconds | Saturation percentage |
|---|---|---|---|
| A | 8577 | 215 | 2.506704% |
| B | 8577 | 296 | 3.451090% |
| C | 8577 | 322 | 3.754226% |
| D | 8577 | 119 | 1.387432% |
Noise dominated data is calculated using 1-second bins in cleaned event files. If a bin has >2000 counts, and if more than 50% of those come from <1% of pixels, then it is considered to be noise-dominated and hence unusable.
| Quadrant | # 1 sec bins | Bins with >0 counts | Bins with >2000 counts | High rate bins dominated by noise | Noise dominated (total time) | Noise dominated (detector-on time) | Marked lightcurve |
|---|---|---|---|---|---|---|---|
| A | 8983 | 8579 | 1 | 1 | 0.01% | 0.01% | 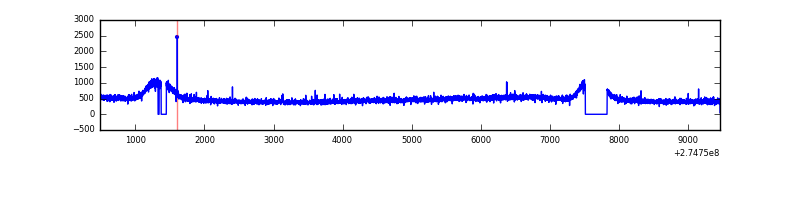 |
| B | 8983 | 8578 | 2 | 2 | 0.02% | 0.02% | 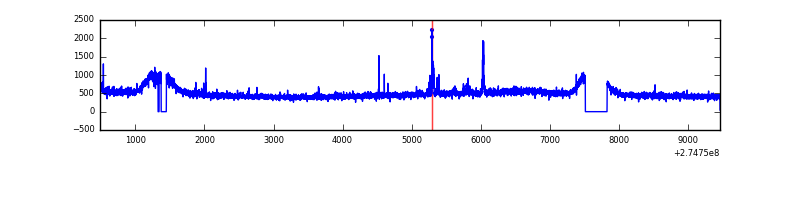 |
| C | 8983 | 8579 | 0 | 0 | 0.00% | 0.00% | 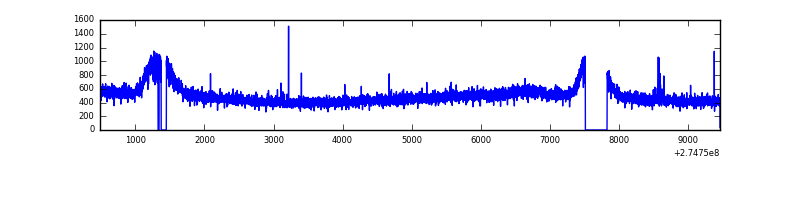 |
| D | 8983 | 8580 | 1 | 1 | 0.01% | 0.01% | 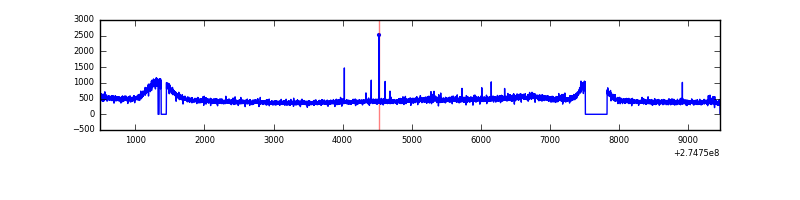 |
Top three noisy pixels from each quadrant. If the there are fewer than three noisy pixels in the level2.evt file, extra rows are filled as -1
| Pixel properties | Quadrant properties | ||||||
|---|---|---|---|---|---|---|---|
| Quadrant | DetID | PixID | Counts | Sigma | Mean | Median | Sigma |
| A | 15 | 223 | 19342 | 84.54 | 1061 | 1038 | 216.5 |
| A | 0 | 226 | 9277 | 38.05 | 1061 | 1038 | 216.5 |
| A | 9 | 143 | 9228 | 37.83 | 1061 | 1038 | 216.5 |
| B | 4 | 48 | 47199 | 222.09 | 1064 | 1036 | 207.9 |
| B | 12 | 111 | 25358 | 117.01 | 1064 | 1036 | 207.9 |
| B | 0 | 229 | 22023 | 100.97 | 1064 | 1036 | 207.9 |
| C | 14 | 238 | 154813 | 630.3 | 1028 | 1035 | 244.0 |
| C | 3 | 233 | 35817 | 142.56 | 1028 | 1035 | 244.0 |
| C | 10 | 22 | 19988 | 77.68 | 1028 | 1035 | 244.0 |
| D | 2 | 152 | 40737 | 156.43 | 1040 | 1008 | 254.0 |
| D | 2 | 234 | 30073 | 114.44 | 1040 | 1008 | 254.0 |
| D | 14 | 226 | 10074 | 35.7 | 1040 | 1008 | 254.0 |
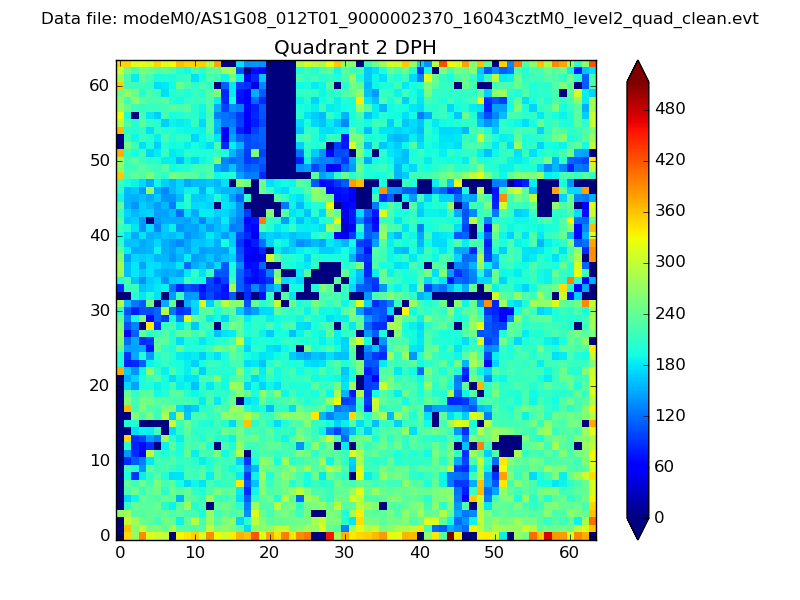
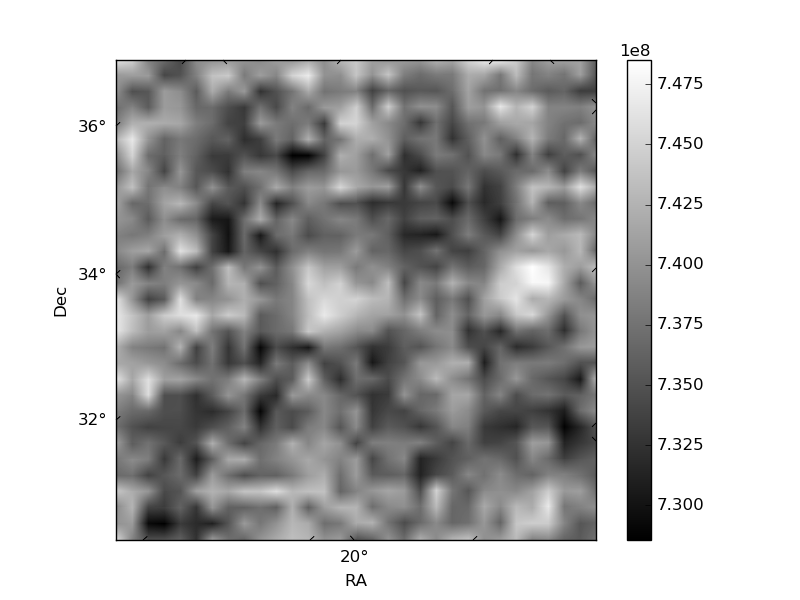
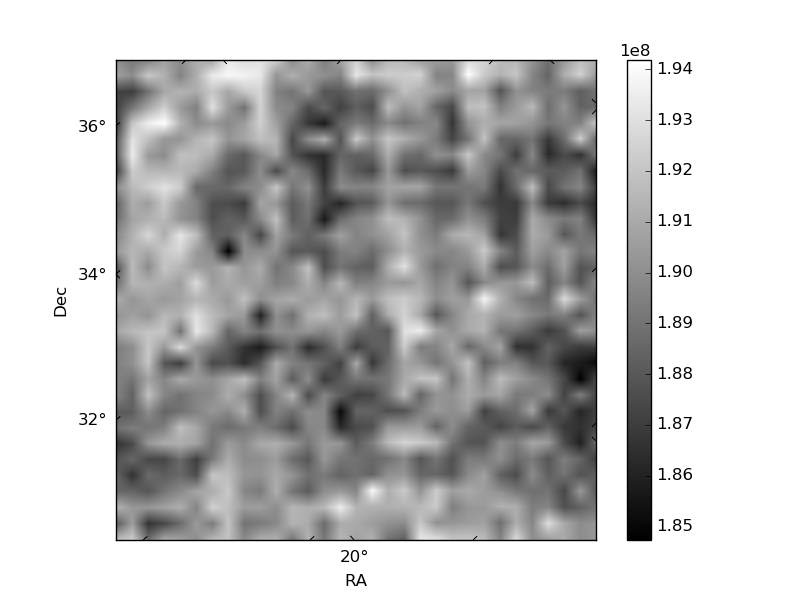
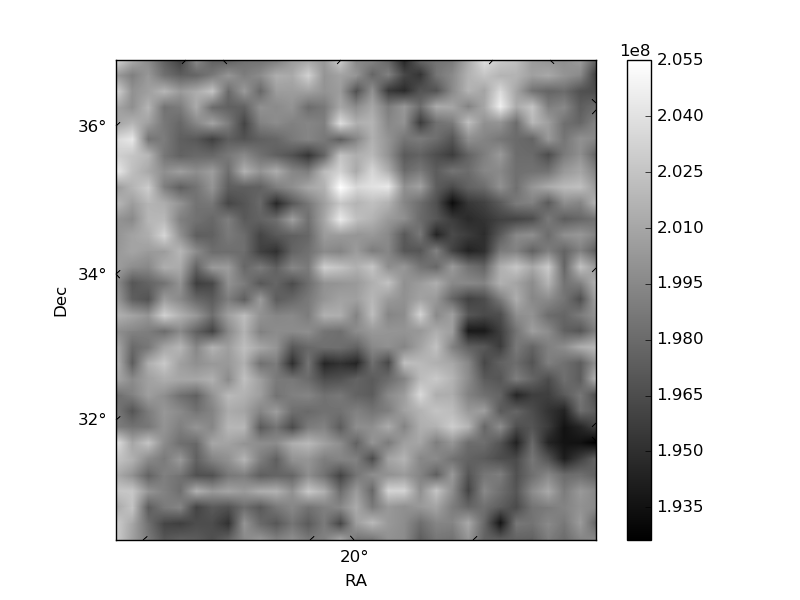
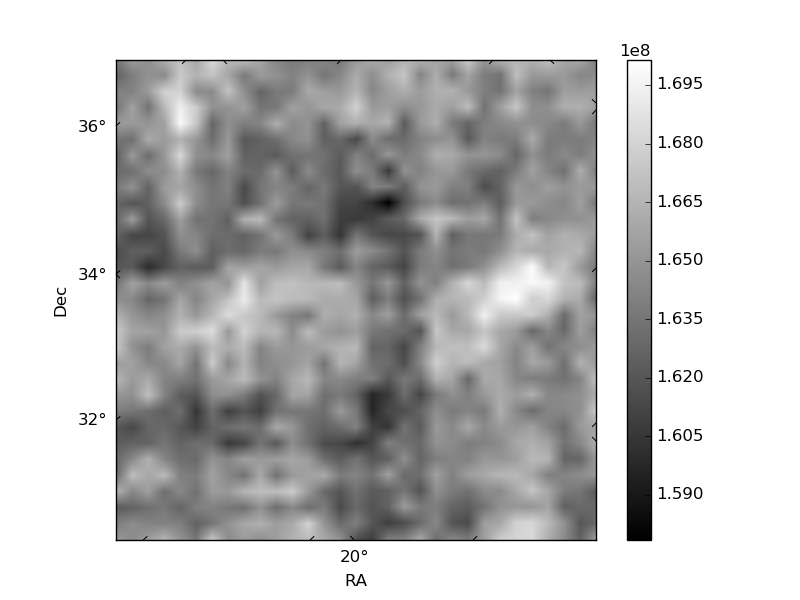
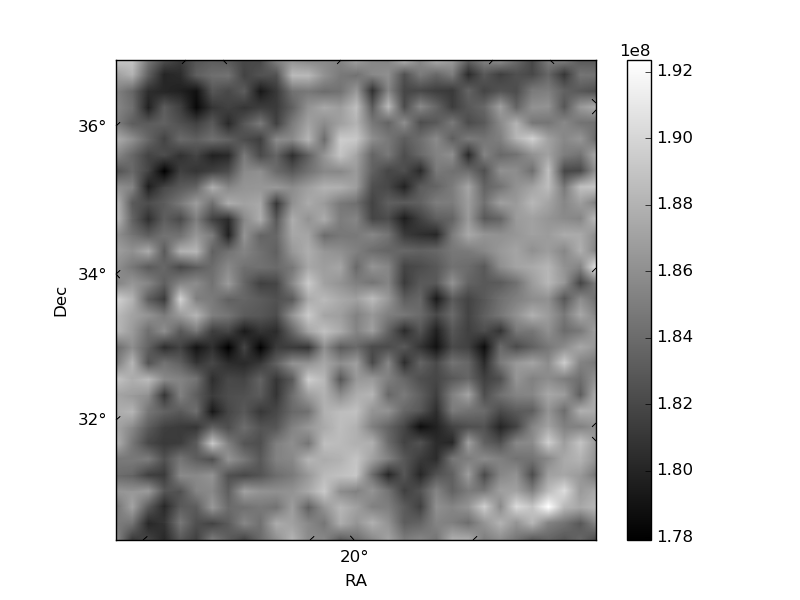
Histogram calculated using DETX and DETY for each event in the final _common_clean file
| Quadrant A | 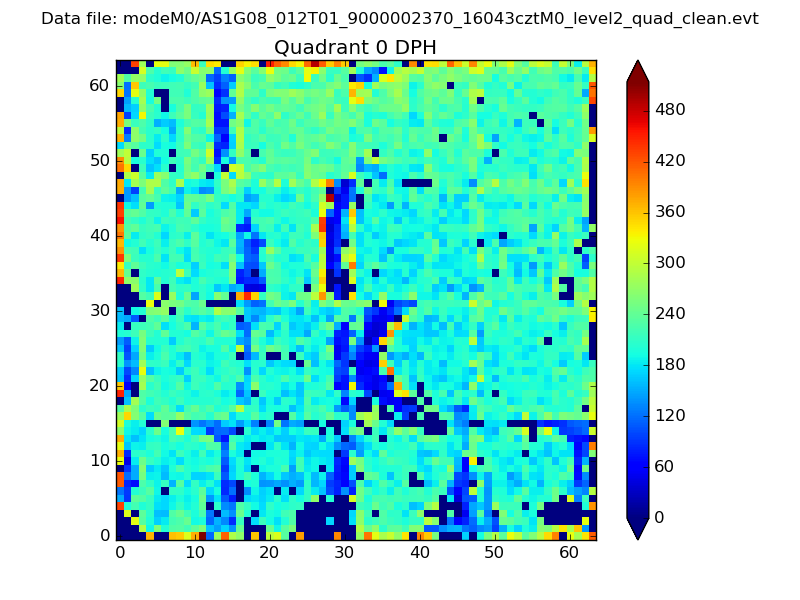 |
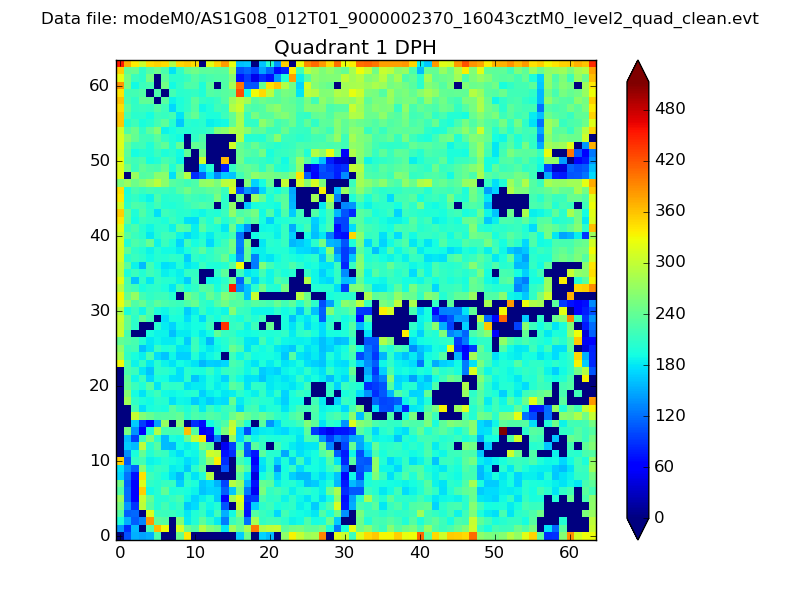 |
Quadrant B |
|---|---|---|---|
| Quadrant D | 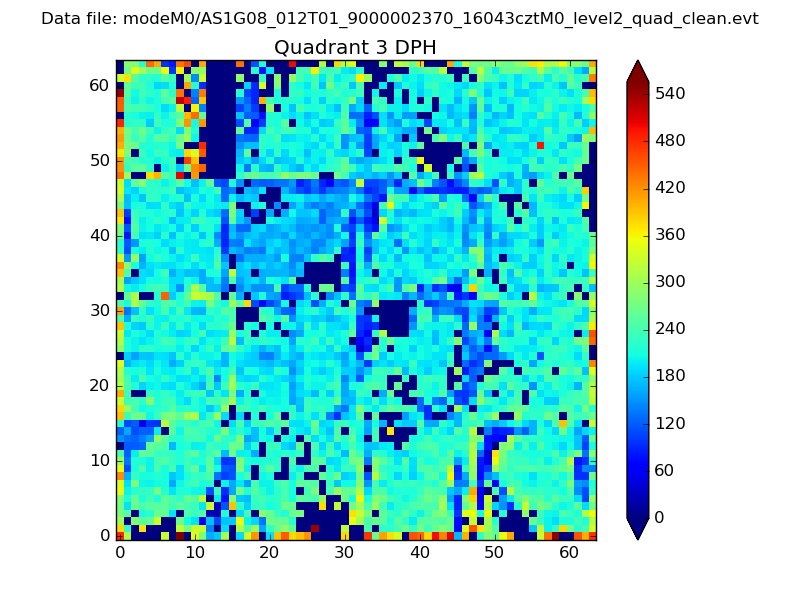 |
 |
Quadrant C |
| Plot type | Count rate plots | Images |
|---|---|---|
| Comparison with Poisson distribution Blue bars denote a histogram of data divided into 1 sec bins. Red curve is a Poisson curve with rate = median count rate of data. |
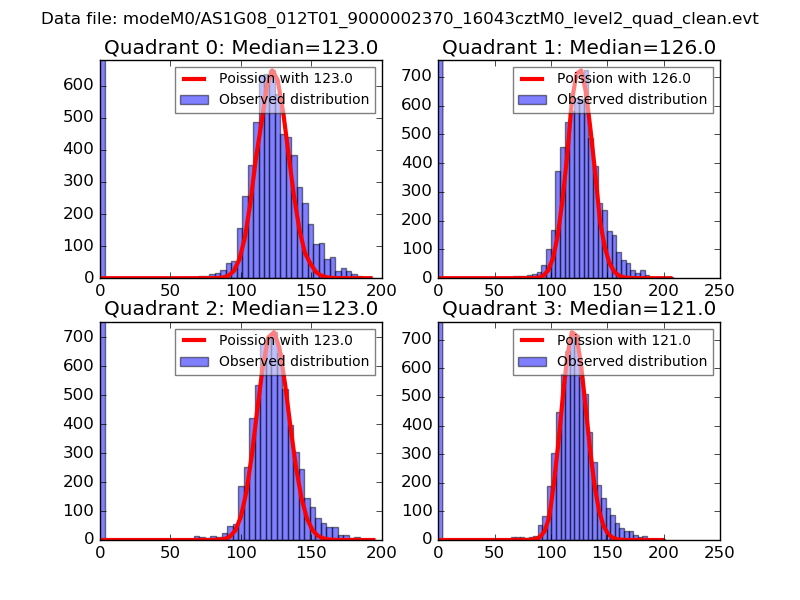 |
 |
| Quadrant-wise count rates Data is divided into 100 sec bins |
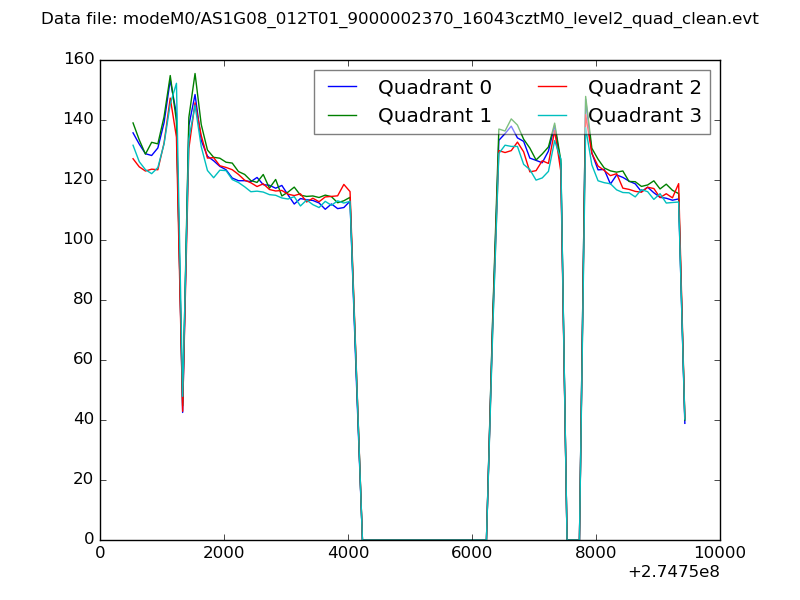 |
|
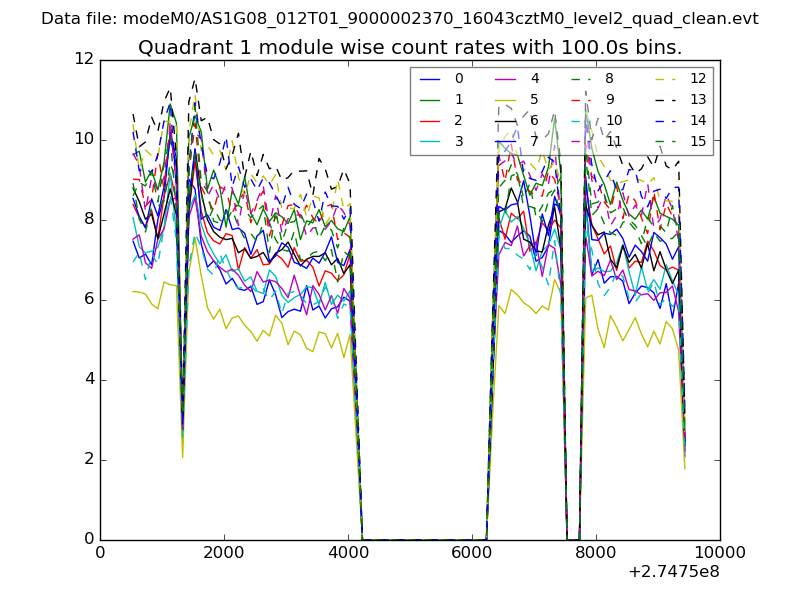
| Module-wise count rates for Quadrant A Data is divided into 100 sec bins |
 |
 |
| Module-wise count rates for Quadrant B Data is divided into 100 sec bins |
 |
 |
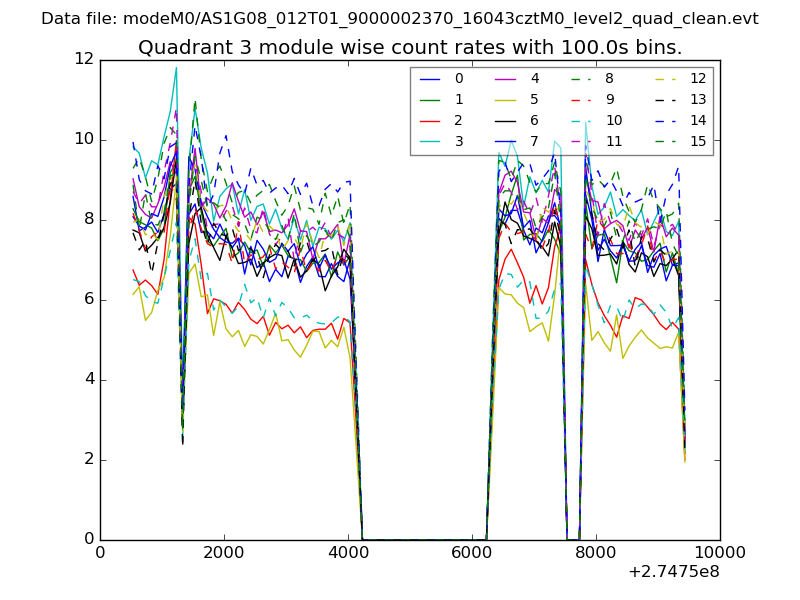
| Module-wise count rates for Quadrant C Data is divided into 100 sec bins |
 |
 |
| Module-wise count rates for Quadrant D Data is divided into 100 sec bins |
 |
 |
| Parameter | Plot |
|---|---|
| CZT HV Monitor | 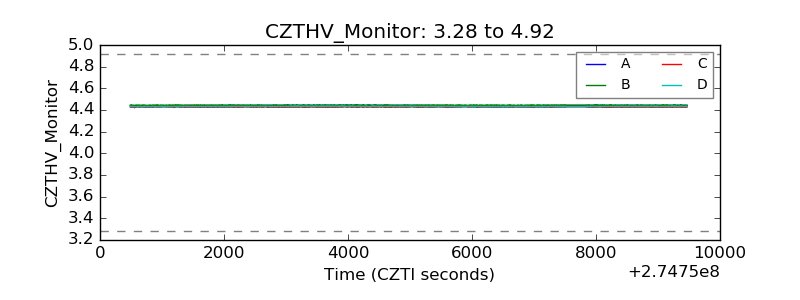 |
| D_VDD | 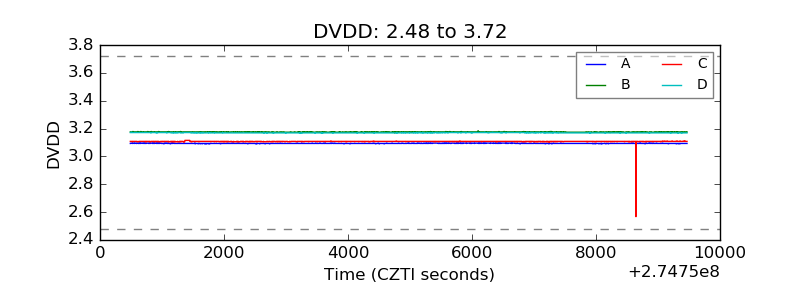 |
| Temperature 1 | 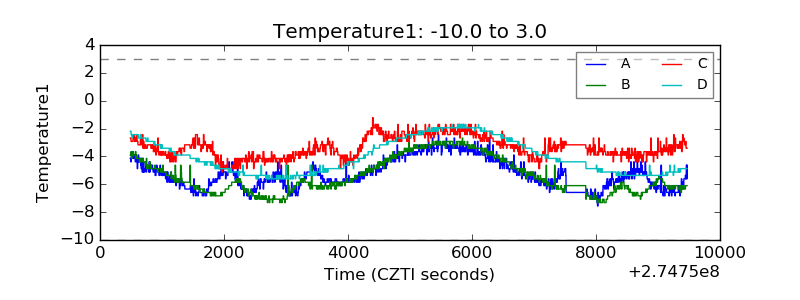 |
| Veto HV Monitor | 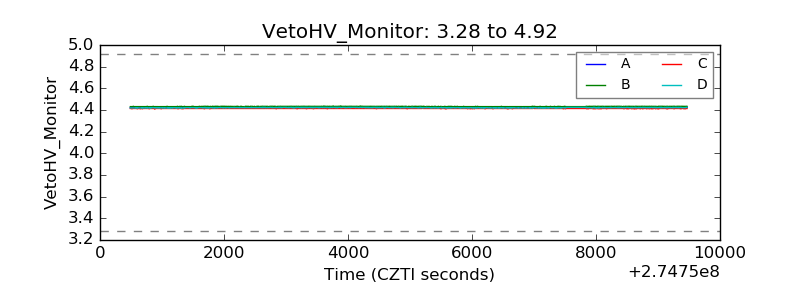 |
| Veto LLD |  |
| Alpha Counter | 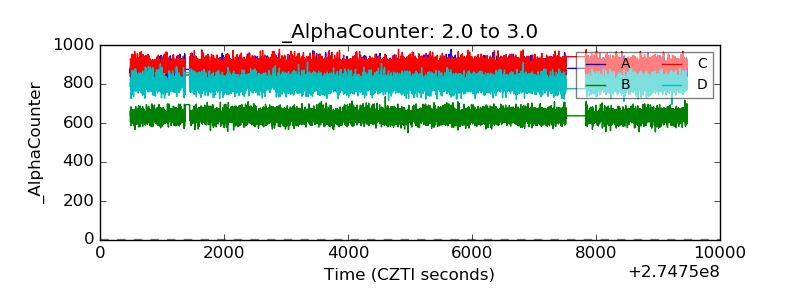 |
| _CPM_Rate | 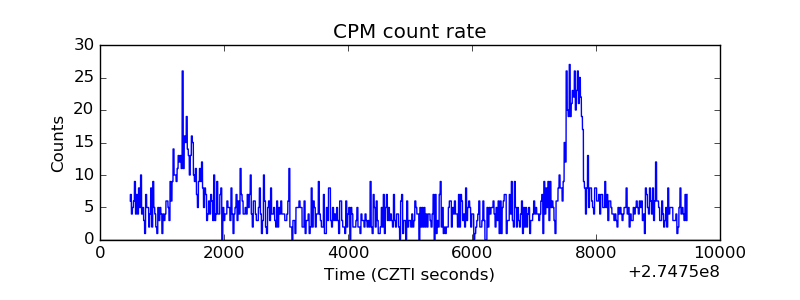 |
| CZT Counter | 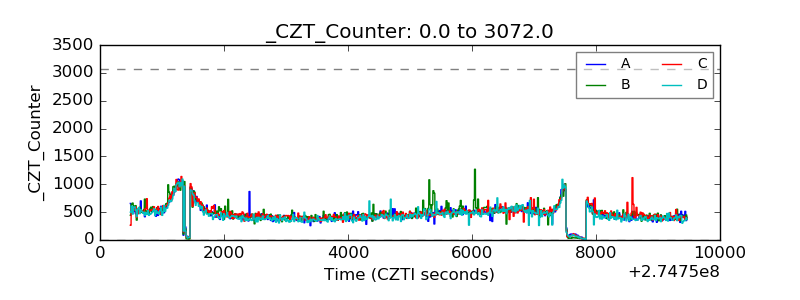 |
| +2.5 Volts monitor |  |
| +5 Volts monitor |  |
| _ROLL_ROT |  |
| _Roll_DEC | 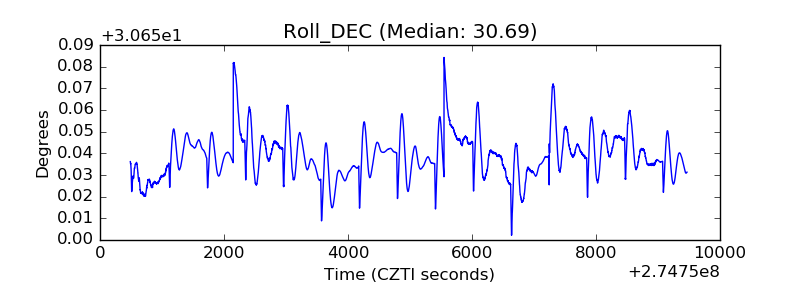 |
| _Roll_RA | 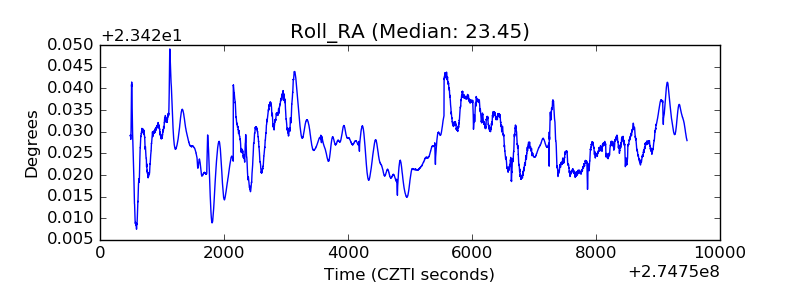 |
| Veto Counter | 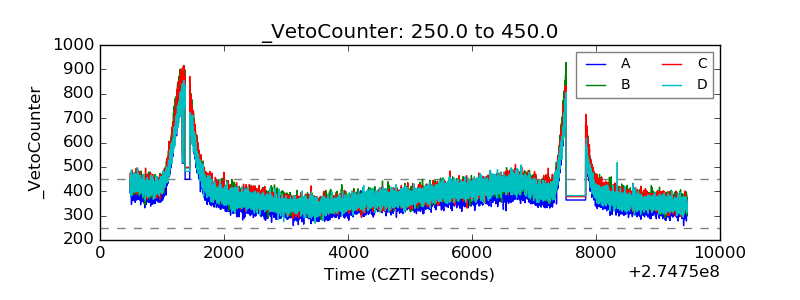 |