| Param | Original file | Final file |
|---|---|---|
| Filename | modeM0/AS1G08_012T01_9000002370_16045cztM0_level2.evt | modeM0/AS1G08_012T01_9000002370_16045cztM0_level2_quad_clean.evt |
| Size (bytes) | 462,119,040 | 97,021,440 |
| Size | 440.7 MB | 92.5 MB |
| Events in quadrant A | 3,253,307 | 610,915 |
| Events in quadrant B | 3,350,589 | 623,794 |
| Events in quadrant C | 3,402,823 | 608,238 |
| Events in quadrant D | 3,498,892 | 593,790 |
| Mode M0 | |||
|---|---|---|---|
| Quadrant | BADHDUFLAG | Total packets | Discarded packets |
| A | 0 | 14610 | 3 |
| B | 0 | 14765 | 2 |
| C | 0 | 14893 | 2 |
| D | 0 | 15627 | 2 |
| Mode M9 | |||
|---|---|---|---|
| Quadrant | BADHDUFLAG | Total packets | Discarded packets |
| A | 0 | 5 | 0 |
| B | 0 | 5 | 0 |
| C | 0 | 5 | 0 |
| D | 0 | 5 | 0 |
| Mode SS | |||
|---|---|---|---|
| Quadrant | BADHDUFLAG | Total packets | Discarded packets |
| A | 0 | 146 | 0 |
| B | 0 | 146 | 0 |
| C | 0 | 146 | 0 |
| D | 0 | 146 | 0 |
| Quadrant | Total seconds | Saturated seconds | Saturation percentage |
|---|---|---|---|
| A | 7202 | 26 | 0.361011% |
| B | 7202 | 34 | 0.472091% |
| C | 7202 | 58 | 0.805332% |
| D | 7203 | 107 | 1.485492% |
Noise dominated data is calculated using 1-second bins in cleaned event files. If a bin has >2000 counts, and if more than 50% of those come from <1% of pixels, then it is considered to be noise-dominated and hence unusable.
| Quadrant | # 1 sec bins | Bins with >0 counts | Bins with >2000 counts | High rate bins dominated by noise | Noise dominated (total time) | Noise dominated (detector-on time) | Marked lightcurve |
|---|---|---|---|---|---|---|---|
| A | 7703 | 7203 | 0 | 0 | 0.00% | 0.00% | 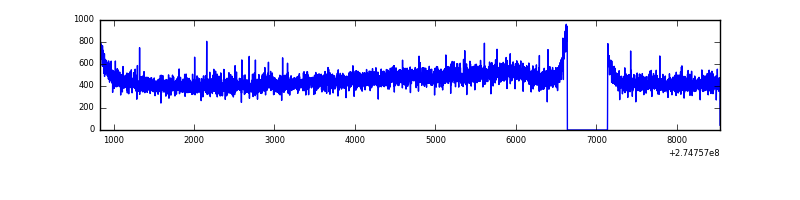 |
| B | 7703 | 7204 | 0 | 0 | 0.00% | 0.00% | 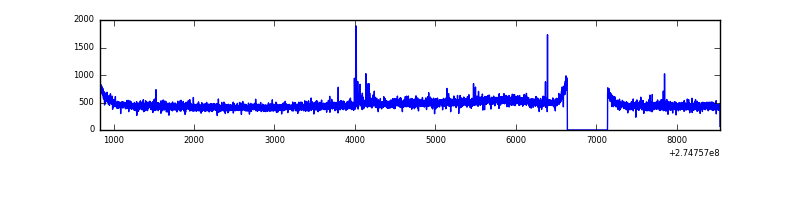 |
| C | 7703 | 7204 | 0 | 0 | 0.00% | 0.00% | 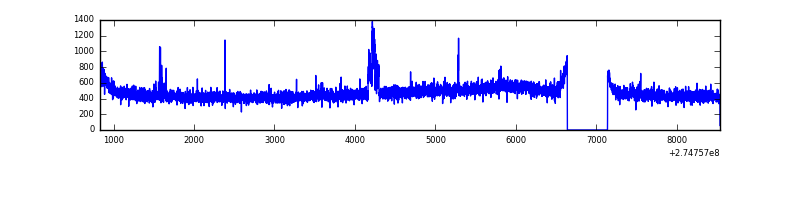 |
| D | 7704 | 7204 | 58 | 58 | 0.75% | 0.81% | 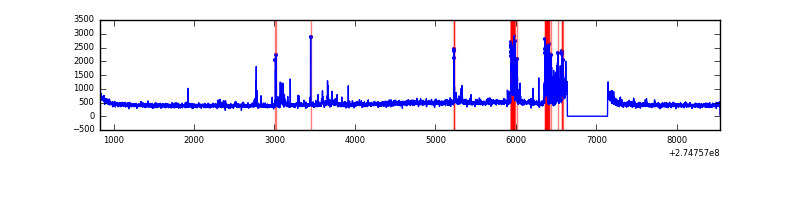 |
Top three noisy pixels from each quadrant. If the there are fewer than three noisy pixels in the level2.evt file, extra rows are filled as -1
| Pixel properties | Quadrant properties | ||||||
|---|---|---|---|---|---|---|---|
| Quadrant | DetID | PixID | Counts | Sigma | Mean | Median | Sigma |
| A | 1 | 15 | 8919 | 47.28 | 841 | 821 | 171.3 |
| A | 0 | 226 | 7215 | 37.33 | 841 | 821 | 171.3 |
| A | 15 | 223 | 6696 | 34.3 | 841 | 821 | 171.3 |
| B | 12 | 111 | 19548 | 114.38 | 844 | 821 | 163.7 |
| B | 11 | 111 | 16657 | 96.72 | 844 | 821 | 163.7 |
| B | 0 | 230 | 14567 | 83.96 | 844 | 821 | 163.7 |
| C | 14 | 238 | 124061 | 648.08 | 814 | 819 | 190.2 |
| C | 3 | 233 | 79378 | 413.11 | 814 | 819 | 190.2 |
| C | 10 | 22 | 19521 | 98.35 | 814 | 819 | 190.2 |
| D | 13 | 232 | 376583 | 1892.73 | 815 | 793 | 198.5 |
| D | 2 | 152 | 31043 | 152.36 | 815 | 793 | 198.5 |
| D | 2 | 234 | 25187 | 122.86 | 815 | 793 | 198.5 |
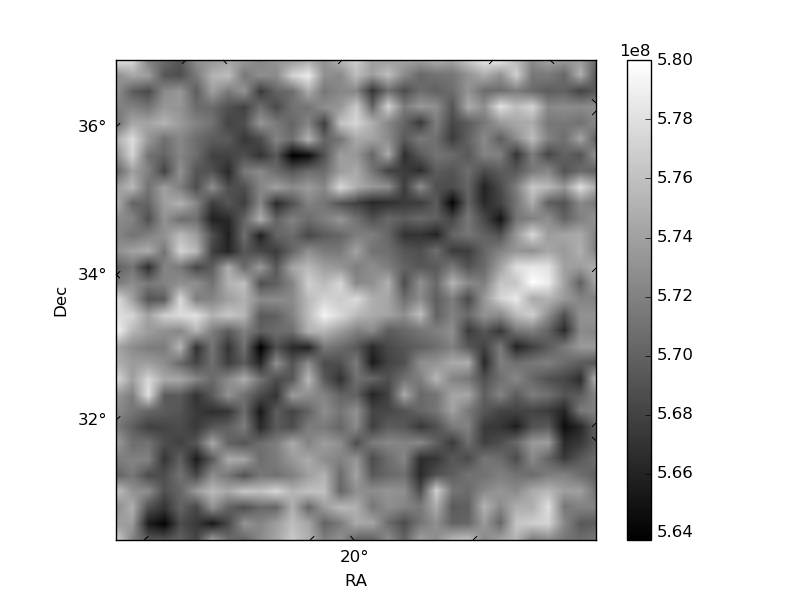
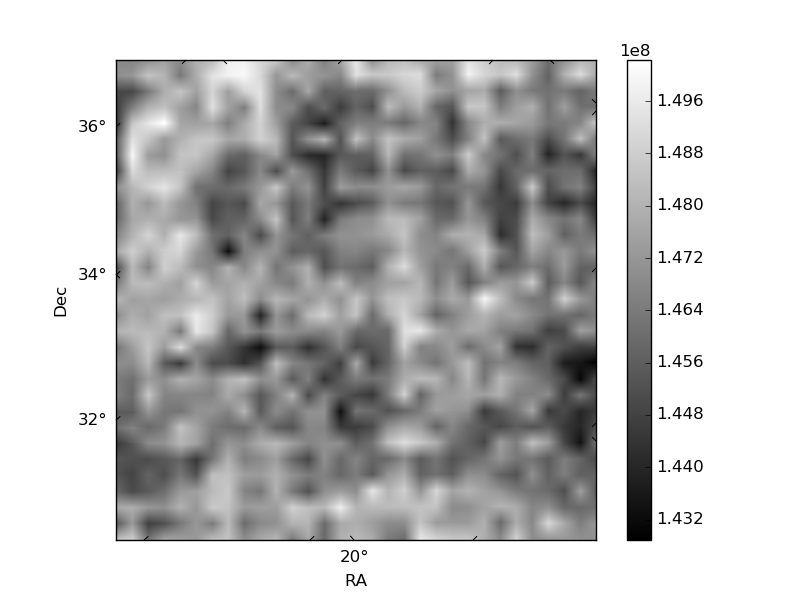
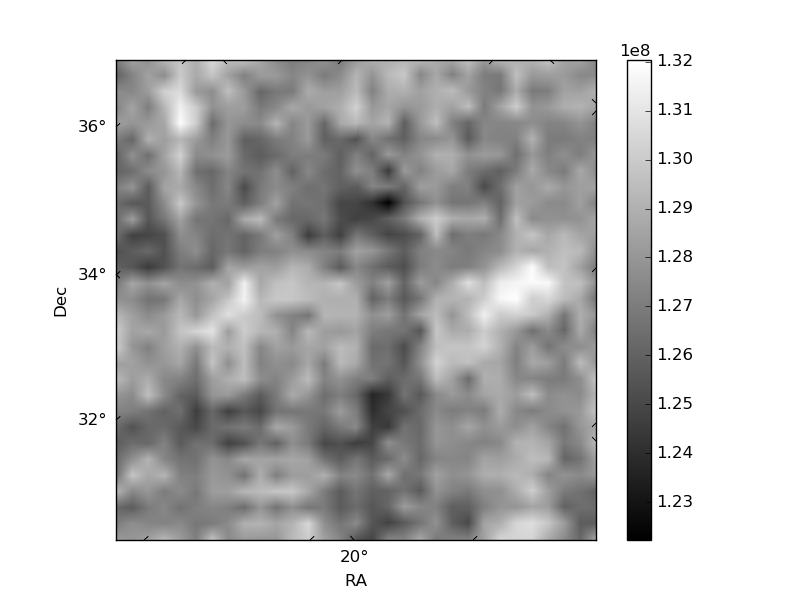
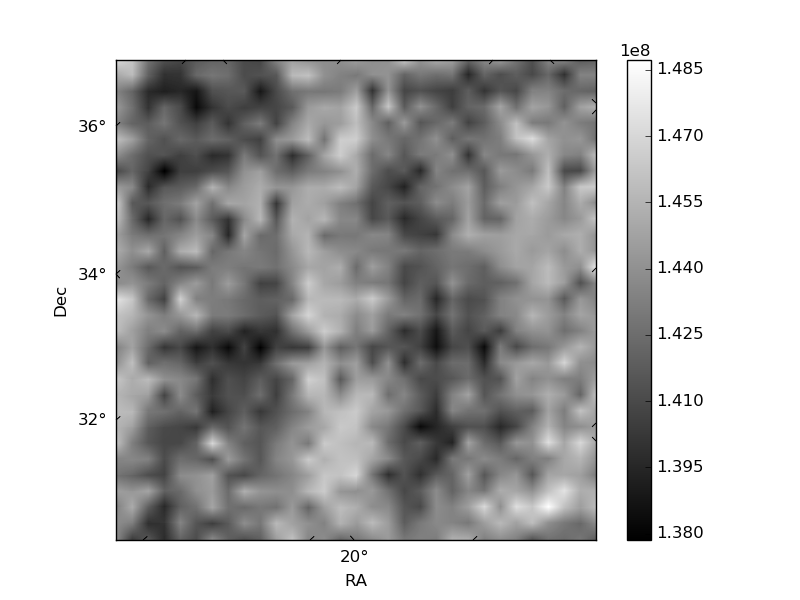
Histogram calculated using DETX and DETY for each event in the final _common_clean file
| Quadrant A | 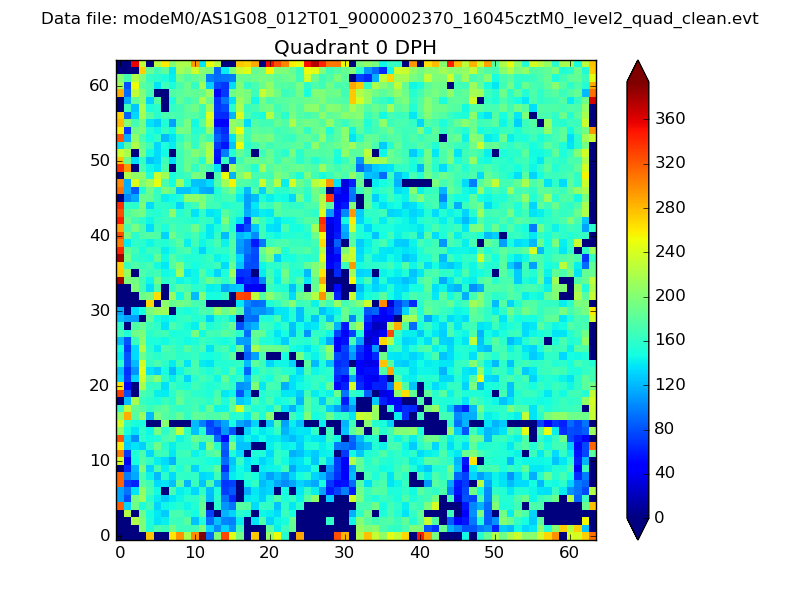 |
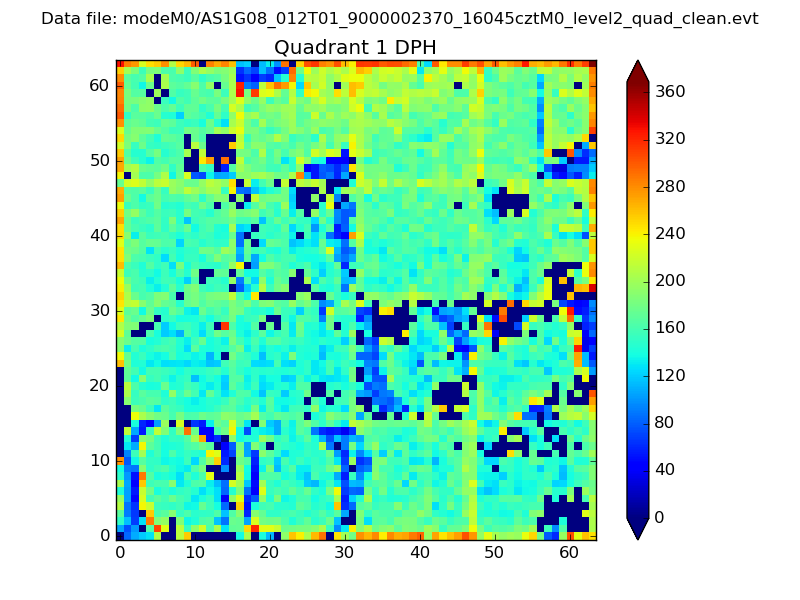 |
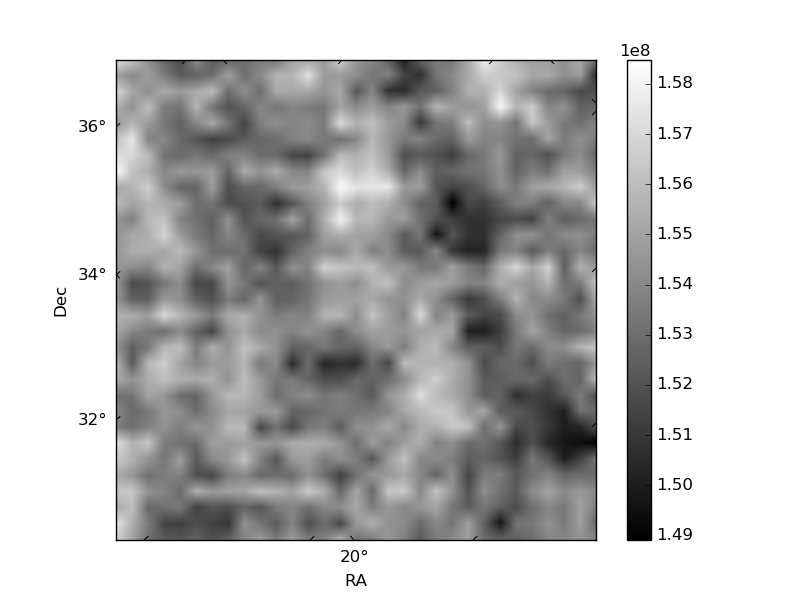
Quadrant B |
|---|---|---|---|
| Quadrant D | 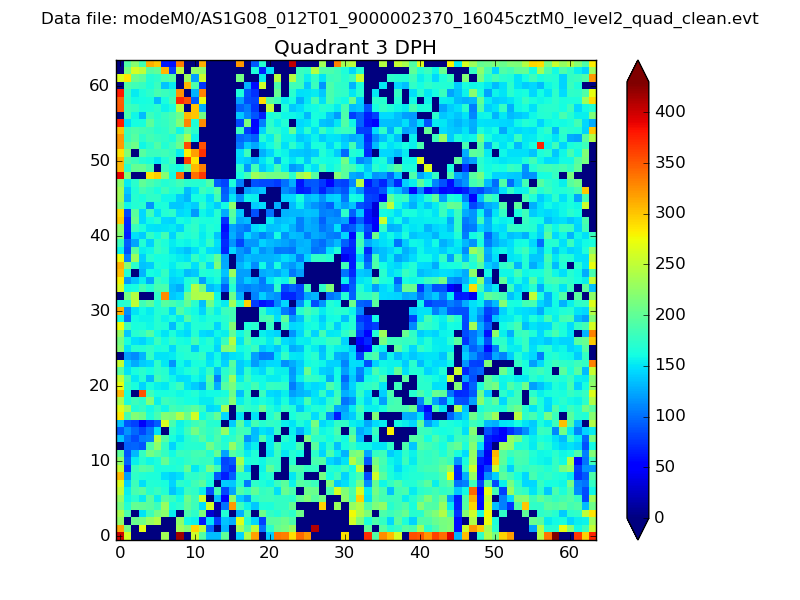 |
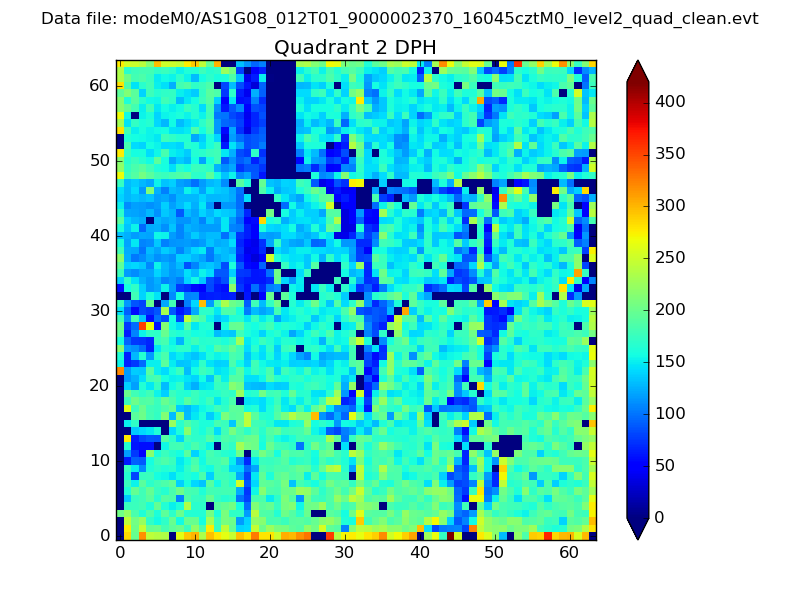 |
Quadrant C |
| Plot type | Count rate plots | Images |
|---|---|---|
| Comparison with Poisson distribution Blue bars denote a histogram of data divided into 1 sec bins. Red curve is a Poisson curve with rate = median count rate of data. |
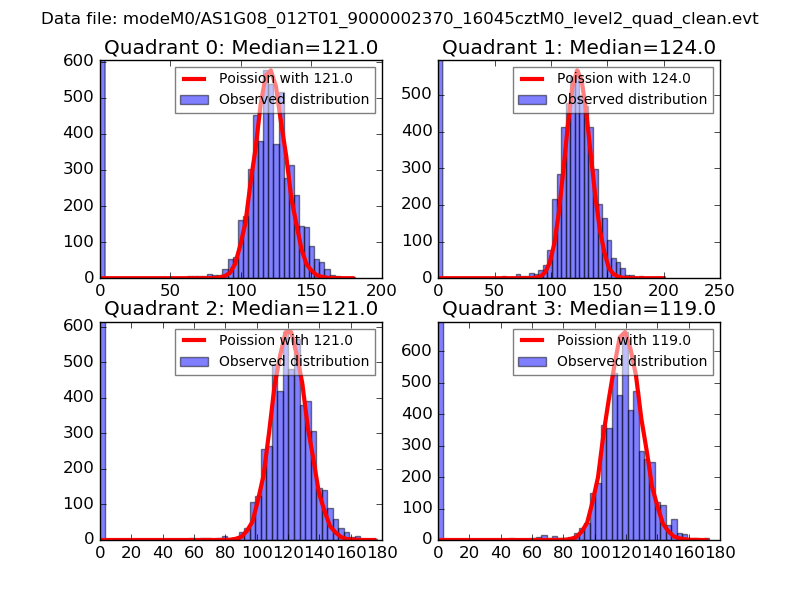 |
 |
| Quadrant-wise count rates Data is divided into 100 sec bins |
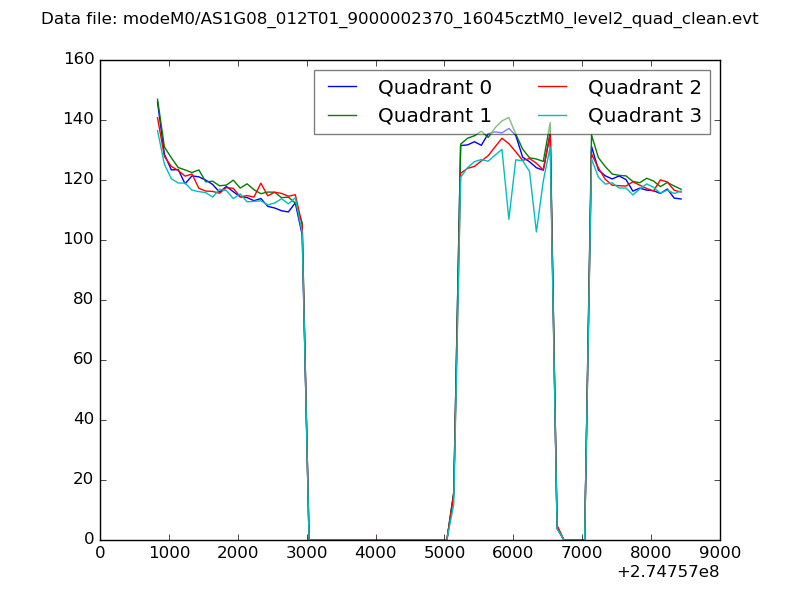 |
|
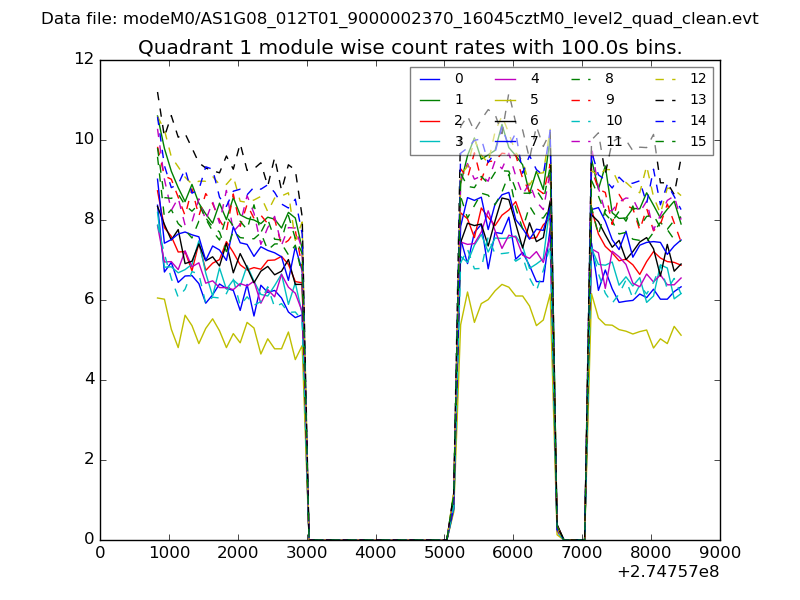
| Module-wise count rates for Quadrant A Data is divided into 100 sec bins |
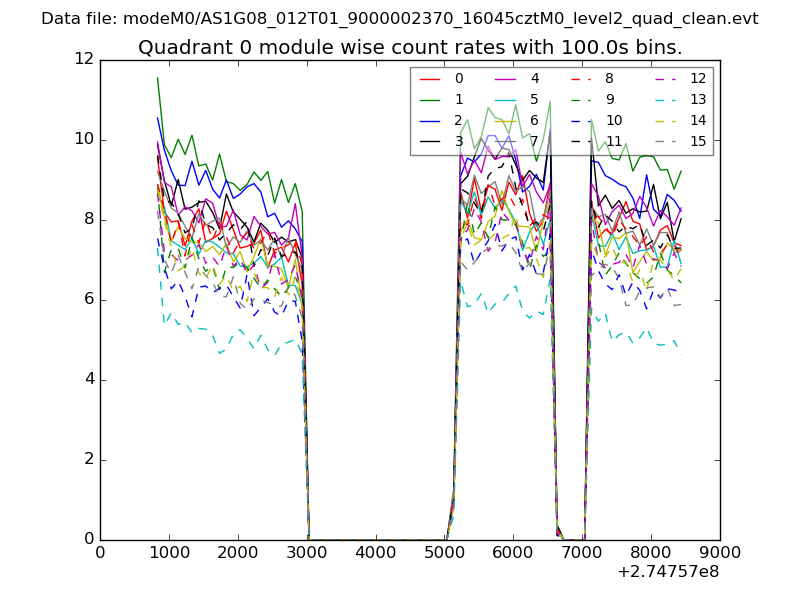 |
 |
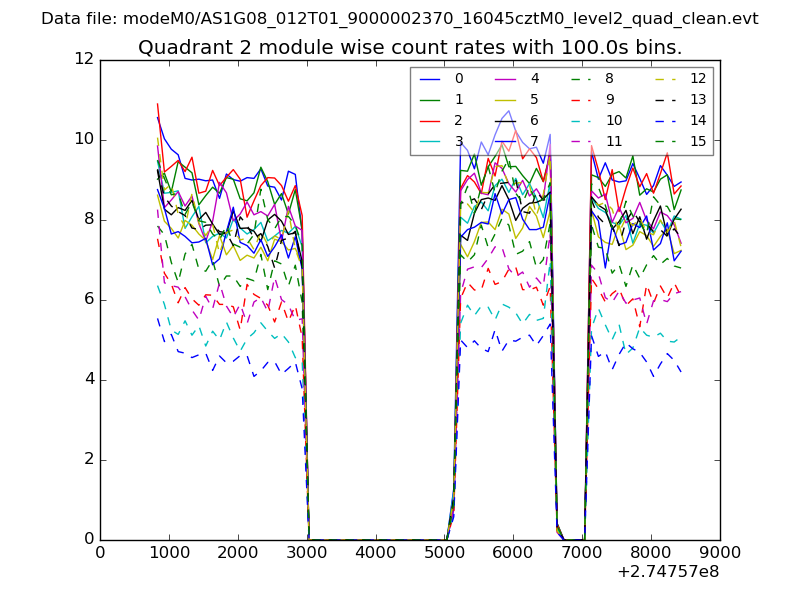
| Module-wise count rates for Quadrant B Data is divided into 100 sec bins |
 |
 |
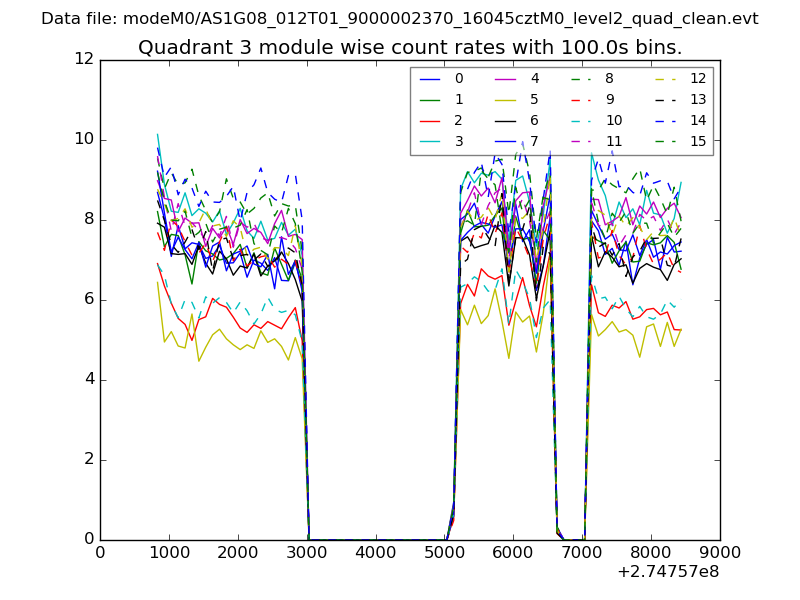
| Module-wise count rates for Quadrant C Data is divided into 100 sec bins |
 |
 |
| Module-wise count rates for Quadrant D Data is divided into 100 sec bins |
 |
 |
| Parameter | Plot |
|---|---|
| CZT HV Monitor | 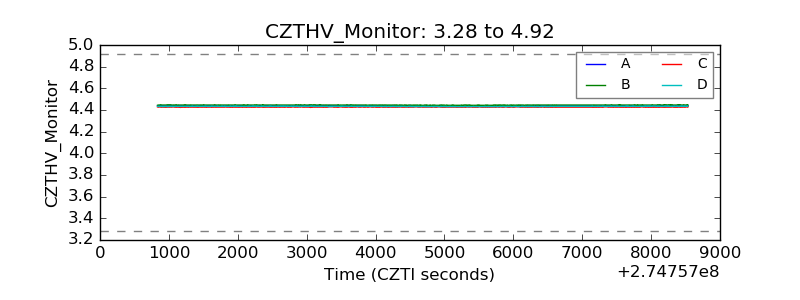 |
| D_VDD | 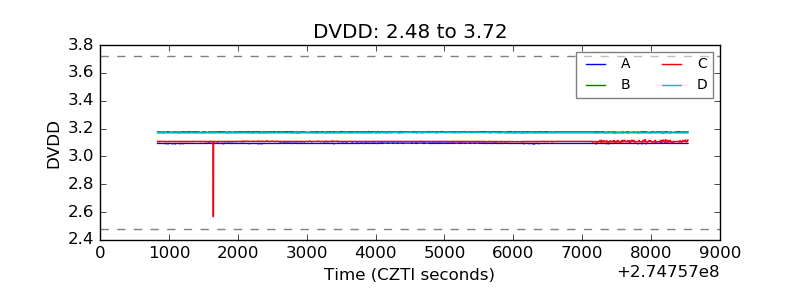 |
| Temperature 1 | 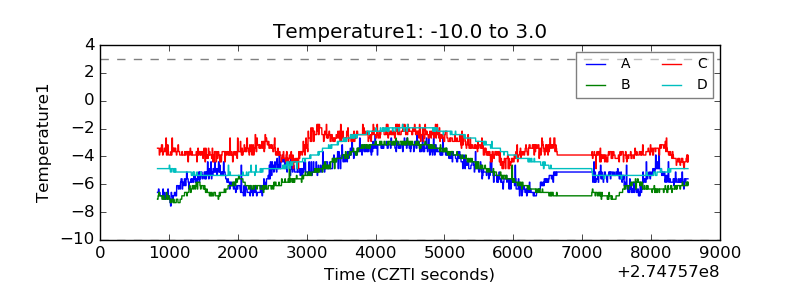 |
| Veto HV Monitor | 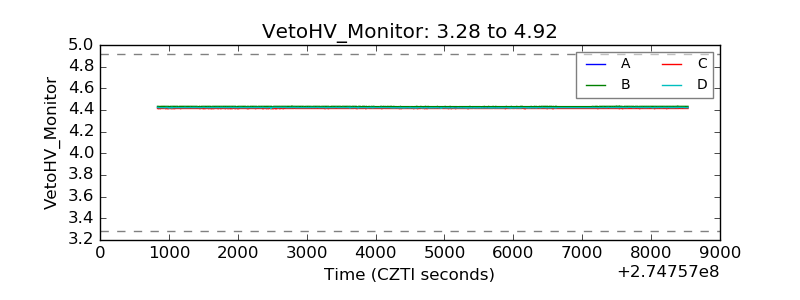 |
| Veto LLD | 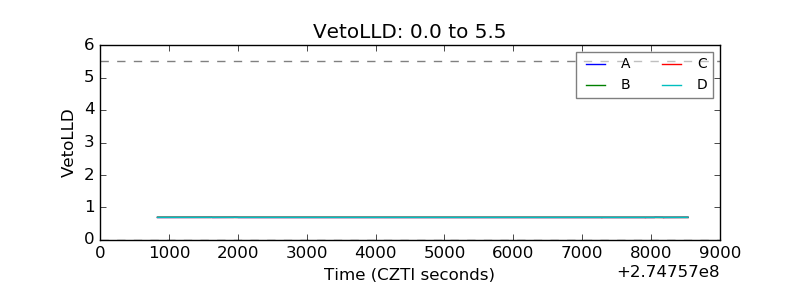 |
| Alpha Counter | 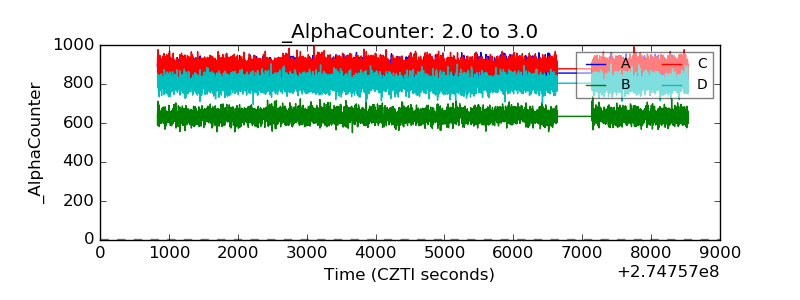 |
| _CPM_Rate | 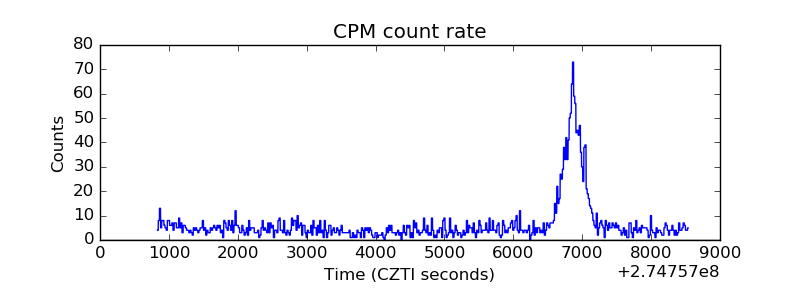 |
| CZT Counter | 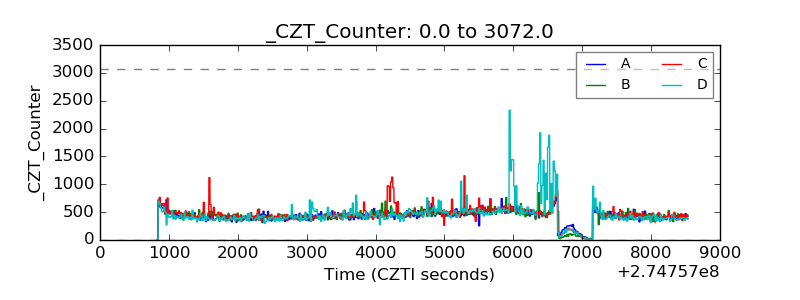 |
| +2.5 Volts monitor |  |
| +5 Volts monitor |  |
| _ROLL_ROT | 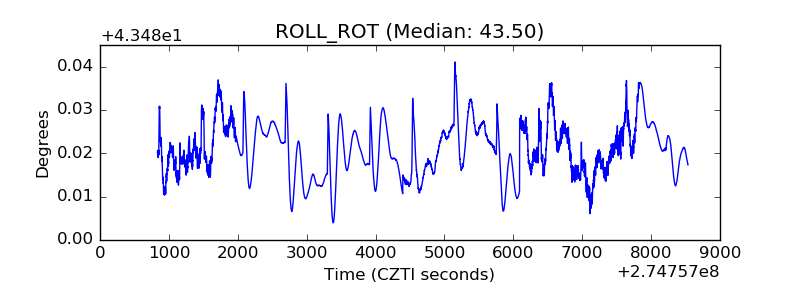 |
| _Roll_DEC | 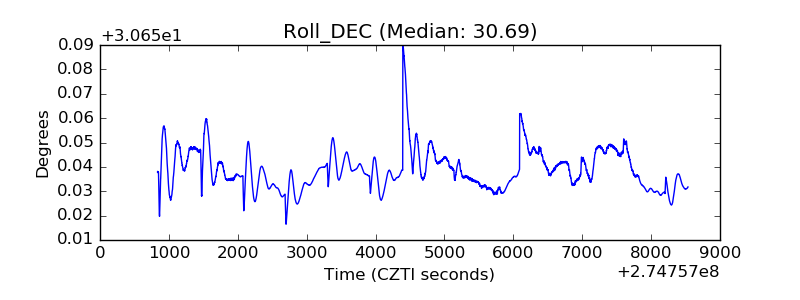 |
| _Roll_RA | 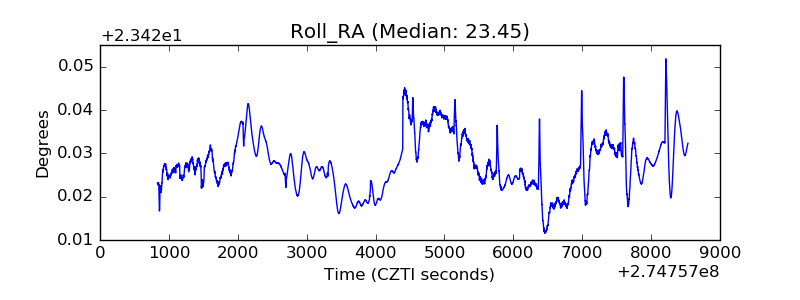 |
| Veto Counter |  |