| Param | Original file | Final file |
|---|---|---|
| Filename | modeM0/AS1G08_012T01_9000002370_16052cztM0_level2.evt | modeM0/AS1G08_012T01_9000002370_16052cztM0_level2_quad_clean.evt |
| Size (bytes) | 475,634,880 | 86,647,680 |
| Size | 453.6 MB | 82.6 MB |
| Events in quadrant A | 3,498,271 | 554,788 |
| Events in quadrant B | 3,307,891 | 566,473 |
| Events in quadrant C | 3,818,013 | 540,420 |
| Events in quadrant D | 3,370,746 | 540,653 |
| Mode M0 | |||
|---|---|---|---|
| Quadrant | BADHDUFLAG | Total packets | Discarded packets |
| A | 0 | 14599 | 3 |
| B | 0 | 13744 | 2 |
| C | 0 | 15288 | 2 |
| D | 0 | 13984 | 2 |
| Mode M9 | |||
|---|---|---|---|
| Quadrant | BADHDUFLAG | Total packets | Discarded packets |
| A | 0 | 23 | 0 |
| B | 0 | 23 | 0 |
| C | 0 | 23 | 0 |
| D | 0 | 24 | 0 |
| Mode SS | |||
|---|---|---|---|
| Quadrant | BADHDUFLAG | Total packets | Discarded packets |
| A | 0 | 122 | 0 |
| B | 0 | 122 | 0 |
| C | 0 | 122 | 0 |
| D | 0 | 122 | 0 |
| Quadrant | Total seconds | Saturated seconds | Saturation percentage |
|---|---|---|---|
| A | 6040 | 51 | 0.844371% |
| B | 6040 | 47 | 0.778146% |
| C | 6040 | 242 | 4.006623% |
| D | 6040 | 57 | 0.943709% |
Noise dominated data is calculated using 1-second bins in cleaned event files. If a bin has >2000 counts, and if more than 50% of those come from <1% of pixels, then it is considered to be noise-dominated and hence unusable.
| Quadrant | # 1 sec bins | Bins with >0 counts | Bins with >2000 counts | High rate bins dominated by noise | Noise dominated (total time) | Noise dominated (detector-on time) | Marked lightcurve |
|---|---|---|---|---|---|---|---|
| A | 7421 | 6042 | 1 | 1 | 0.01% | 0.02% | 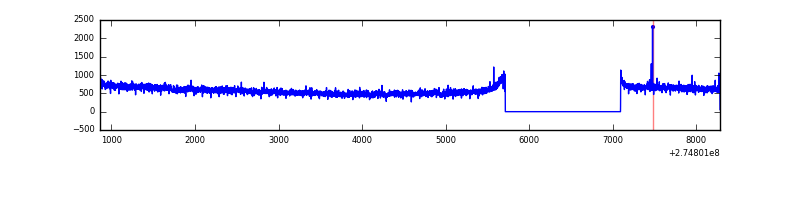 |
| B | 7421 | 6041 | 2 | 2 | 0.03% | 0.03% | 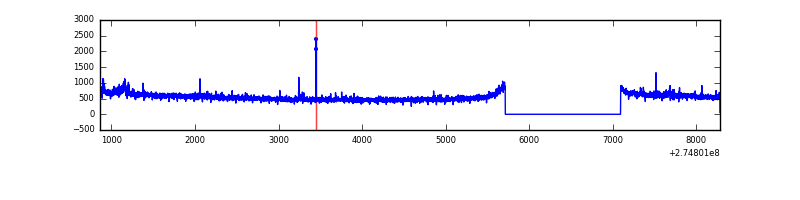 |
| C | 7421 | 6041 | 110 | 110 | 1.48% | 1.82% | 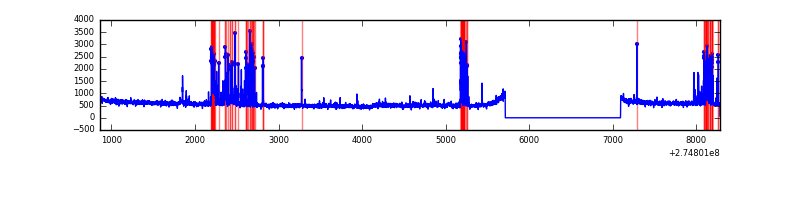 |
| D | 7421 | 6042 | 31 | 31 | 0.42% | 0.51% | 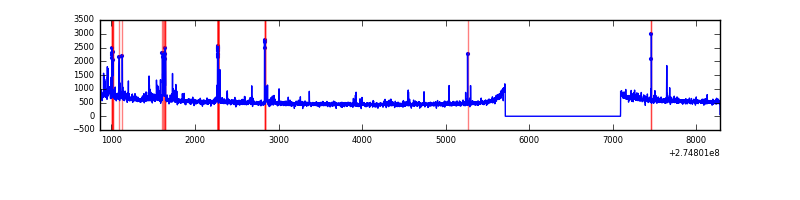 |
Top three noisy pixels from each quadrant. If the there are fewer than three noisy pixels in the level2.evt file, extra rows are filled as -1
| Pixel properties | Quadrant properties | ||||||
|---|---|---|---|---|---|---|---|
| Quadrant | DetID | PixID | Counts | Sigma | Mean | Median | Sigma |
| A | 3 | 80 | 280012 | 1679.76 | 829 | 814 | 166.2 |
| A | 15 | 222 | 16737 | 95.8 | 829 | 814 | 166.2 |
| A | 0 | 226 | 7255 | 38.75 | 829 | 814 | 166.2 |
| B | 0 | 230 | 19638 | 121.37 | 830 | 812 | 155.1 |
| B | 12 | 111 | 17517 | 107.7 | 830 | 812 | 155.1 |
| B | 11 | 111 | 15317 | 93.51 | 830 | 812 | 155.1 |
| C | 9 | 236 | 444407 | 2403.96 | 801 | 809 | 184.5 |
| C | 14 | 238 | 125710 | 676.87 | 801 | 809 | 184.5 |
| C | 3 | 233 | 90484 | 485.97 | 801 | 809 | 184.5 |
| D | 12 | 218 | 186226 | 934.53 | 819 | 796 | 198.4 |
| D | 2 | 152 | 53831 | 267.28 | 819 | 796 | 198.4 |
| D | 4 | 239 | 20646 | 100.04 | 819 | 796 | 198.4 |
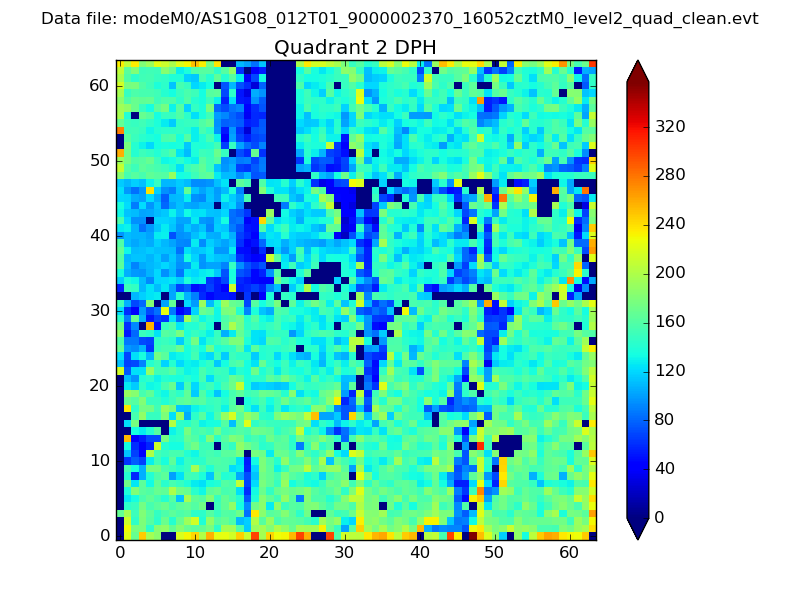
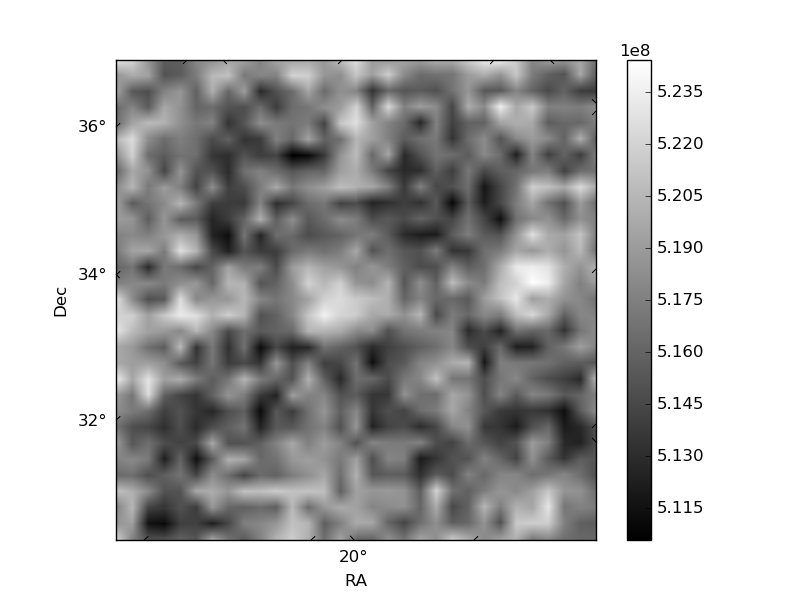
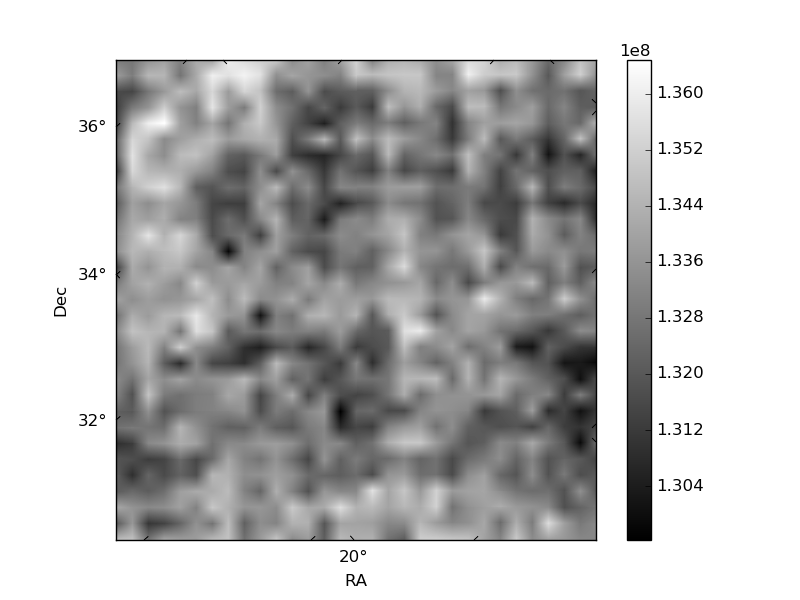
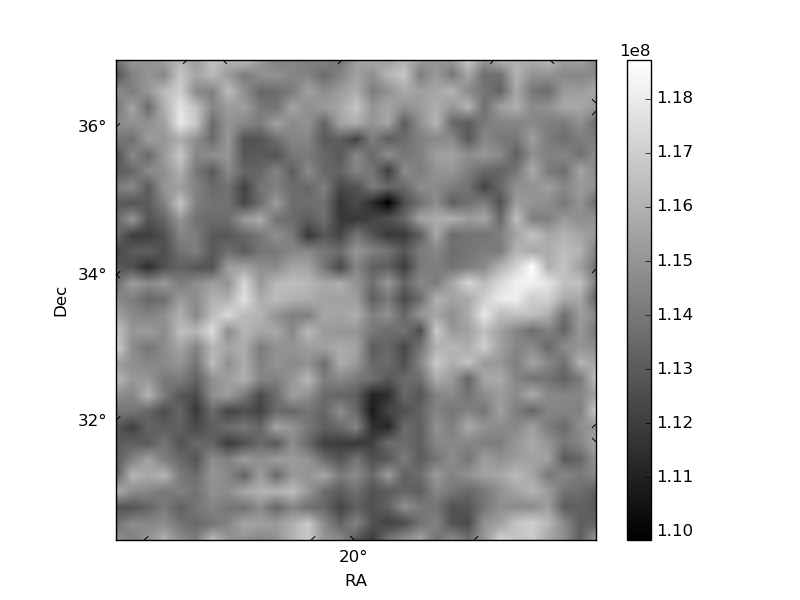
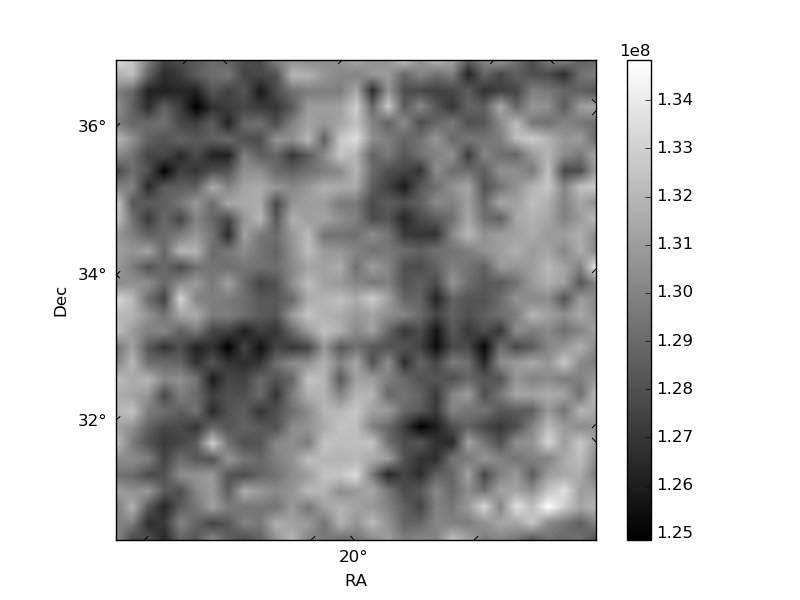
Histogram calculated using DETX and DETY for each event in the final _common_clean file
| Quadrant A | 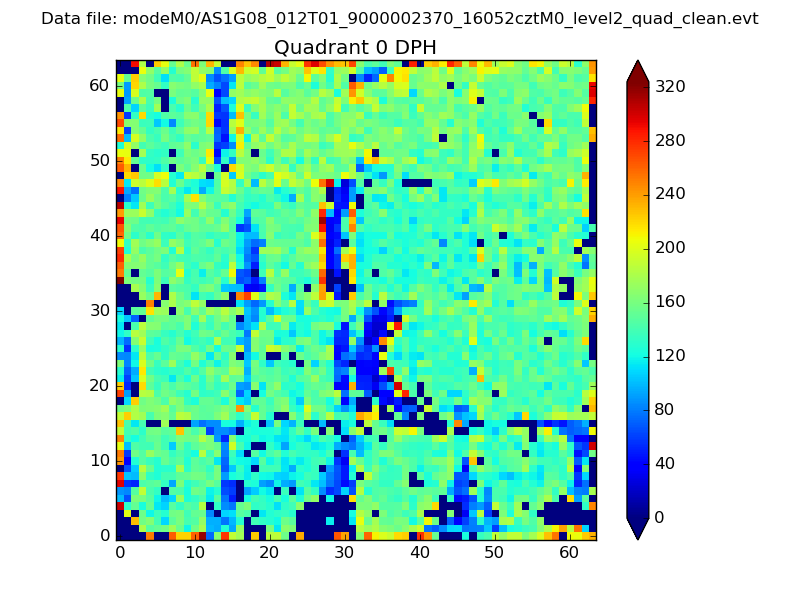 |
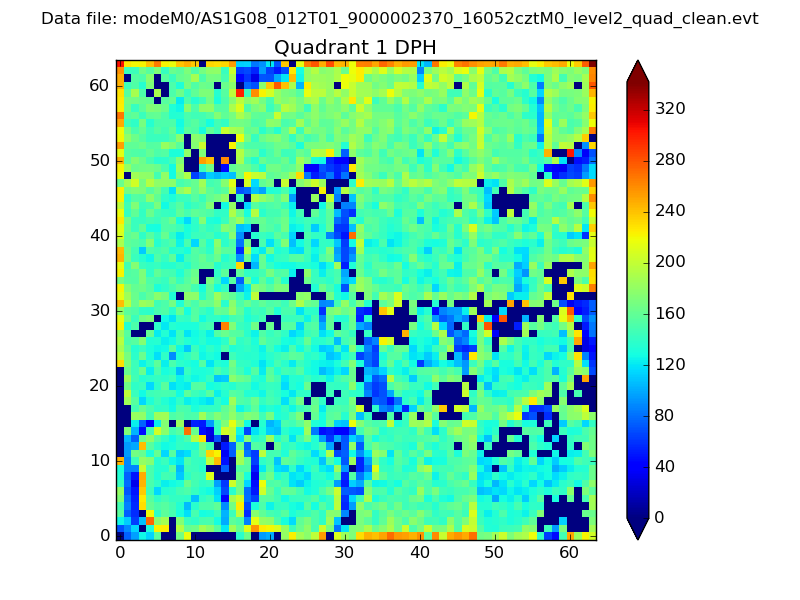 |
Quadrant B |
|---|---|---|---|
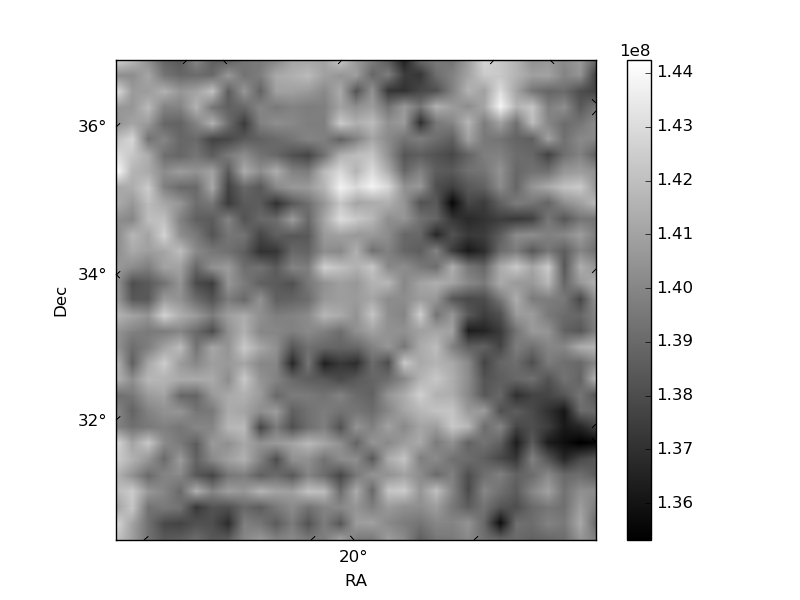
| Quadrant D | 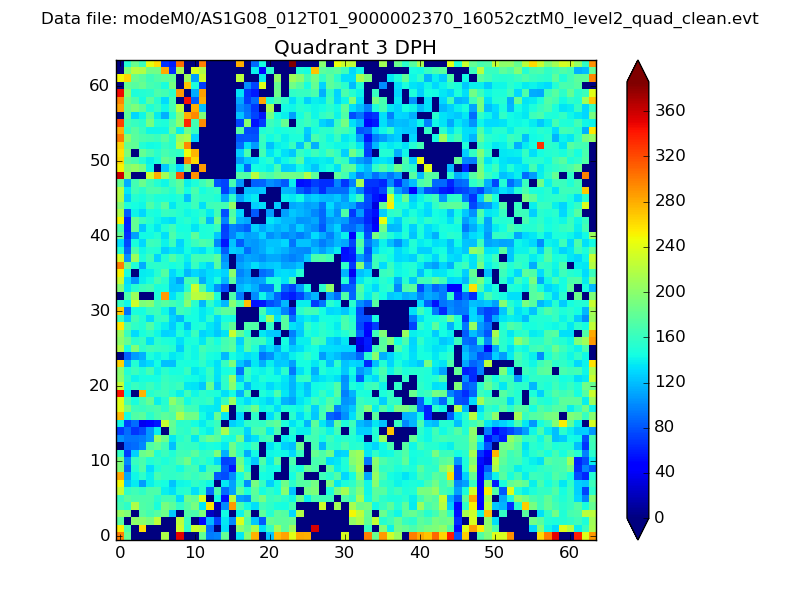 |
 |
Quadrant C |
| Plot type | Count rate plots | Images |
|---|---|---|
| Comparison with Poisson distribution Blue bars denote a histogram of data divided into 1 sec bins. Red curve is a Poisson curve with rate = median count rate of data. |
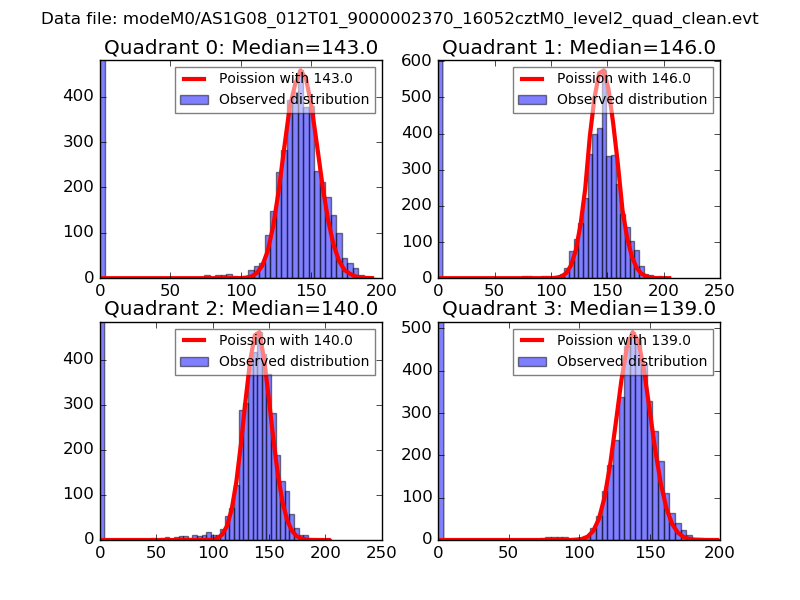 |
 |
| Quadrant-wise count rates Data is divided into 100 sec bins |
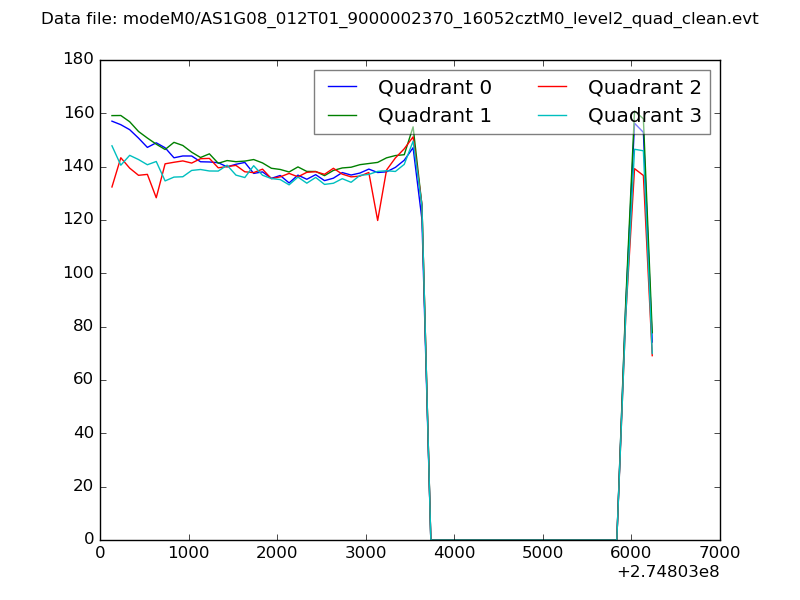 |
|
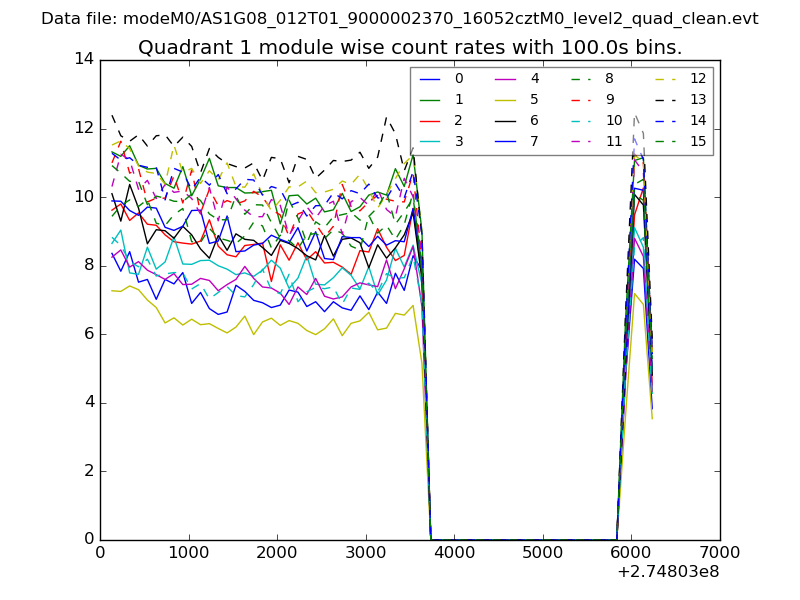
| Module-wise count rates for Quadrant A Data is divided into 100 sec bins |
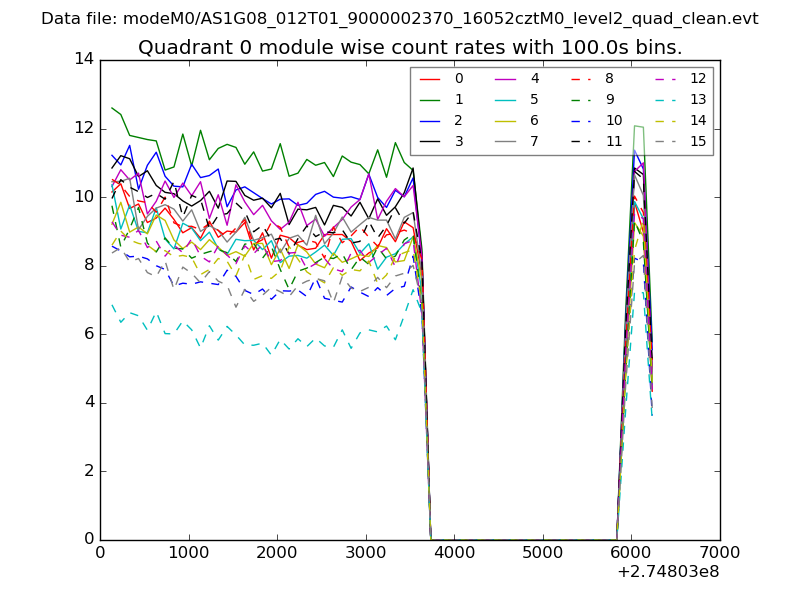 |
 |
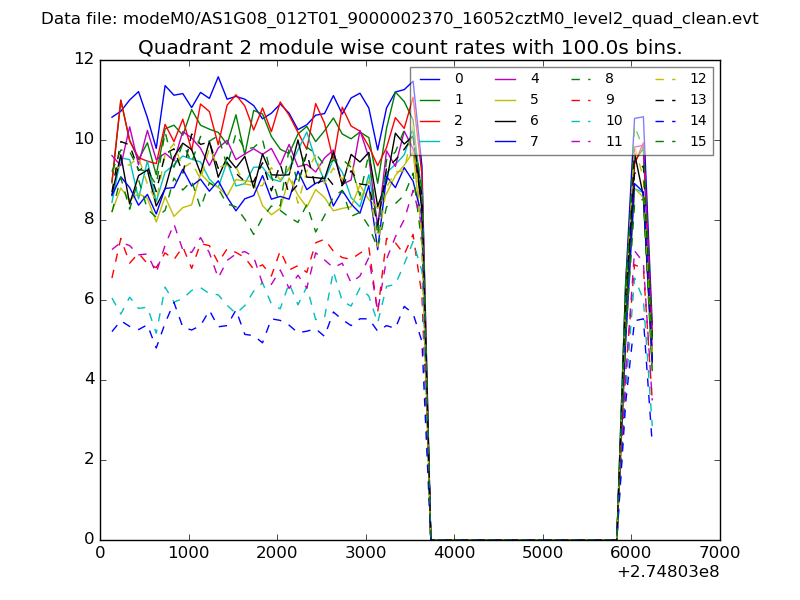
| Module-wise count rates for Quadrant B Data is divided into 100 sec bins |
 |
 |
| Module-wise count rates for Quadrant C Data is divided into 100 sec bins |
 |
 |
| Module-wise count rates for Quadrant D Data is divided into 100 sec bins |
 |
 |
| Parameter | Plot |
|---|---|
| CZT HV Monitor | 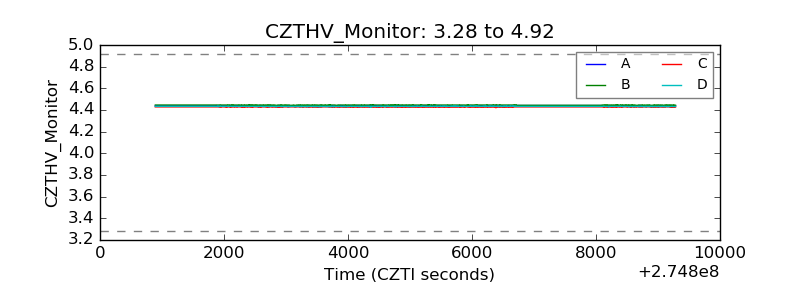 |
| D_VDD | 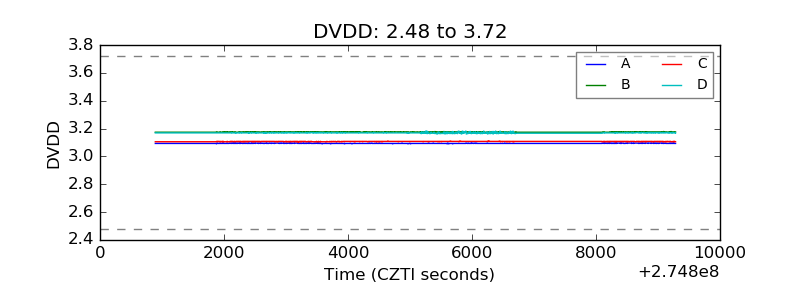 |
| Temperature 1 | 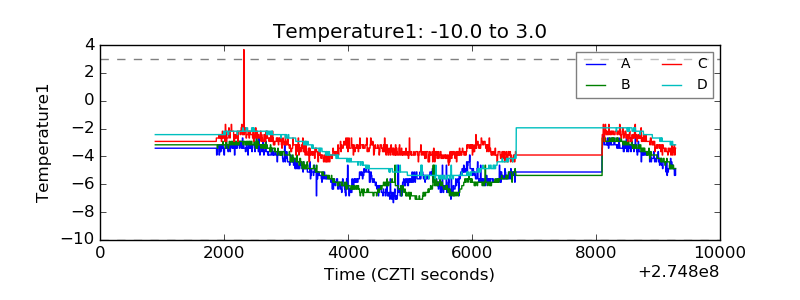 |
| Veto HV Monitor | 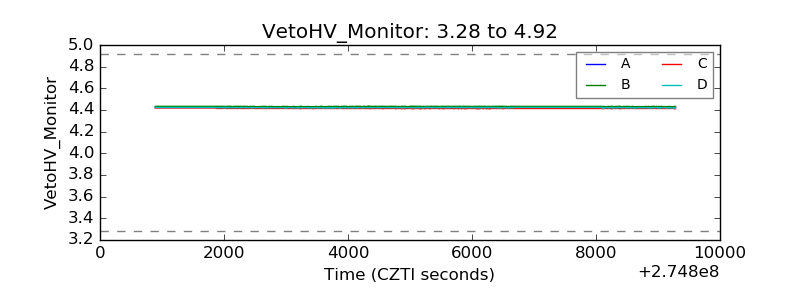 |
| Veto LLD |  |
| Alpha Counter | 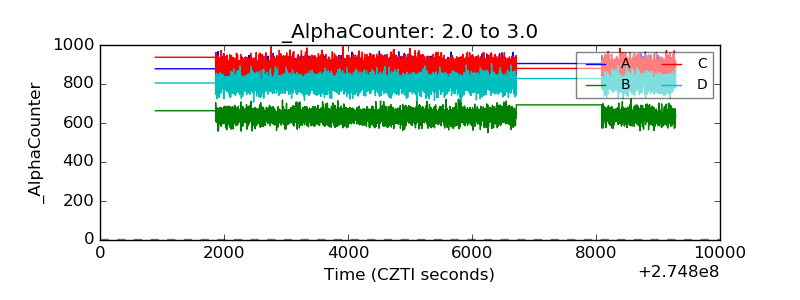 |
| _CPM_Rate | 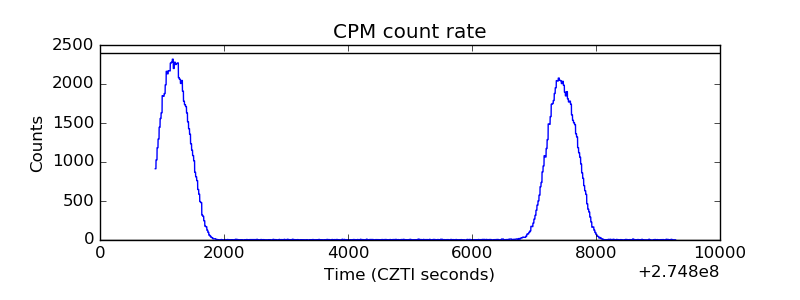 |
| CZT Counter | 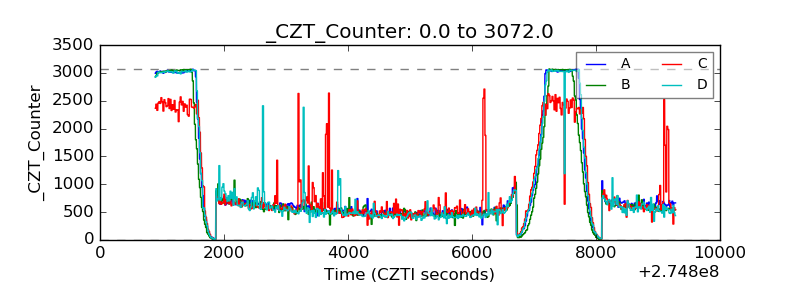 |
| +2.5 Volts monitor |  |
| +5 Volts monitor |  |
| _ROLL_ROT | 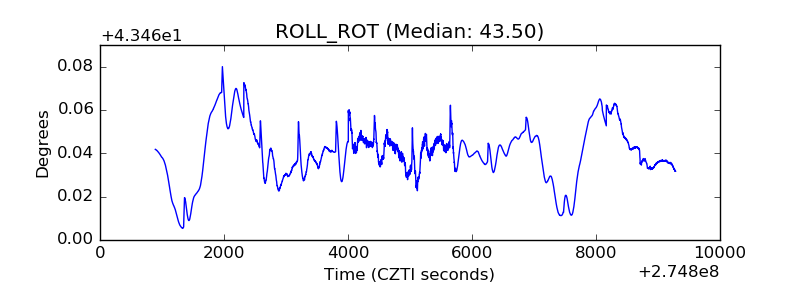 |
| _Roll_DEC | 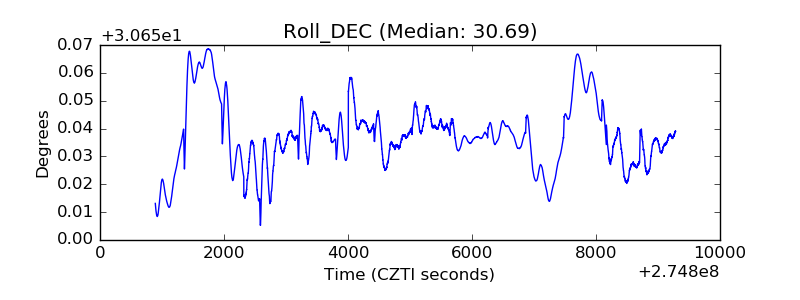 |
| _Roll_RA | 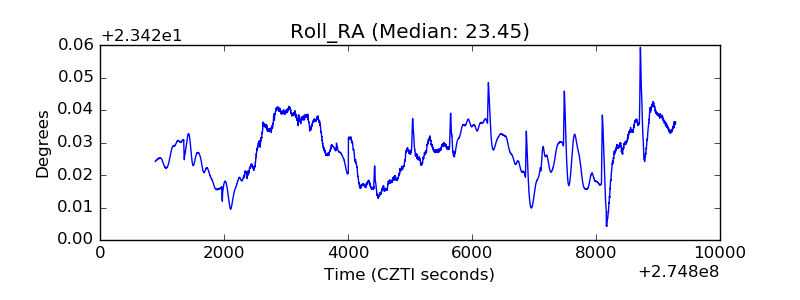 |
| Veto Counter |  |