| Param | Original file | Final file |
|---|---|---|
| Filename | modeM0/AS1G08_012T01_9000002370_16054cztM0_level2.evt | modeM0/AS1G08_012T01_9000002370_16054cztM0_level2_quad_clean.evt |
| Size (bytes) | 488,917,440 | 103,201,920 |
| Size | 466.3 MB | 98.4 MB |
| Events in quadrant A | 3,567,260 | 662,952 |
| Events in quadrant B | 3,591,269 | 678,586 |
| Events in quadrant C | 3,697,361 | 657,703 |
| Events in quadrant D | 3,482,942 | 645,913 |
| Mode M0 | |||
|---|---|---|---|
| Quadrant | BADHDUFLAG | Total packets | Discarded packets |
| A | 0 | 14938 | 3 |
| B | 0 | 15111 | 2 |
| C | 0 | 15307 | 2 |
| D | 0 | 14898 | 2 |
| Mode M9 | |||
|---|---|---|---|
| Quadrant | BADHDUFLAG | Total packets | Discarded packets |
| A | 0 | 24 | 0 |
| B | 0 | 24 | 0 |
| C | 0 | 24 | 0 |
| D | 0 | 24 | 0 |
| Mode SS | |||
|---|---|---|---|
| Quadrant | BADHDUFLAG | Total packets | Discarded packets |
| A | 0 | 142 | 0 |
| B | 0 | 142 | 0 |
| C | 0 | 142 | 0 |
| D | 0 | 142 | 0 |
| Quadrant | Total seconds | Saturated seconds | Saturation percentage |
|---|---|---|---|
| A | 6893 | 80 | 1.160598% |
| B | 6893 | 118 | 1.711882% |
| C | 6893 | 173 | 2.509793% |
| D | 6893 | 80 | 1.160598% |
Noise dominated data is calculated using 1-second bins in cleaned event files. If a bin has >2000 counts, and if more than 50% of those come from <1% of pixels, then it is considered to be noise-dominated and hence unusable.
| Quadrant | # 1 sec bins | Bins with >0 counts | Bins with >2000 counts | High rate bins dominated by noise | Noise dominated (total time) | Noise dominated (detector-on time) | Marked lightcurve |
|---|---|---|---|---|---|---|---|
| A | 9304 | 6895 | 0 | 0 | 0.00% | 0.00% |  |
| B | 9304 | 6894 | 12 | 12 | 0.13% | 0.17% | 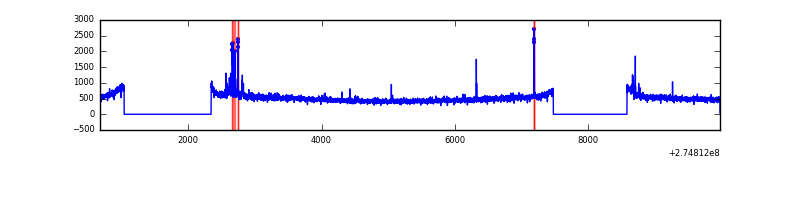 |
| C | 9304 | 6895 | 15 | 15 | 0.16% | 0.22% | 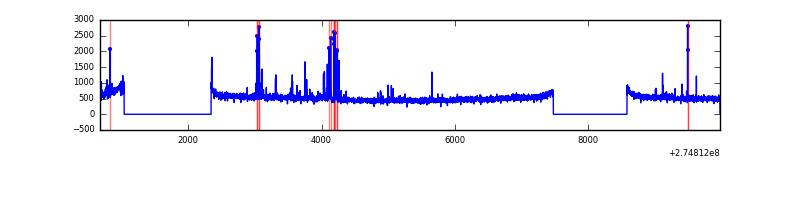 |
| D | 9304 | 6895 | 13 | 13 | 0.14% | 0.19% | 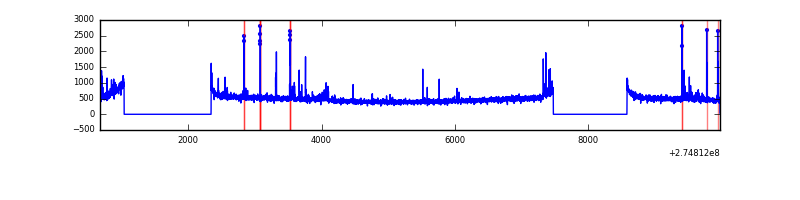 |
Top three noisy pixels from each quadrant. If the there are fewer than three noisy pixels in the level2.evt file, extra rows are filled as -1
| Pixel properties | Quadrant properties | ||||||
|---|---|---|---|---|---|---|---|
| Quadrant | DetID | PixID | Counts | Sigma | Mean | Median | Sigma |
| A | 3 | 80 | 142609 | 795.54 | 885 | 865 | 178.2 |
| A | 15 | 222 | 12498 | 65.29 | 885 | 865 | 178.2 |
| A | 0 | 226 | 7568 | 37.62 | 885 | 865 | 178.2 |
| B | 0 | 182 | 64485 | 378.29 | 887 | 863 | 168.2 |
| B | 4 | 216 | 24848 | 142.61 | 887 | 863 | 168.2 |
| B | 12 | 111 | 20272 | 115.4 | 887 | 863 | 168.2 |
| C | 9 | 236 | 163048 | 809.98 | 862 | 870 | 200.2 |
| C | 14 | 238 | 132696 | 658.39 | 862 | 870 | 200.2 |
| C | 3 | 233 | 38766 | 189.27 | 862 | 870 | 200.2 |
| D | 2 | 152 | 73968 | 344.97 | 874 | 851 | 212.0 |
| D | 2 | 120 | 54942 | 255.2 | 874 | 851 | 212.0 |
| D | 12 | 218 | 36410 | 167.77 | 874 | 851 | 212.0 |
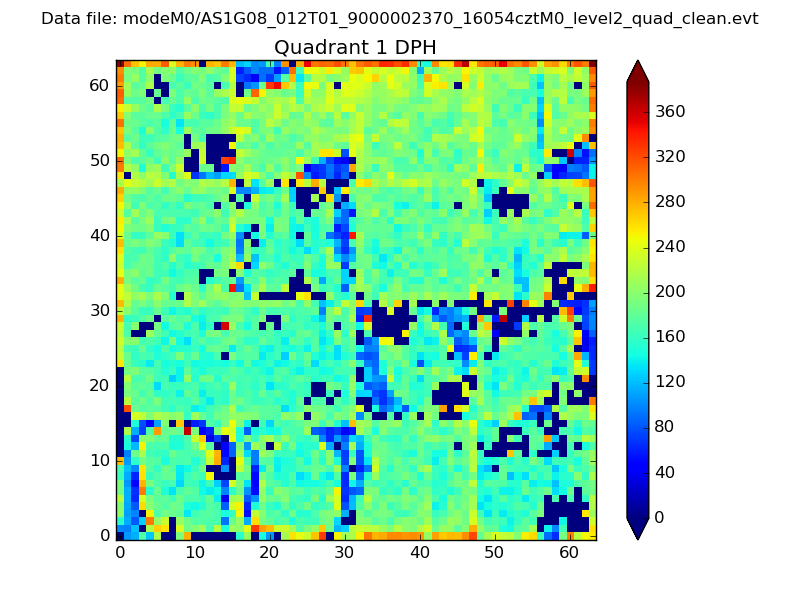
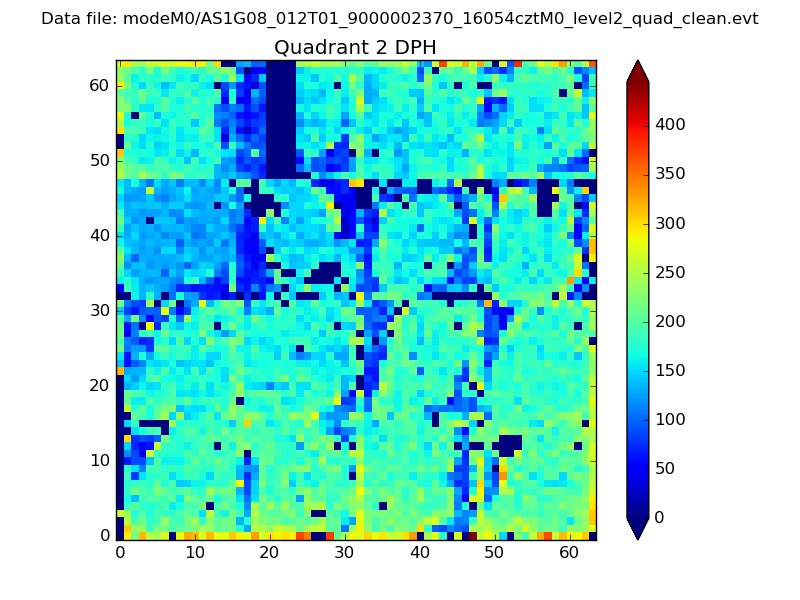
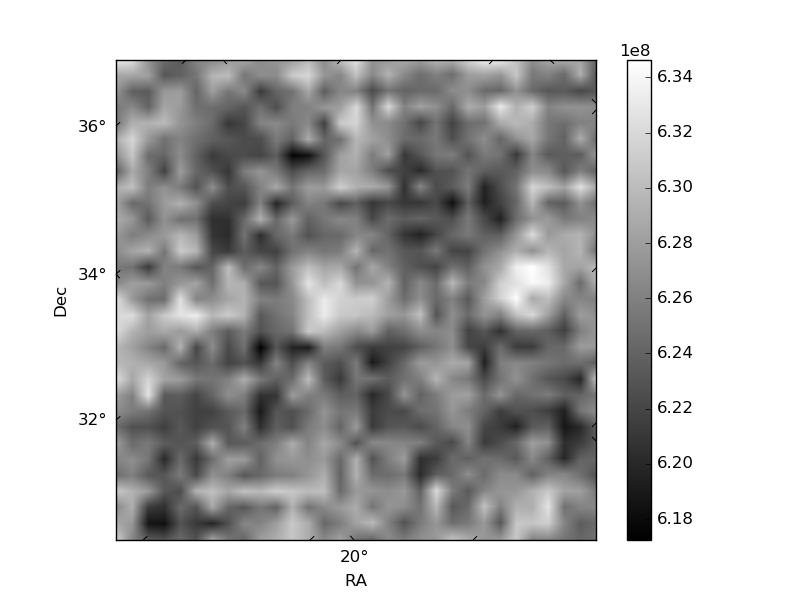
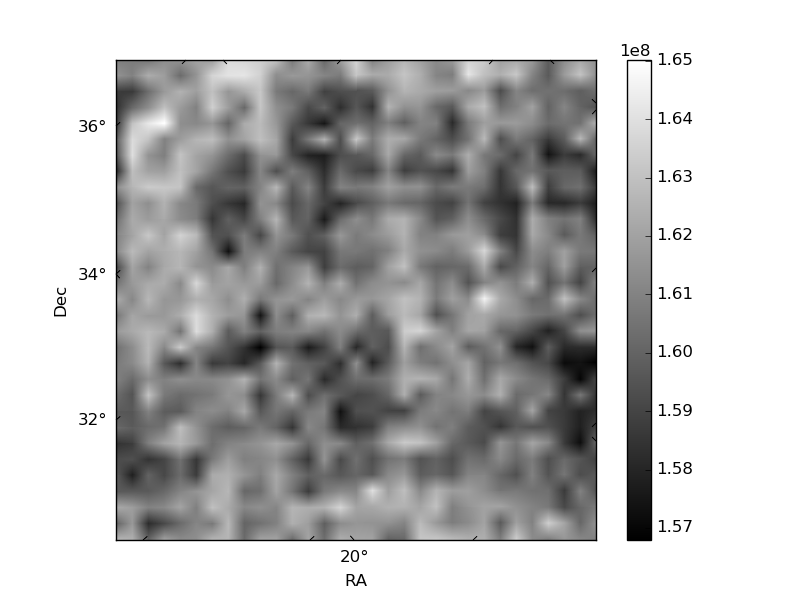
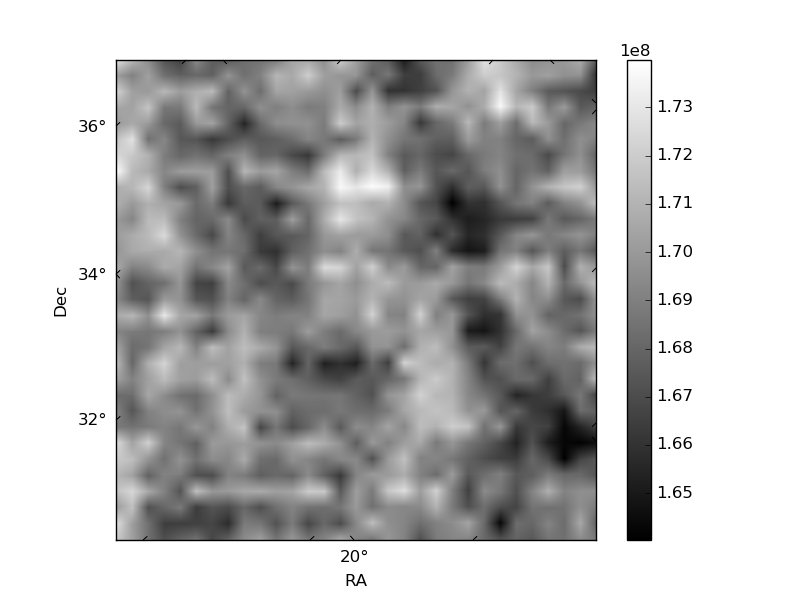
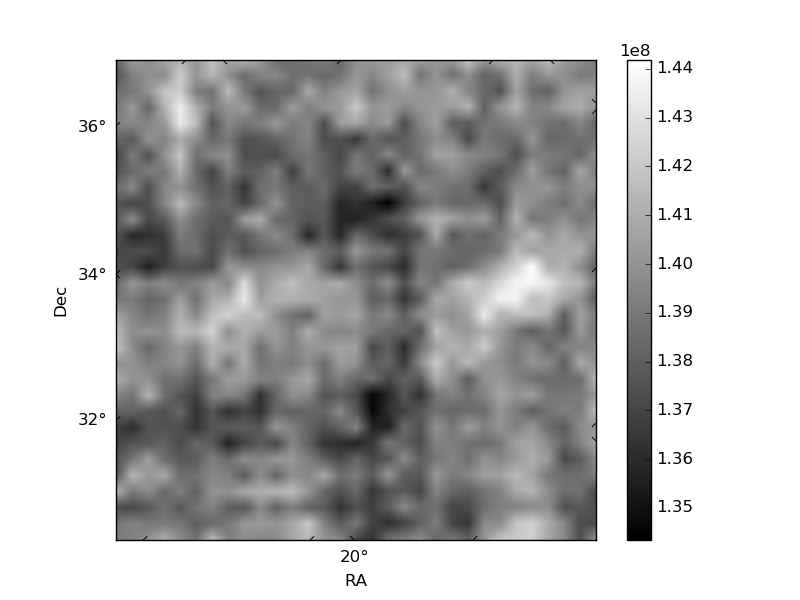
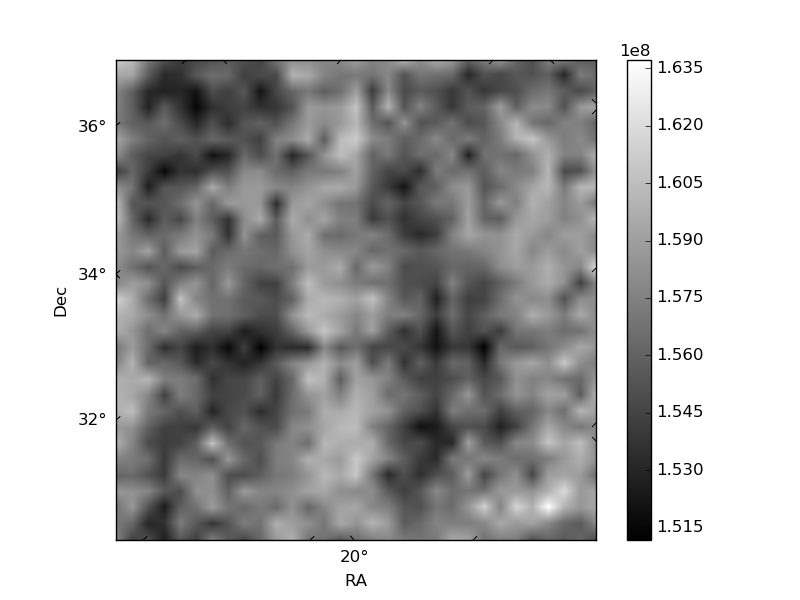
Histogram calculated using DETX and DETY for each event in the final _common_clean file
| Quadrant A | 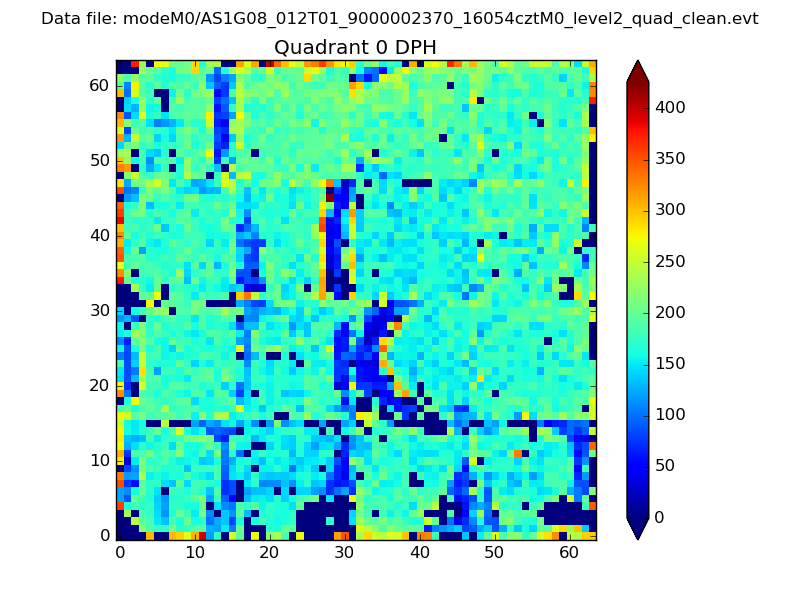 |
 |
Quadrant B |
|---|---|---|---|
| Quadrant D | 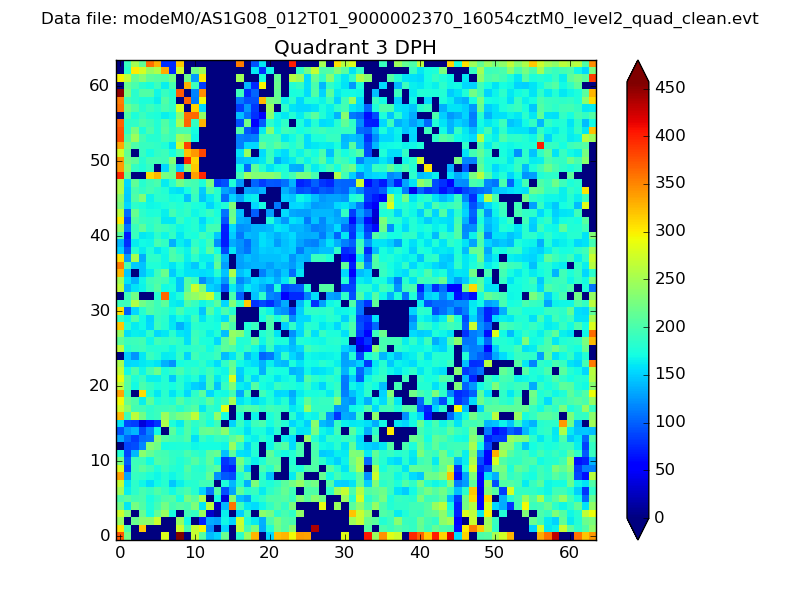 |
 |
Quadrant C |
| Plot type | Count rate plots | Images |
|---|---|---|
| Comparison with Poisson distribution Blue bars denote a histogram of data divided into 1 sec bins. Red curve is a Poisson curve with rate = median count rate of data. |
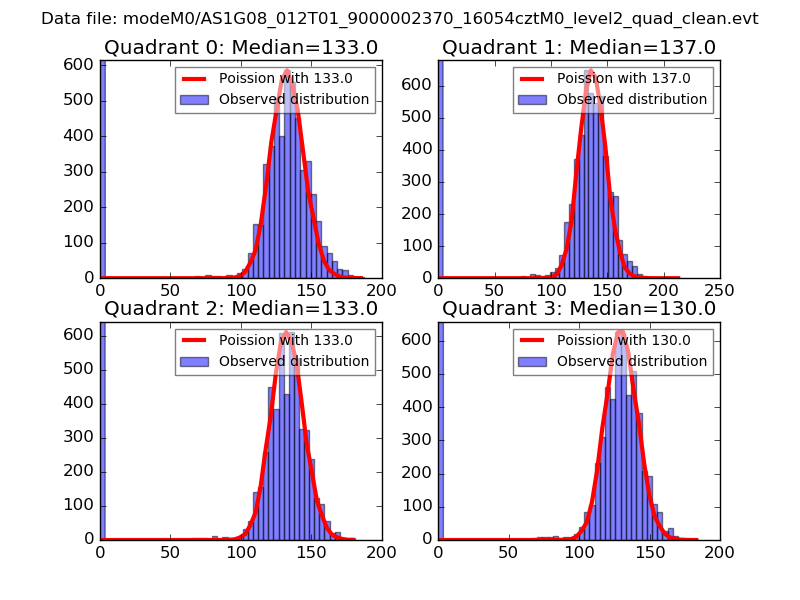 |
 |
| Quadrant-wise count rates Data is divided into 100 sec bins |
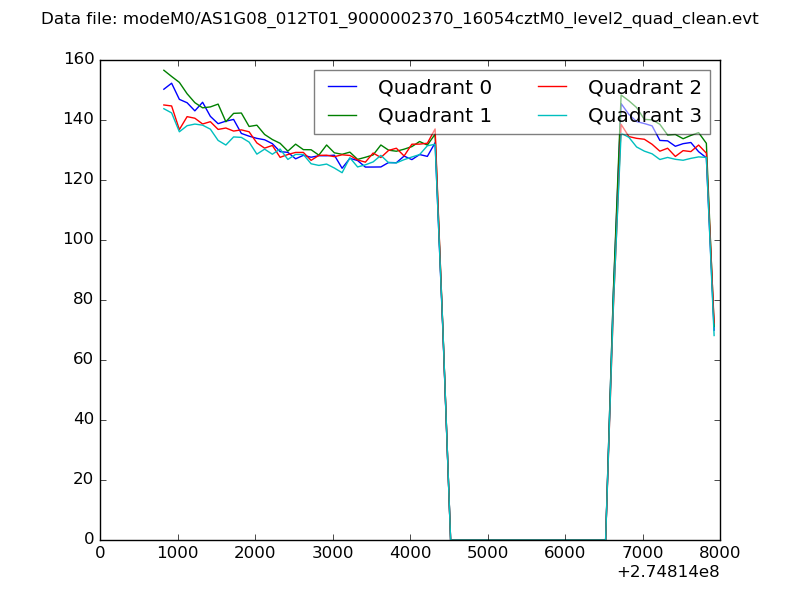 |
|
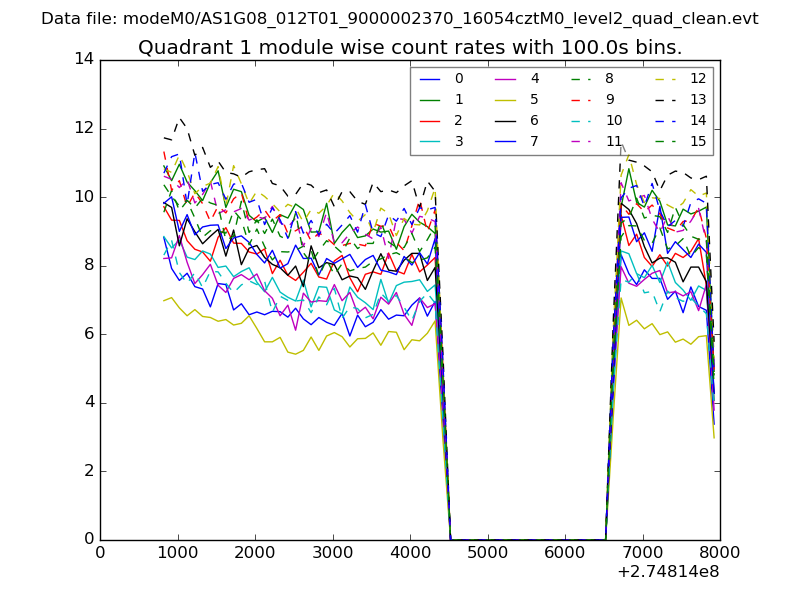
| Module-wise count rates for Quadrant A Data is divided into 100 sec bins |
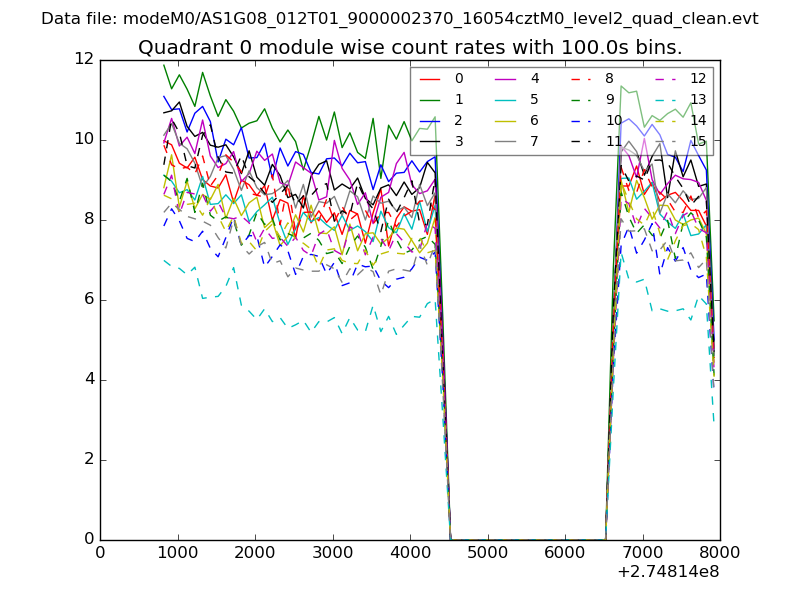 |
 |
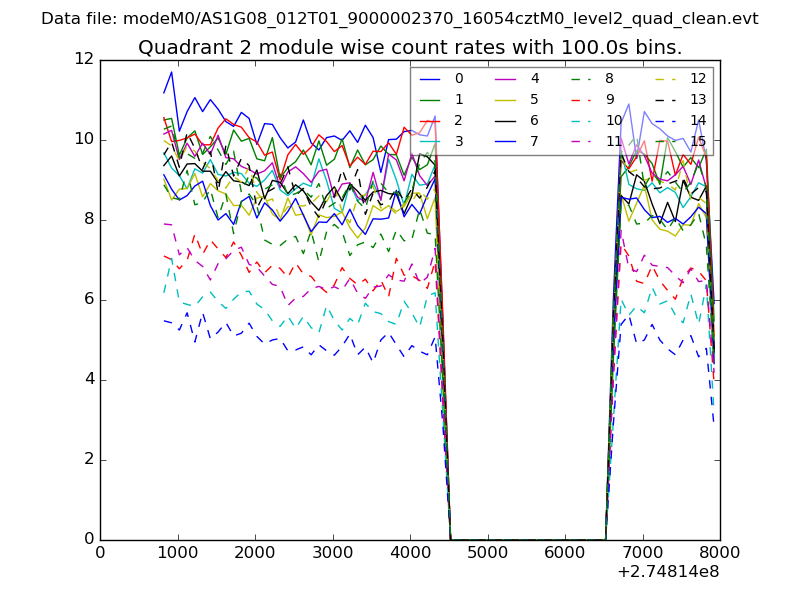
| Module-wise count rates for Quadrant B Data is divided into 100 sec bins |
 |
 |
| Module-wise count rates for Quadrant C Data is divided into 100 sec bins |
 |
 |
| Module-wise count rates for Quadrant D Data is divided into 100 sec bins |
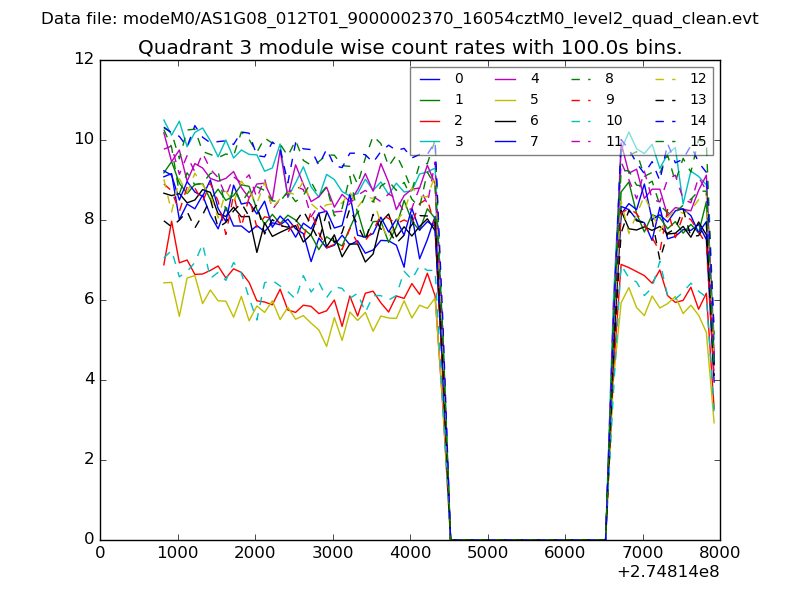 |
 |
| Parameter | Plot |
|---|---|
| CZT HV Monitor | 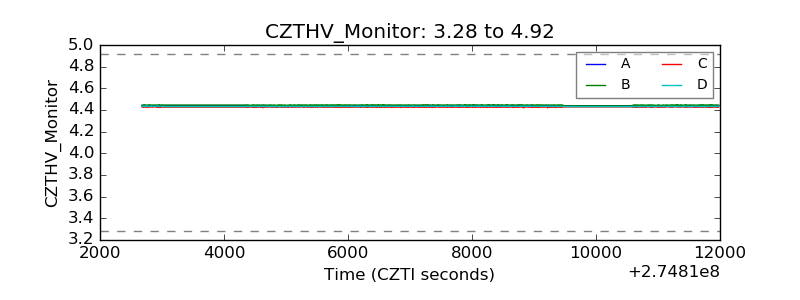 |
| D_VDD |  |
| Temperature 1 | 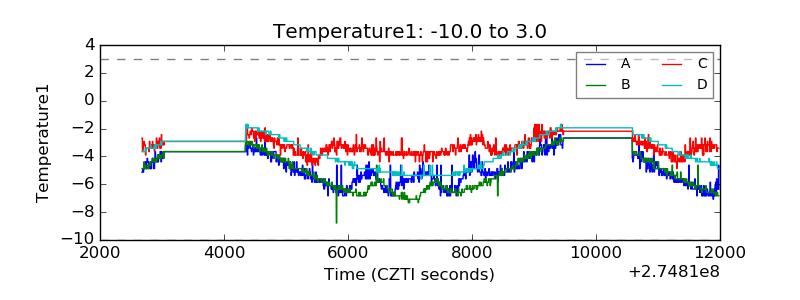 |
| Veto HV Monitor | 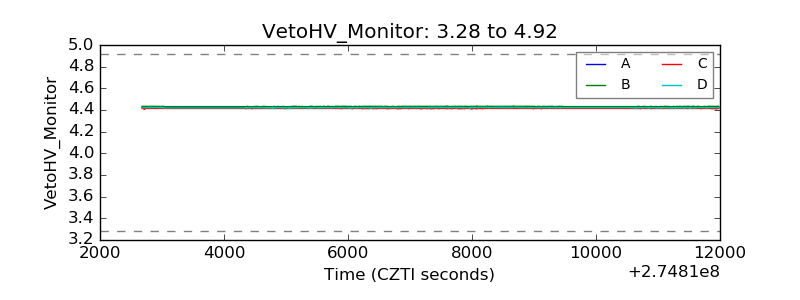 |
| Veto LLD | 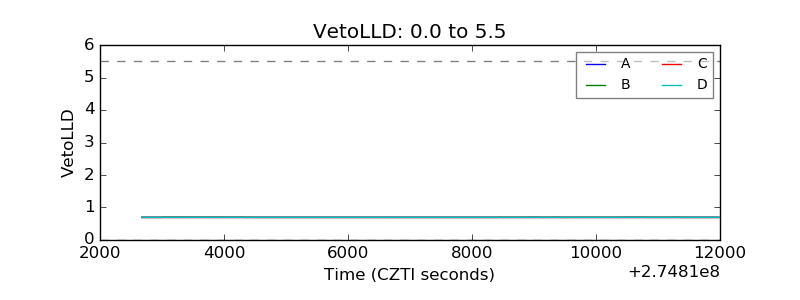 |
| Alpha Counter | 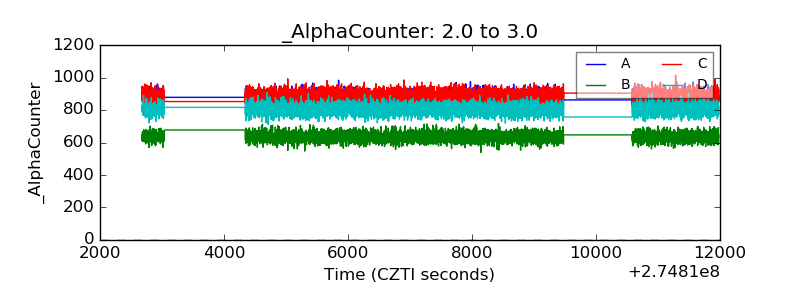 |
| _CPM_Rate | 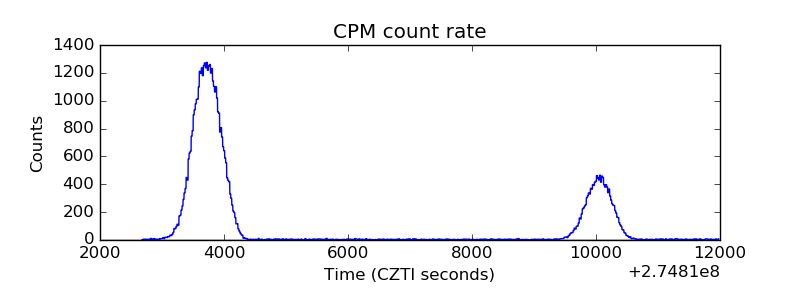 |
| CZT Counter | 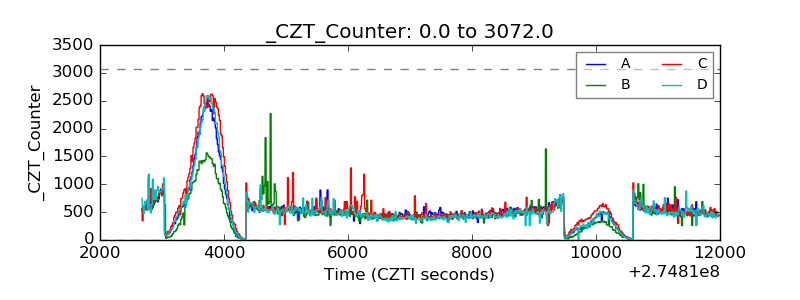 |
| +2.5 Volts monitor |  |
| +5 Volts monitor |  |
| _ROLL_ROT | 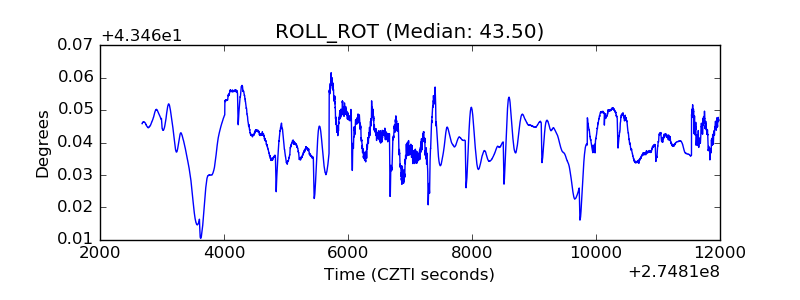 |
| _Roll_DEC | 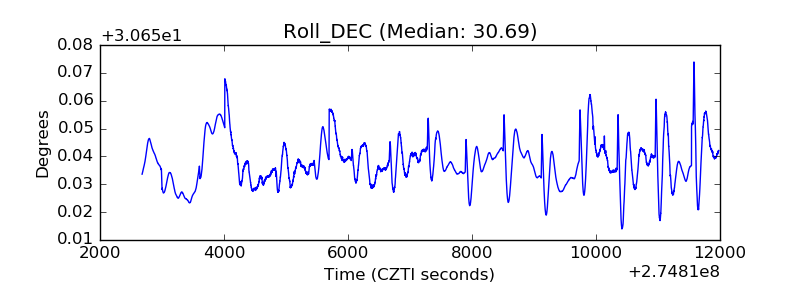 |
| _Roll_RA | 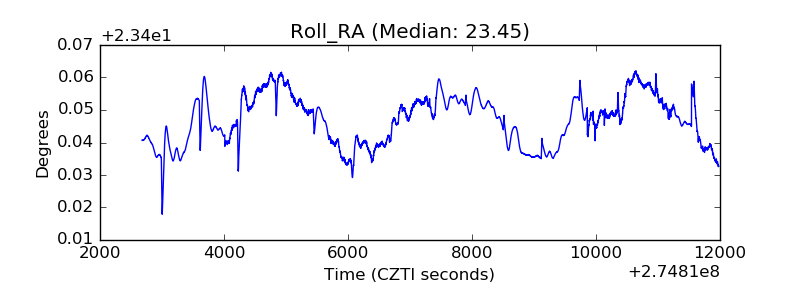 |
| Veto Counter | 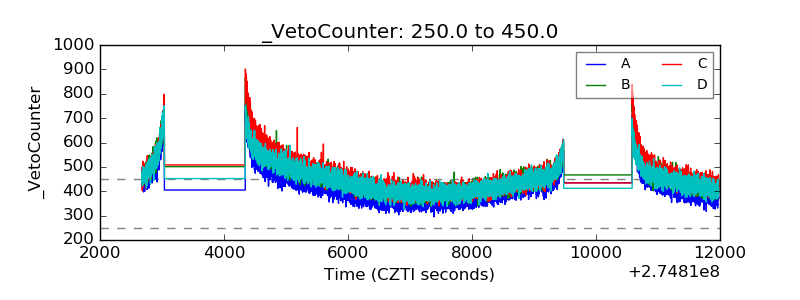 |