| Param | Original file | Final file |
|---|---|---|
| Filename | modeM0/AS1G08_012T01_9000002370_16056cztM0_level2.evt | modeM0/AS1G08_012T01_9000002370_16056cztM0_level2_quad_clean.evt |
| Size (bytes) | 610,320,960 | 105,730,560 |
| Size | 582.0 MB | 100.8 MB |
| Events in quadrant A | 4,254,276 | 656,863 |
| Events in quadrant B | 4,210,268 | 669,634 |
| Events in quadrant C | 4,390,948 | 650,143 |
| Events in quadrant D | 5,055,315 | 638,596 |
| Mode M0 | |||
|---|---|---|---|
| Quadrant | BADHDUFLAG | Total packets | Discarded packets |
| A | 0 | 18224 | 3 |
| B | 0 | 17964 | 2 |
| C | 0 | 18495 | 2 |
| D | 0 | 20932 | 2 |
| Mode M9 | |||
|---|---|---|---|
| Quadrant | BADHDUFLAG | Total packets | Discarded packets |
| A | 0 | 10 | 0 |
| B | 0 | 10 | 0 |
| C | 0 | 10 | 0 |
| D | 0 | 10 | 0 |
| Mode SS | |||
|---|---|---|---|
| Quadrant | BADHDUFLAG | Total packets | Discarded packets |
| A | 0 | 174 | 0 |
| B | 0 | 174 | 0 |
| C | 0 | 174 | 0 |
| D | 0 | 174 | 0 |
| Quadrant | Total seconds | Saturated seconds | Saturation percentage |
|---|---|---|---|
| A | 8444 | 94 | 1.113216% |
| B | 8444 | 136 | 1.610611% |
| C | 8444 | 255 | 3.019896% |
| D | 8444 | 304 | 3.600189% |
Noise dominated data is calculated using 1-second bins in cleaned event files. If a bin has >2000 counts, and if more than 50% of those come from <1% of pixels, then it is considered to be noise-dominated and hence unusable.
| Quadrant | # 1 sec bins | Bins with >0 counts | Bins with >2000 counts | High rate bins dominated by noise | Noise dominated (total time) | Noise dominated (detector-on time) | Marked lightcurve |
|---|---|---|---|---|---|---|---|
| A | 9470 | 8446 | 0 | 0 | 0.00% | 0.00% | 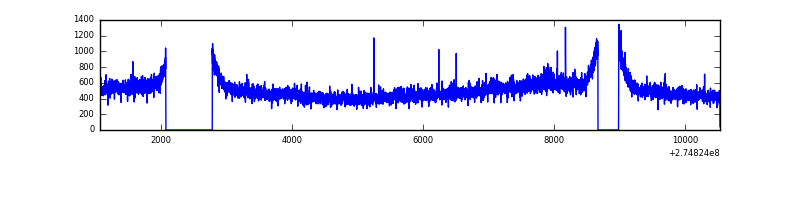 |
| B | 9470 | 8447 | 1 | 1 | 0.01% | 0.01% | 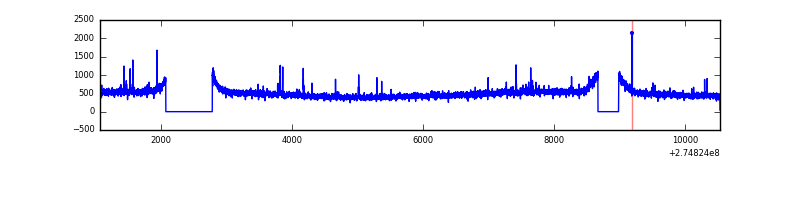 |
| C | 9470 | 8447 | 70 | 70 | 0.74% | 0.83% | 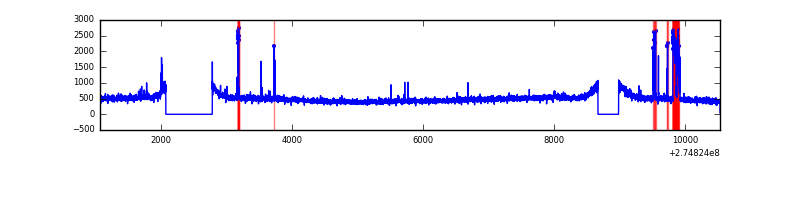 |
| D | 9470 | 8446 | 248 | 248 | 2.62% | 2.94% | 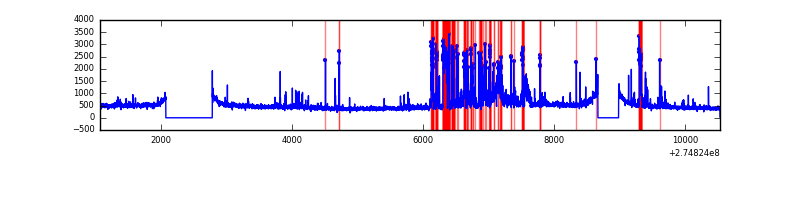 |
Top three noisy pixels from each quadrant. If the there are fewer than three noisy pixels in the level2.evt file, extra rows are filled as -1
| Pixel properties | Quadrant properties | ||||||
|---|---|---|---|---|---|---|---|
| Quadrant | DetID | PixID | Counts | Sigma | Mean | Median | Sigma |
| A | 3 | 80 | 173865 | 813.96 | 1050 | 1029 | 212.3 |
| A | 15 | 223 | 30582 | 139.18 | 1050 | 1029 | 212.3 |
| A | 15 | 239 | 11421 | 48.94 | 1050 | 1029 | 212.3 |
| B | 12 | 111 | 25020 | 118.63 | 1051 | 1021 | 202.3 |
| B | 0 | 189 | 23511 | 111.17 | 1051 | 1021 | 202.3 |
| B | 11 | 111 | 21375 | 100.61 | 1051 | 1021 | 202.3 |
| C | 3 | 233 | 169492 | 708.38 | 1015 | 1022 | 237.8 |
| C | 14 | 238 | 156185 | 652.43 | 1015 | 1022 | 237.8 |
| C | 9 | 54 | 55613 | 229.54 | 1015 | 1022 | 237.8 |
| D | 1 | 52 | 1097260 | 4426.87 | 1015 | 987 | 247.6 |
| D | 2 | 152 | 47723 | 188.72 | 1015 | 987 | 247.6 |
| D | 4 | 239 | 43430 | 171.39 | 1015 | 987 | 247.6 |
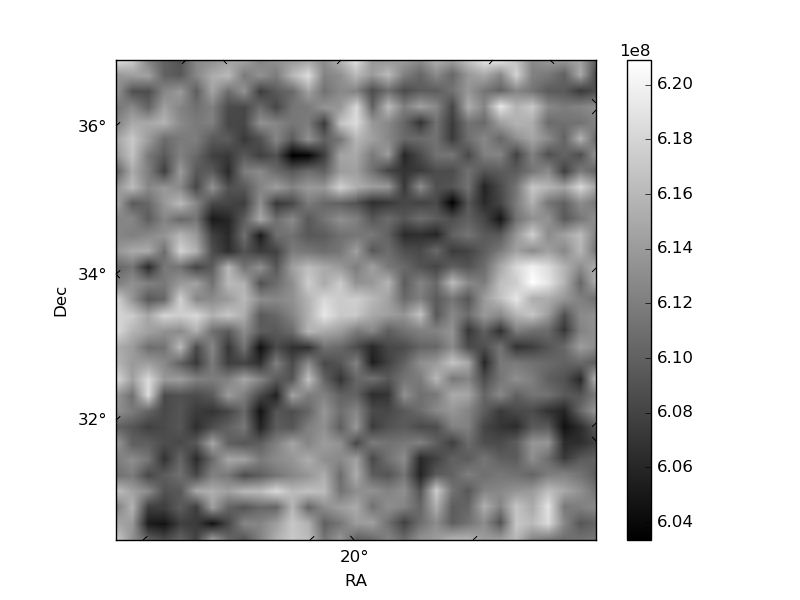
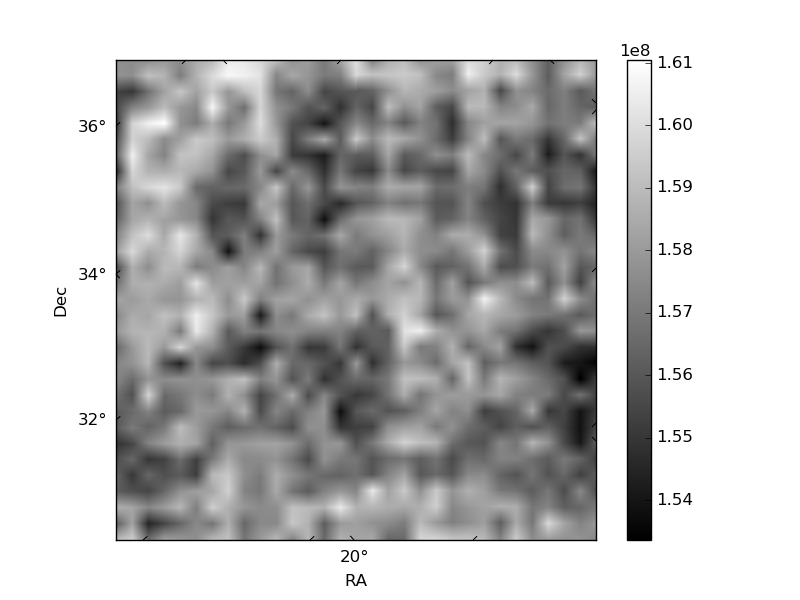
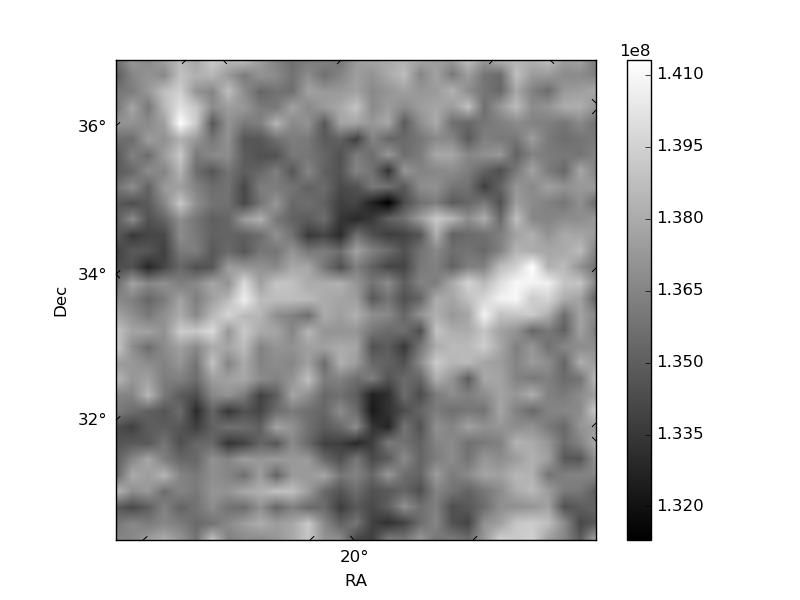
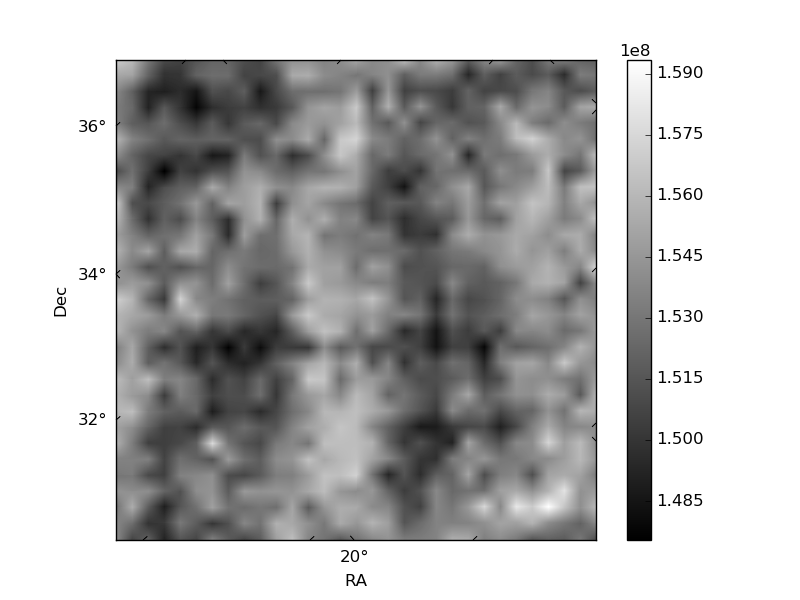
Histogram calculated using DETX and DETY for each event in the final _common_clean file
| Quadrant A | 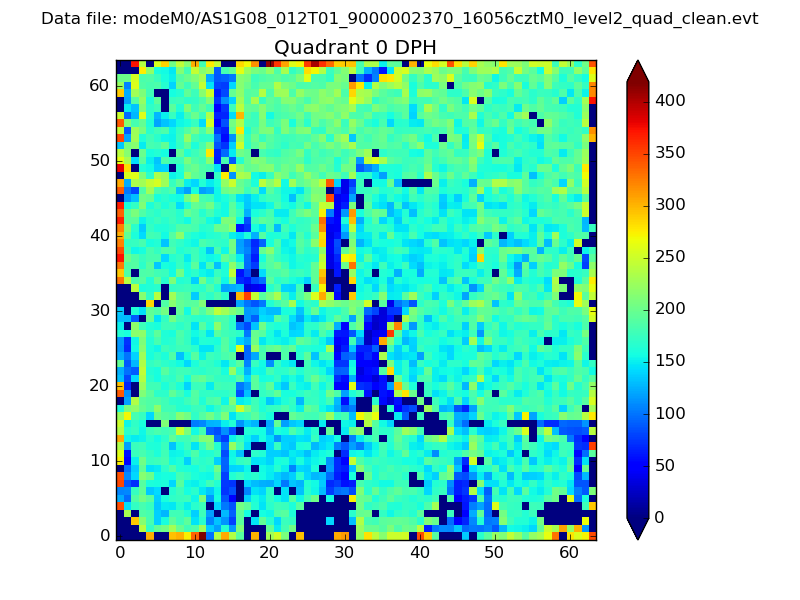 |
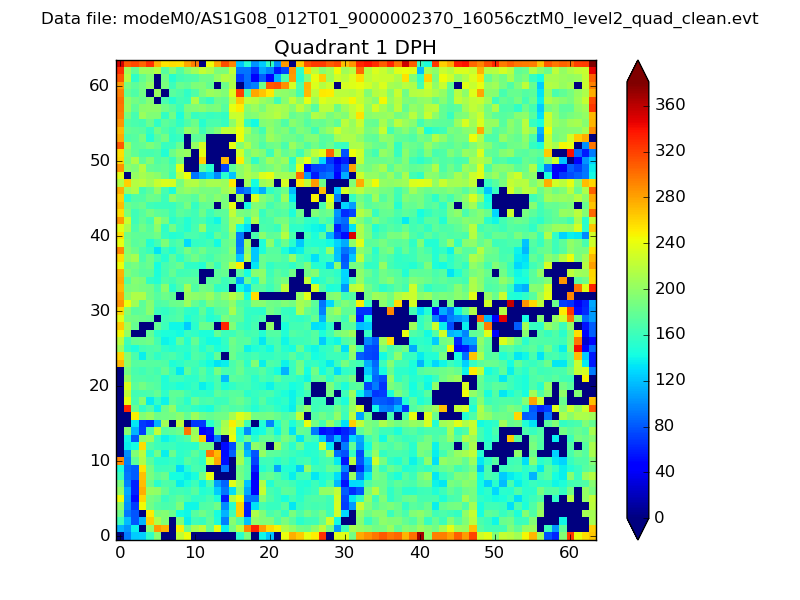 |
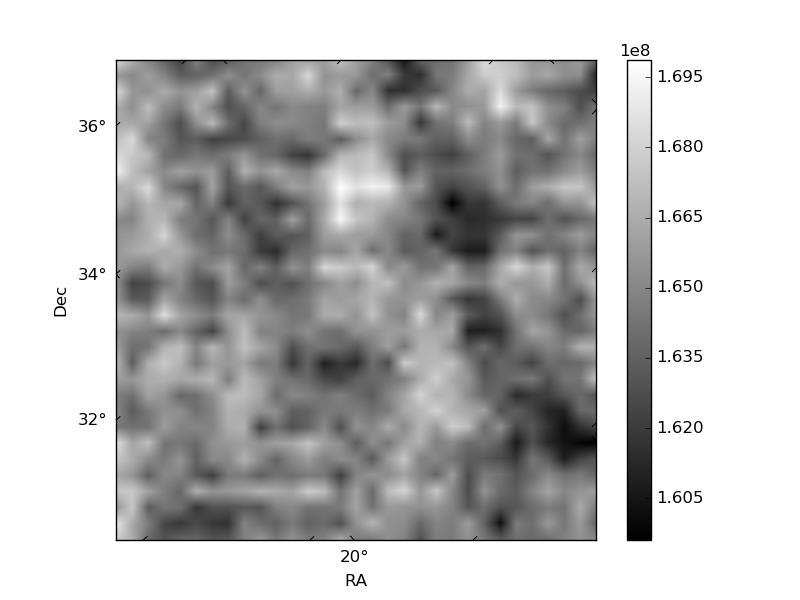
Quadrant B |
|---|---|---|---|
| Quadrant D | 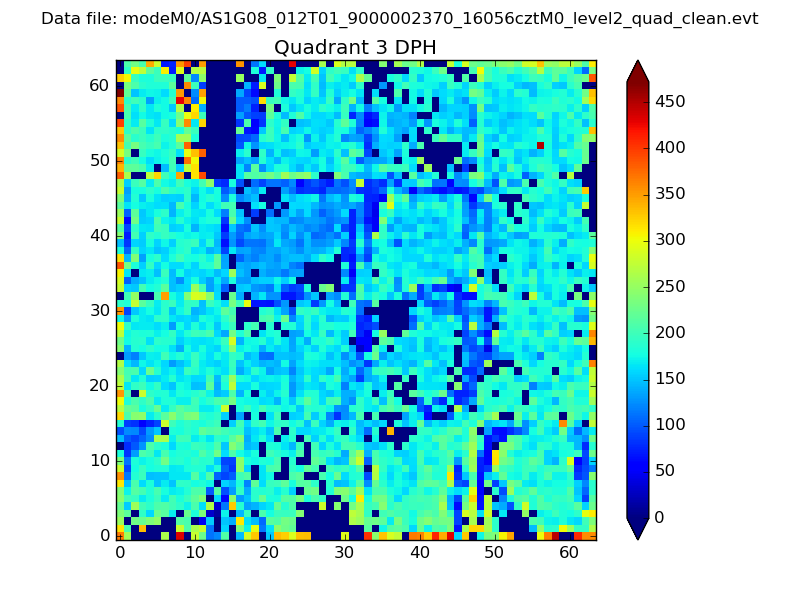 |
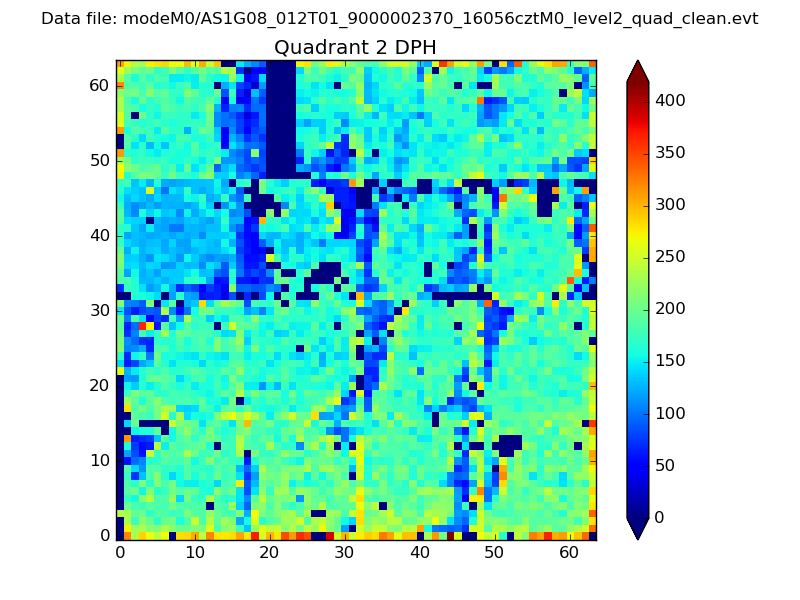 |
Quadrant C |
| Plot type | Count rate plots | Images |
|---|---|---|
| Comparison with Poisson distribution Blue bars denote a histogram of data divided into 1 sec bins. Red curve is a Poisson curve with rate = median count rate of data. |
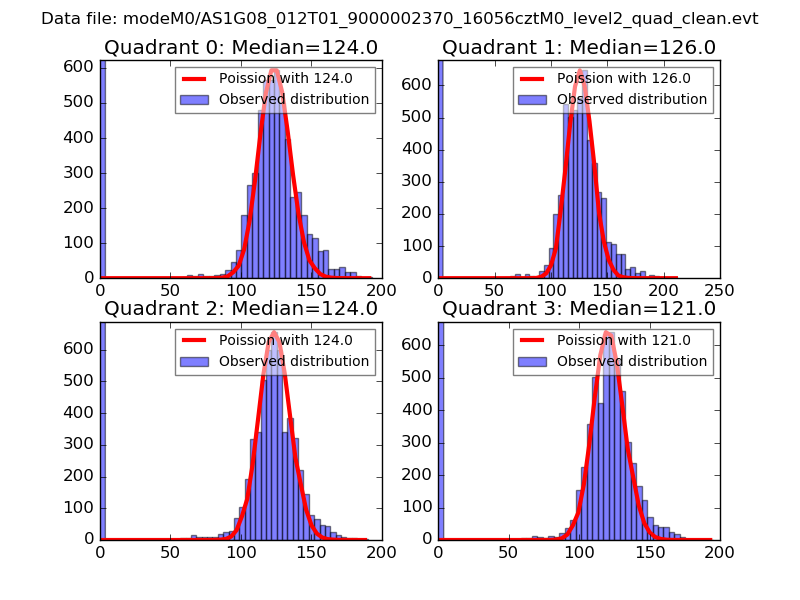 |
 |
| Quadrant-wise count rates Data is divided into 100 sec bins |
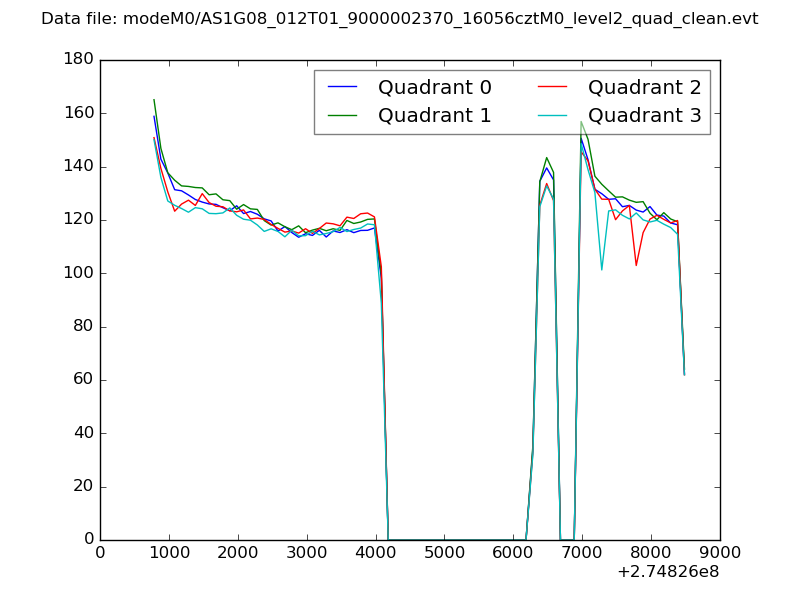 |
|
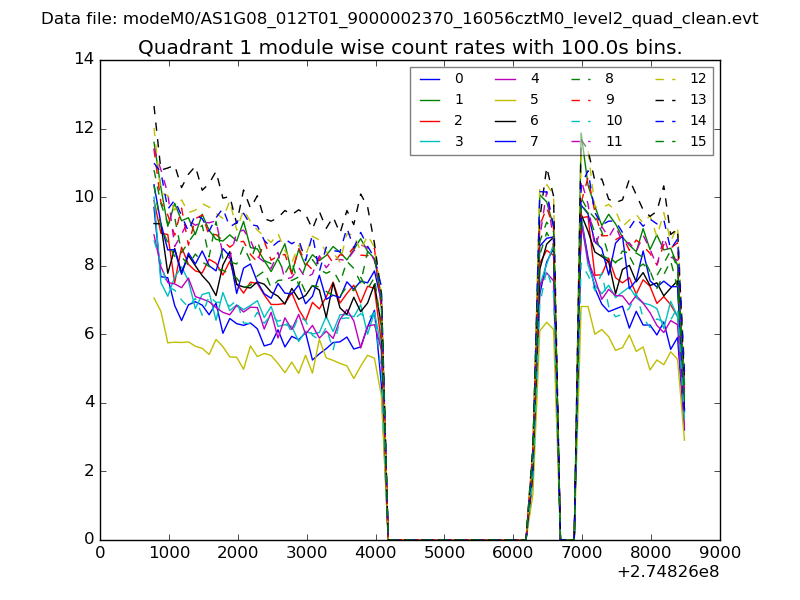
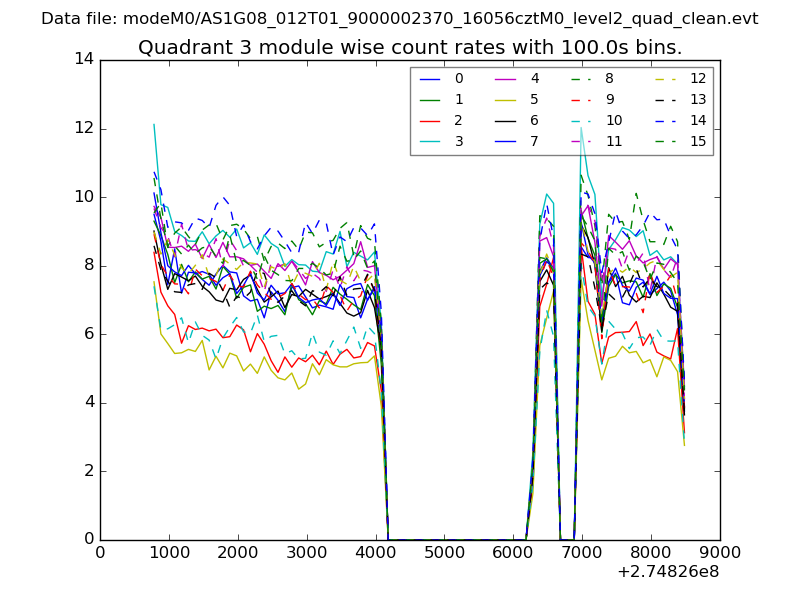
| Module-wise count rates for Quadrant A Data is divided into 100 sec bins |
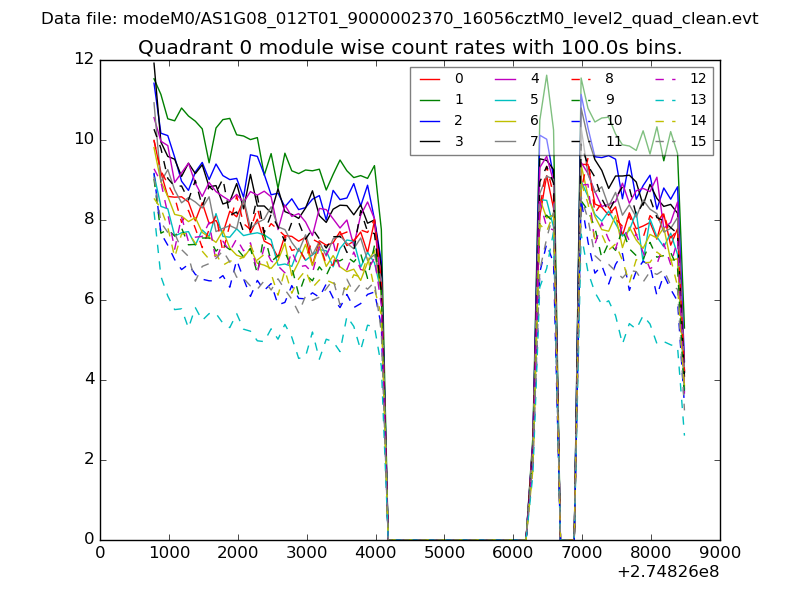 |
 |
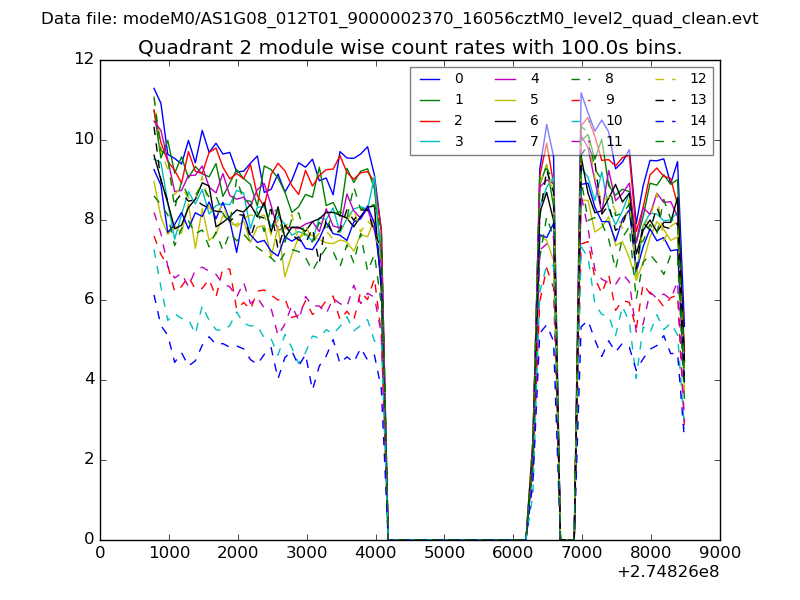
| Module-wise count rates for Quadrant B Data is divided into 100 sec bins |
 |
 |
| Module-wise count rates for Quadrant C Data is divided into 100 sec bins |
 |
 |
| Module-wise count rates for Quadrant D Data is divided into 100 sec bins |
 |
 |
| Parameter | Plot |
|---|---|
| CZT HV Monitor | 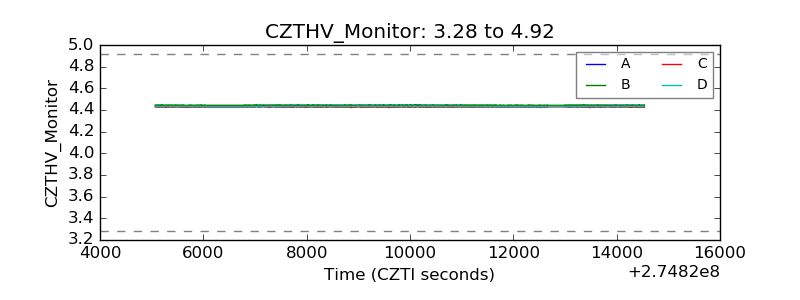 |
| D_VDD | 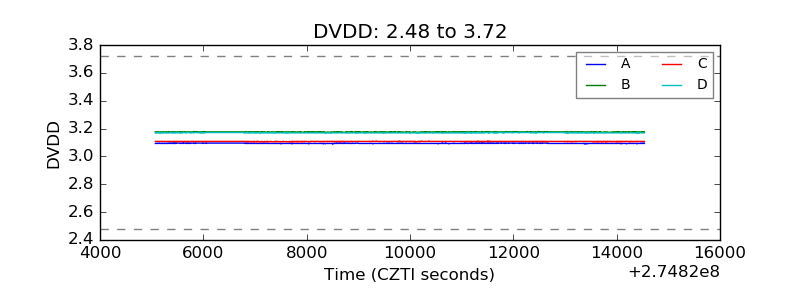 |
| Temperature 1 | 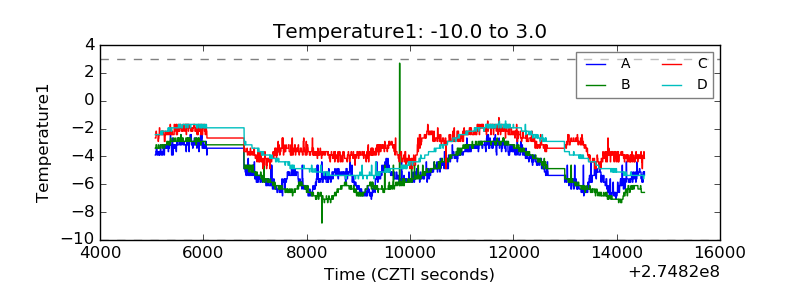 |
| Veto HV Monitor | 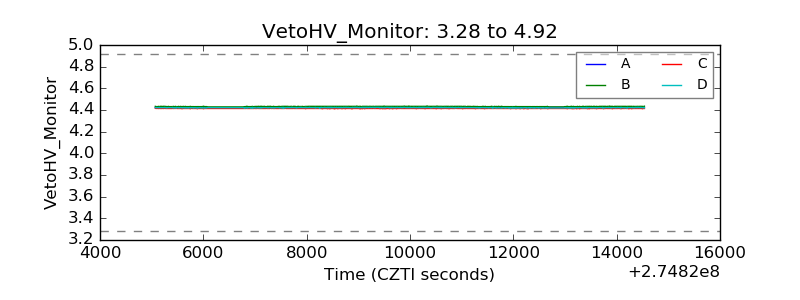 |
| Veto LLD | 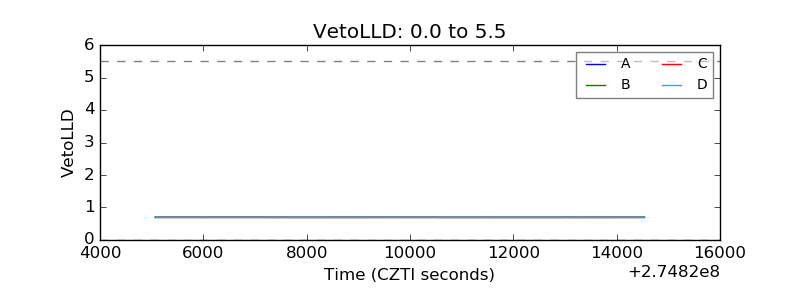 |
| Alpha Counter | 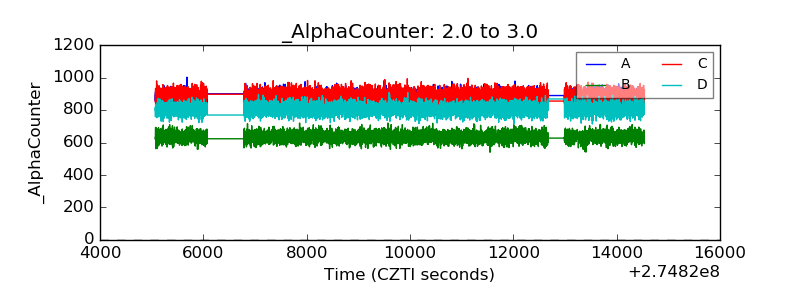 |
| _CPM_Rate | 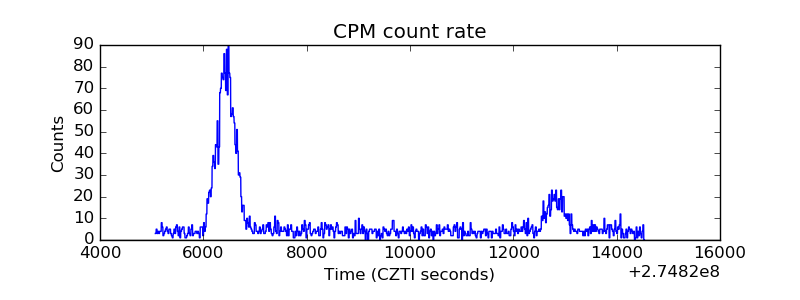 |
| CZT Counter | 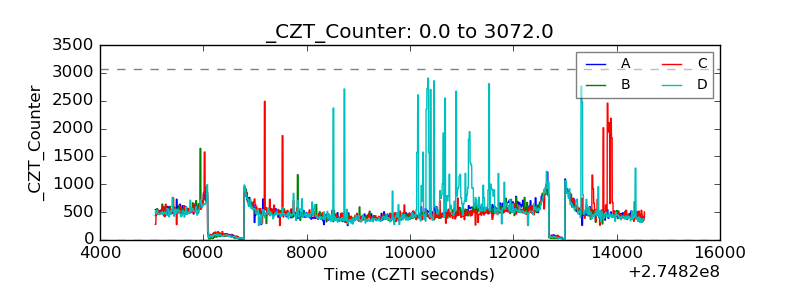 |
| +2.5 Volts monitor |  |
| +5 Volts monitor |  |
| _ROLL_ROT | 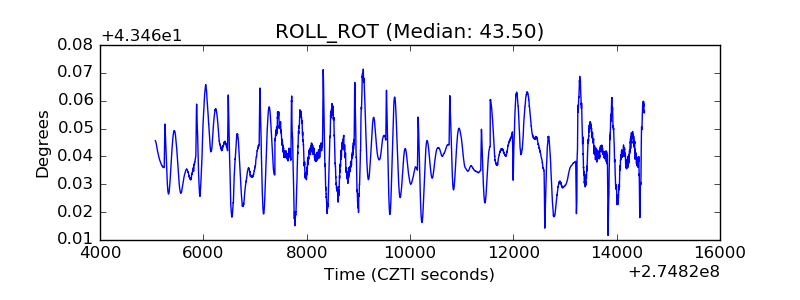 |
| _Roll_DEC | 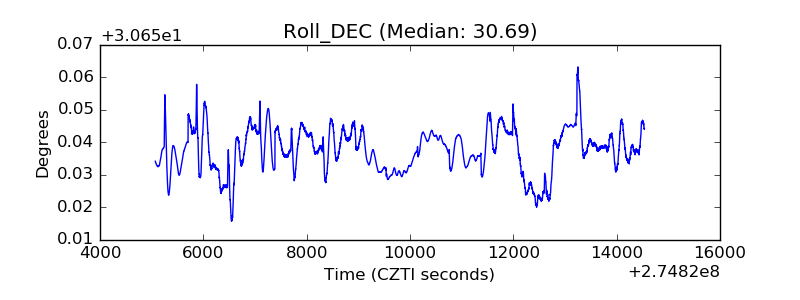 |
| _Roll_RA | 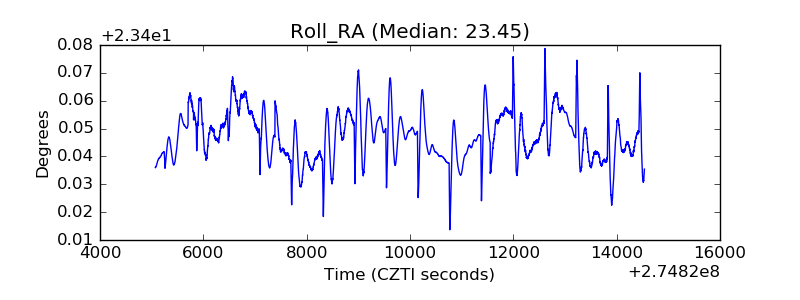 |
| Veto Counter | 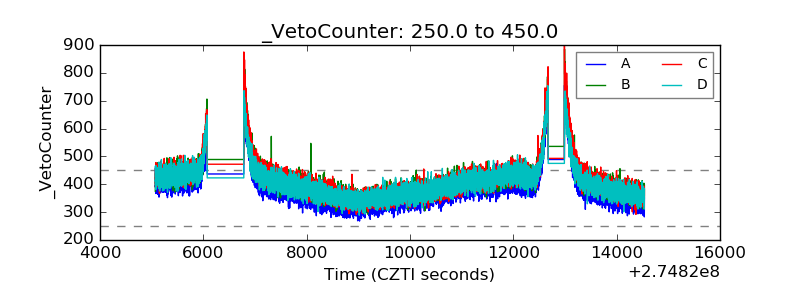 |