| Param | Original file | Final file |
|---|---|---|
| Filename | modeM0/AS1G08_012T01_9000002370_16057cztM0_level2.evt | modeM0/AS1G08_012T01_9000002370_16057cztM0_level2_quad_clean.evt |
| Size (bytes) | 540,302,400 | 111,398,400 |
| Size | 515.3 MB | 106.2 MB |
| Events in quadrant A | 3,976,197 | 709,634 |
| Events in quadrant B | 3,880,435 | 723,444 |
| Events in quadrant C | 4,136,475 | 700,483 |
| Events in quadrant D | 3,834,403 | 691,616 |
| Mode M0 | |||
|---|---|---|---|
| Quadrant | BADHDUFLAG | Total packets | Discarded packets |
| A | 0 | 17068 | 3 |
| B | 0 | 16797 | 2 |
| C | 0 | 17683 | 2 |
| D | 0 | 17160 | 2 |
| Mode M9 | |||
|---|---|---|---|
| Quadrant | BADHDUFLAG | Total packets | Discarded packets |
| A | 0 | 5 | 0 |
| B | 0 | 5 | 0 |
| C | 0 | 5 | 0 |
| D | 0 | 5 | 0 |
| Mode SS | |||
|---|---|---|---|
| Quadrant | BADHDUFLAG | Total packets | Discarded packets |
| A | 0 | 162 | 0 |
| B | 0 | 162 | 0 |
| C | 0 | 162 | 0 |
| D | 0 | 162 | 0 |
| Quadrant | Total seconds | Saturated seconds | Saturation percentage |
|---|---|---|---|
| A | 7886 | 132 | 1.673852% |
| B | 7886 | 172 | 2.181080% |
| C | 7886 | 276 | 3.499873% |
| D | 7886 | 95 | 1.204666% |
Noise dominated data is calculated using 1-second bins in cleaned event files. If a bin has >2000 counts, and if more than 50% of those come from <1% of pixels, then it is considered to be noise-dominated and hence unusable.
| Quadrant | # 1 sec bins | Bins with >0 counts | Bins with >2000 counts | High rate bins dominated by noise | Noise dominated (total time) | Noise dominated (detector-on time) | Marked lightcurve |
|---|---|---|---|---|---|---|---|
| A | 8452 | 7887 | 0 | 0 | 0.00% | 0.00% | 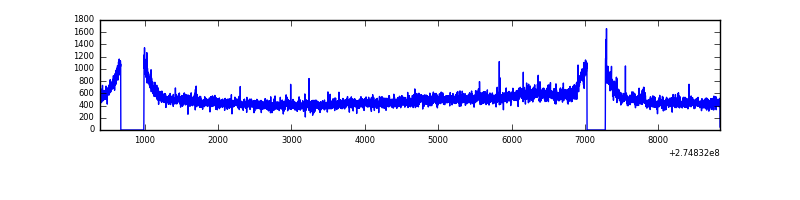 |
| B | 8452 | 7888 | 2 | 2 | 0.02% | 0.03% | 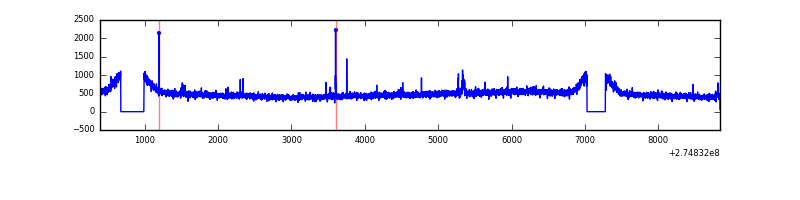 |
| C | 8452 | 7888 | 60 | 60 | 0.71% | 0.76% | 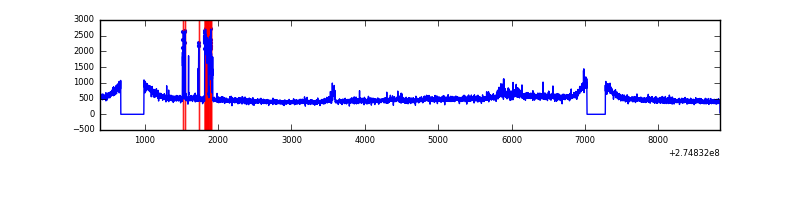 |
| D | 8452 | 7888 | 36 | 36 | 0.43% | 0.46% | 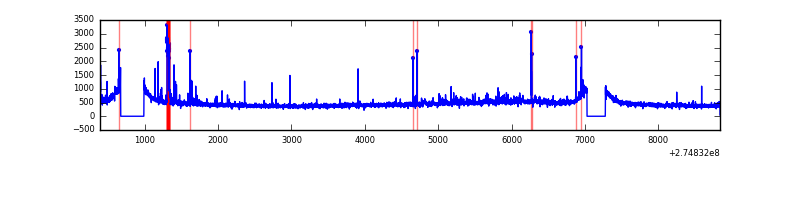 |
Top three noisy pixels from each quadrant. If the there are fewer than three noisy pixels in the level2.evt file, extra rows are filled as -1
| Pixel properties | Quadrant properties | ||||||
|---|---|---|---|---|---|---|---|
| Quadrant | DetID | PixID | Counts | Sigma | Mean | Median | Sigma |
| A | 3 | 80 | 218619 | 1095.5 | 970 | 949 | 198.7 |
| A | 15 | 223 | 15913 | 75.31 | 970 | 949 | 198.7 |
| A | 9 | 143 | 8509 | 38.05 | 970 | 949 | 198.7 |
| B | 12 | 111 | 23141 | 116.74 | 973 | 948 | 190.1 |
| B | 11 | 111 | 20252 | 101.54 | 973 | 948 | 190.1 |
| B | 14 | 111 | 16846 | 83.63 | 973 | 948 | 190.1 |
| C | 3 | 233 | 257132 | 1158.6 | 939 | 943 | 221.1 |
| C | 14 | 238 | 143026 | 642.56 | 939 | 943 | 221.1 |
| C | 9 | 54 | 48766 | 216.28 | 939 | 943 | 221.1 |
| D | 1 | 52 | 108808 | 462.93 | 949 | 921 | 233.1 |
| D | 2 | 152 | 67414 | 285.31 | 949 | 921 | 233.1 |
| D | 4 | 239 | 27673 | 114.79 | 949 | 921 | 233.1 |
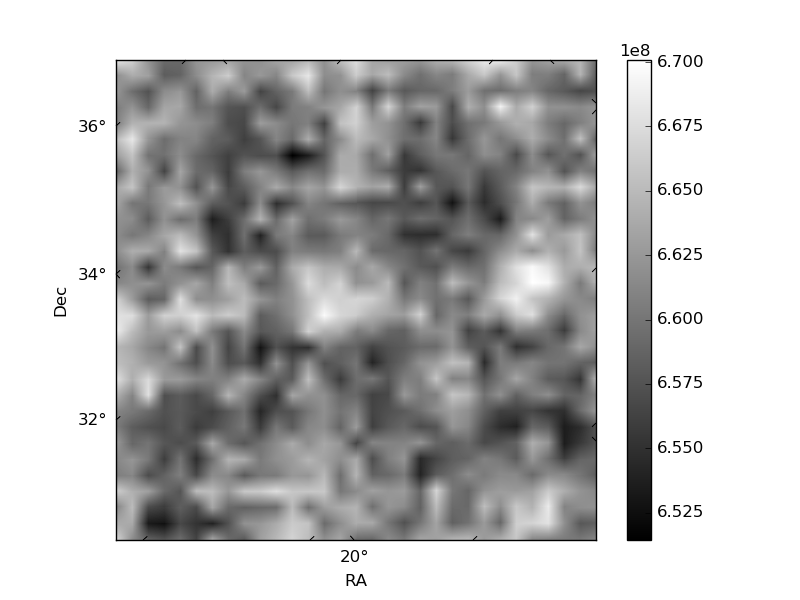
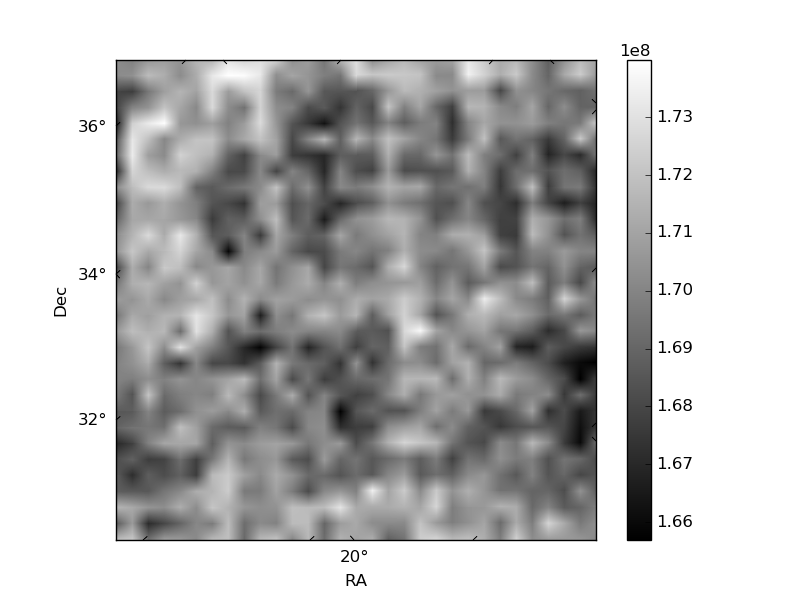
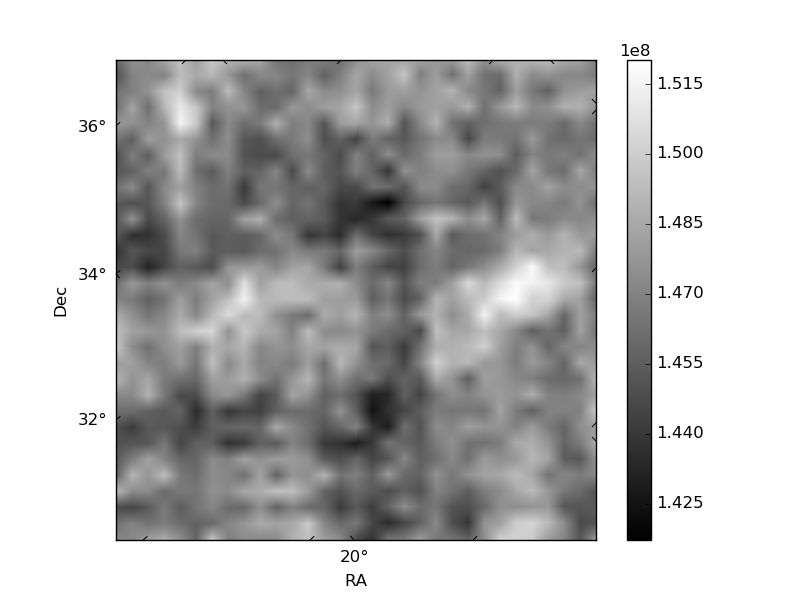
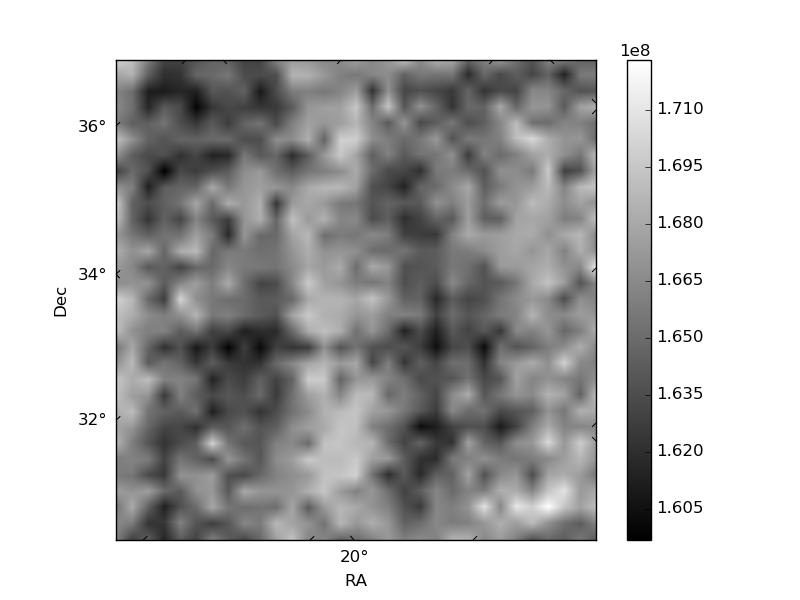
Histogram calculated using DETX and DETY for each event in the final _common_clean file
| Quadrant A | 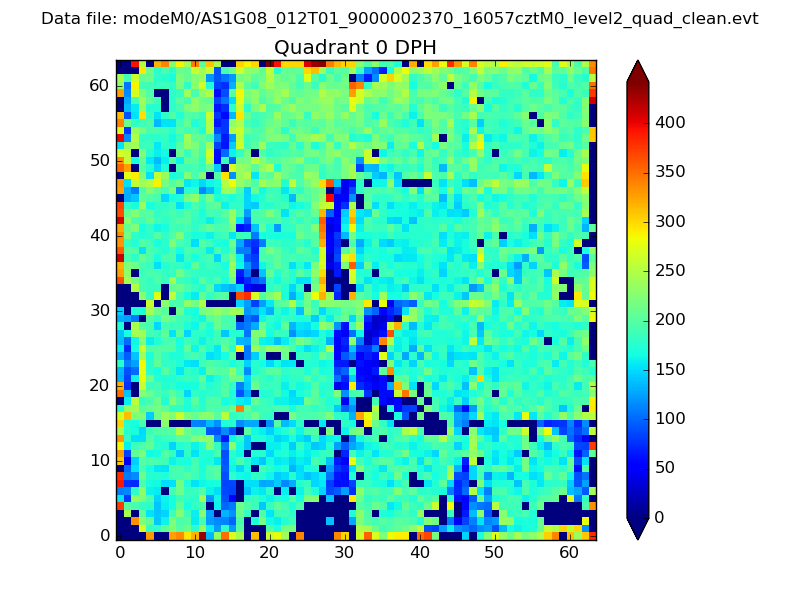 |
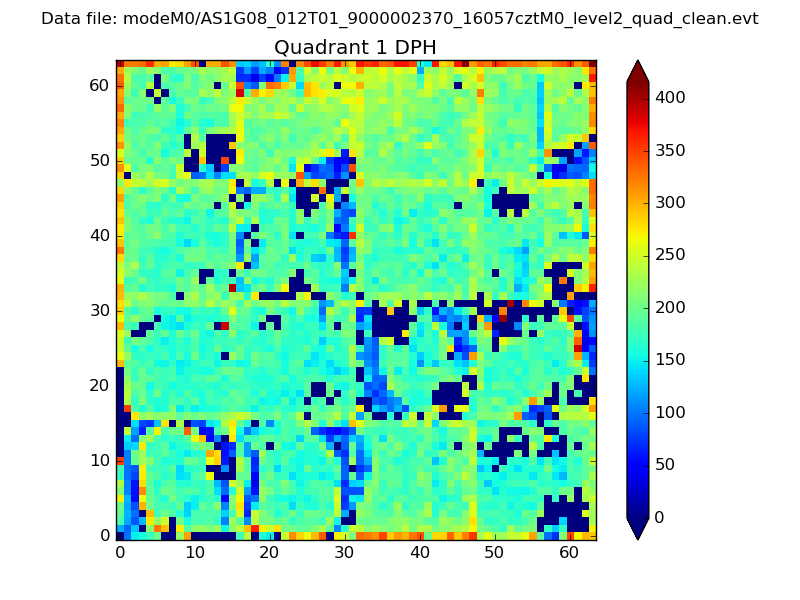 |
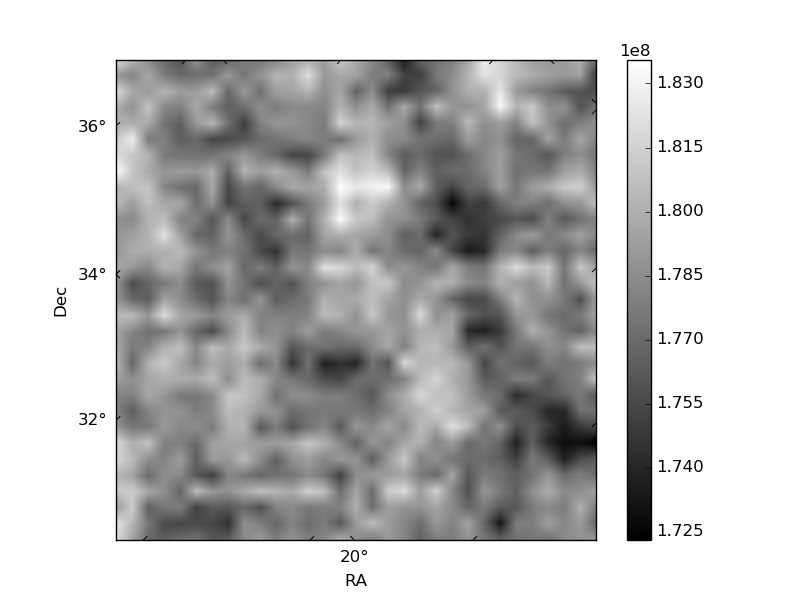
Quadrant B |
|---|---|---|---|
| Quadrant D | 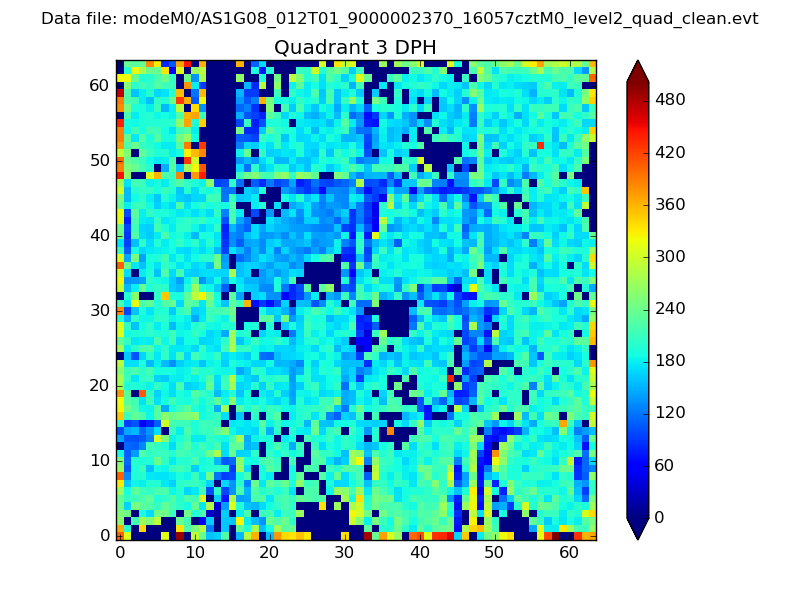 |
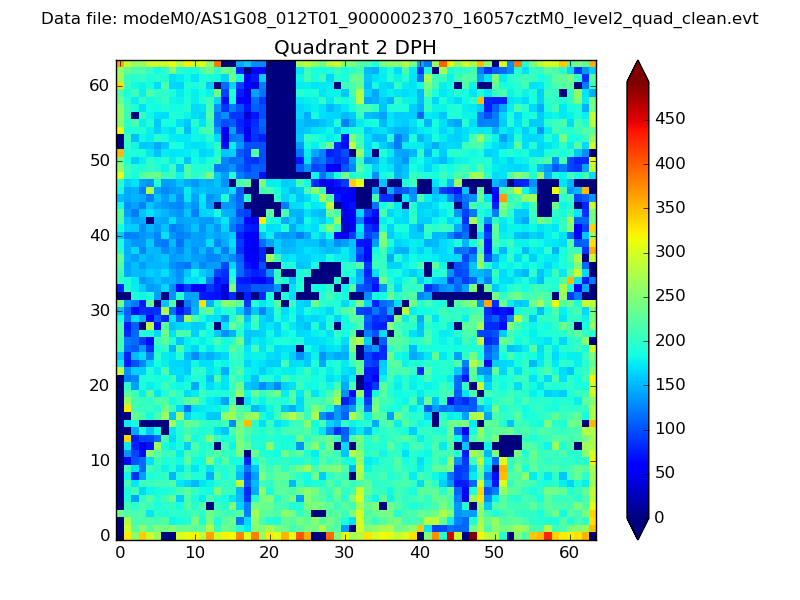 |
Quadrant C |
| Plot type | Count rate plots | Images |
|---|---|---|
| Comparison with Poisson distribution Blue bars denote a histogram of data divided into 1 sec bins. Red curve is a Poisson curve with rate = median count rate of data. |
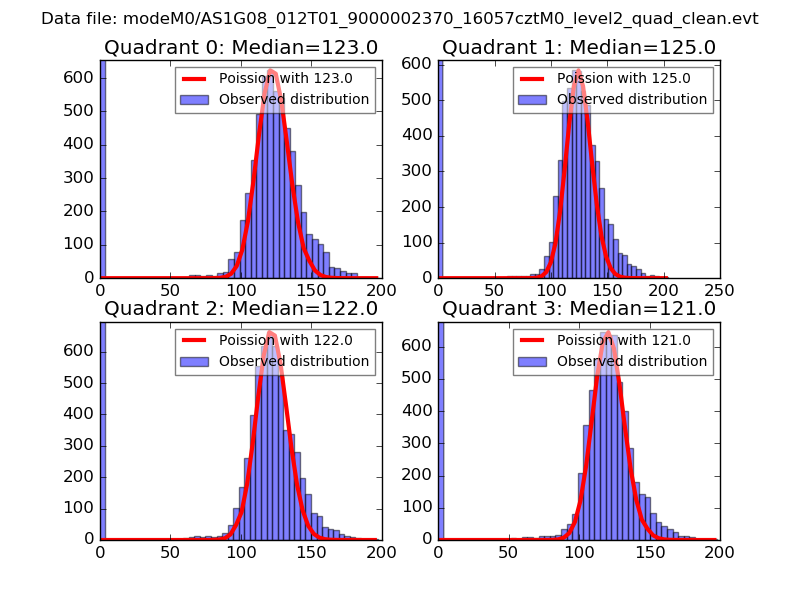 |
 |
| Quadrant-wise count rates Data is divided into 100 sec bins |
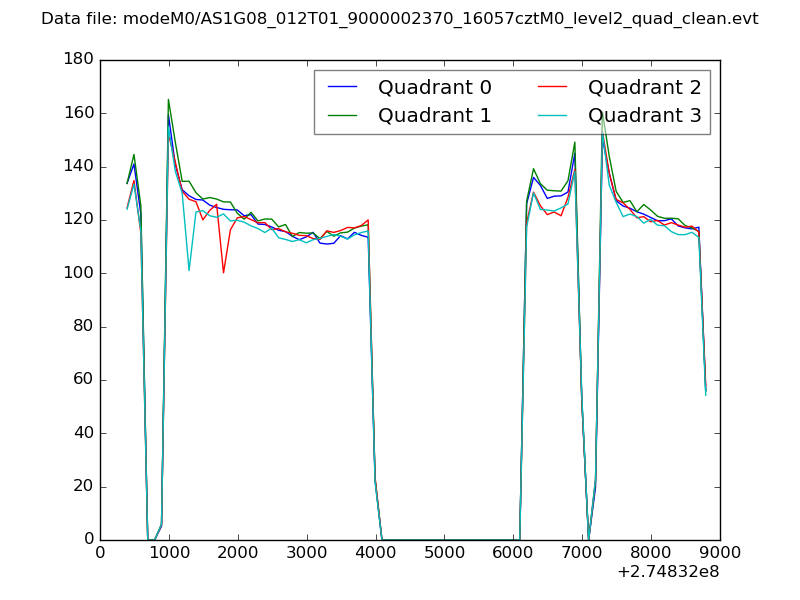 |
|
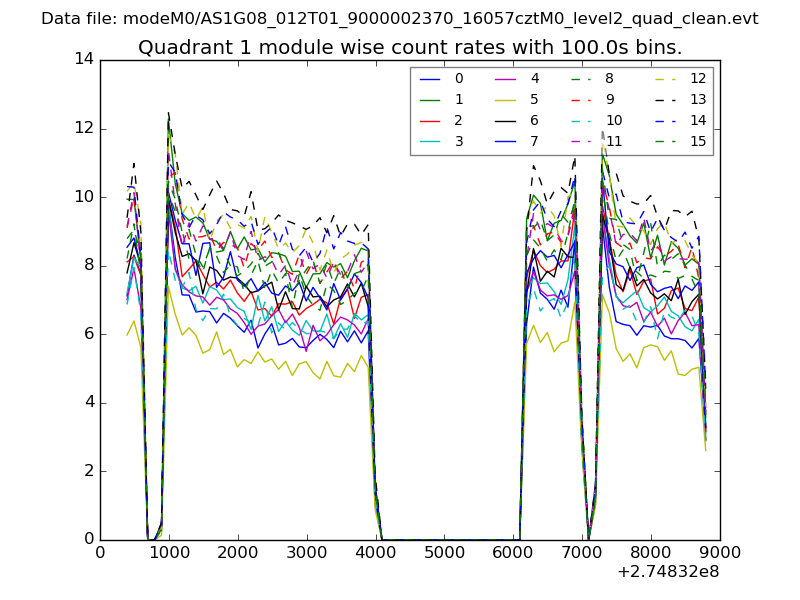
| Module-wise count rates for Quadrant A Data is divided into 100 sec bins |
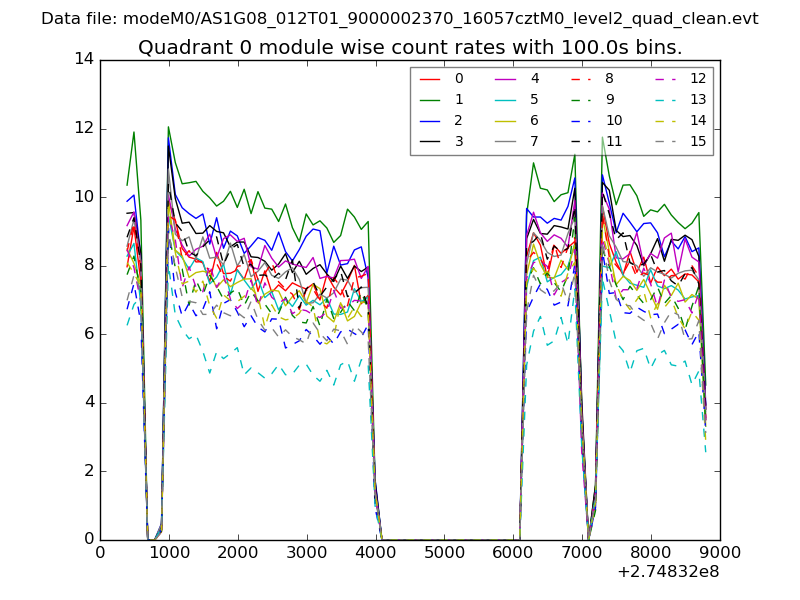 |
 |
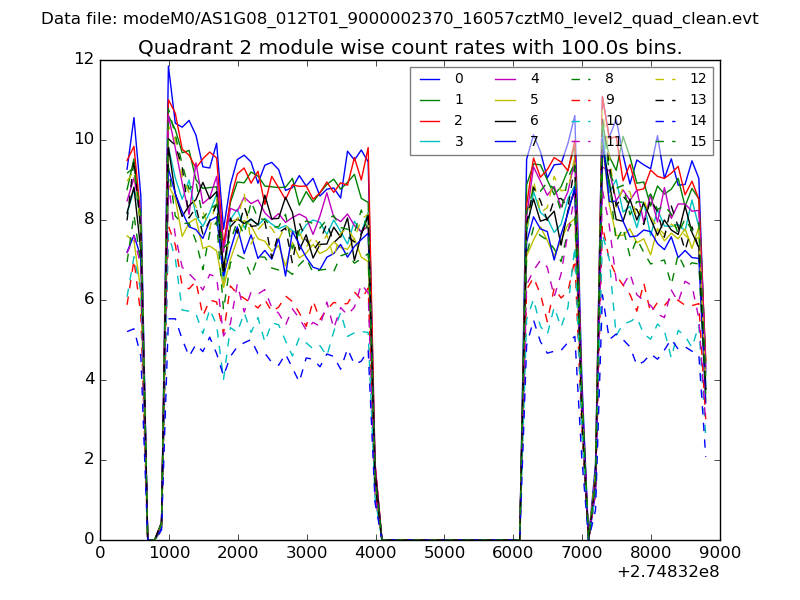
| Module-wise count rates for Quadrant B Data is divided into 100 sec bins |
 |
 |
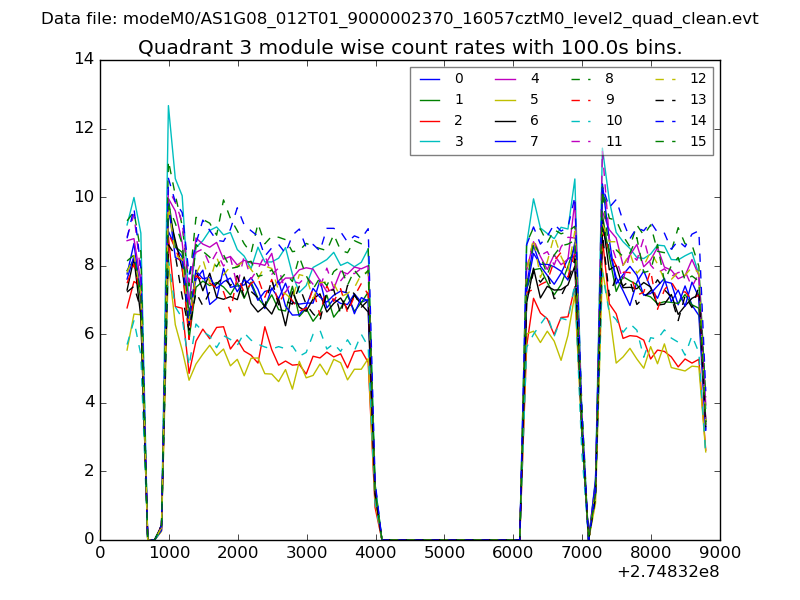
| Module-wise count rates for Quadrant C Data is divided into 100 sec bins |
 |
 |
| Module-wise count rates for Quadrant D Data is divided into 100 sec bins |
 |
 |
| Parameter | Plot |
|---|---|
| CZT HV Monitor | 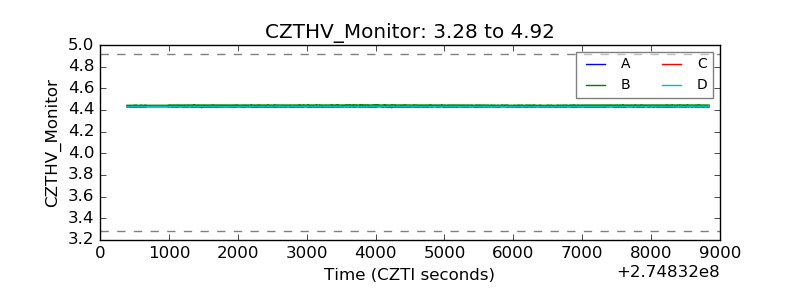 |
| D_VDD | 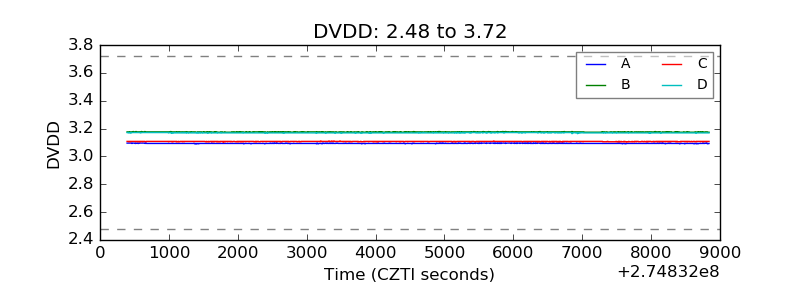 |
| Temperature 1 | 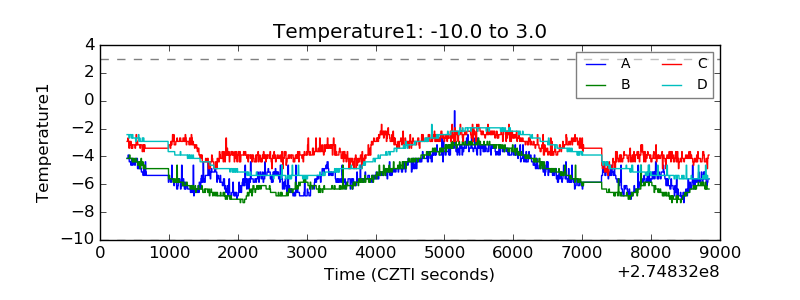 |
| Veto HV Monitor | 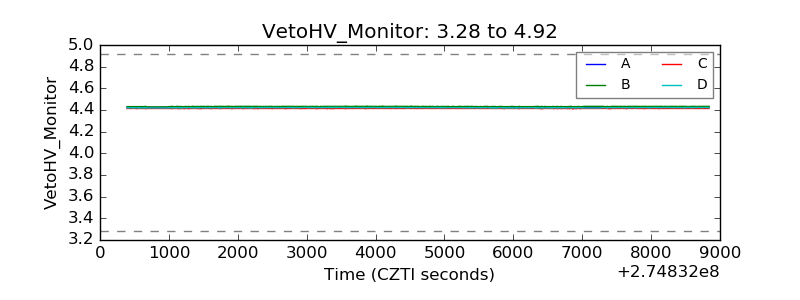 |
| Veto LLD | 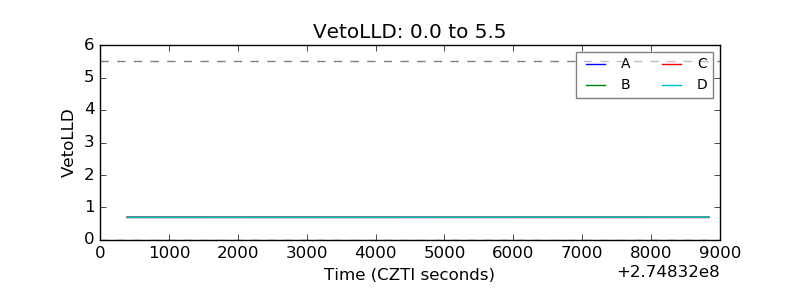 |
| Alpha Counter | 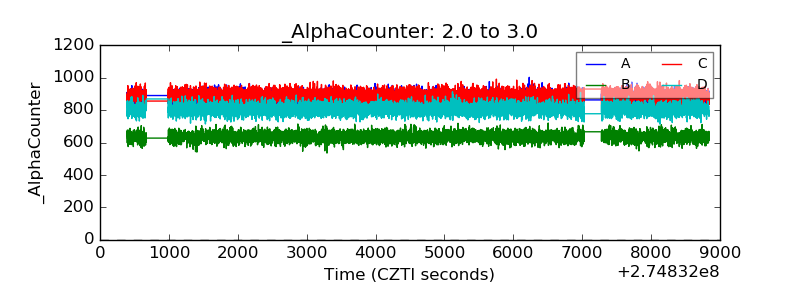 |
| _CPM_Rate | 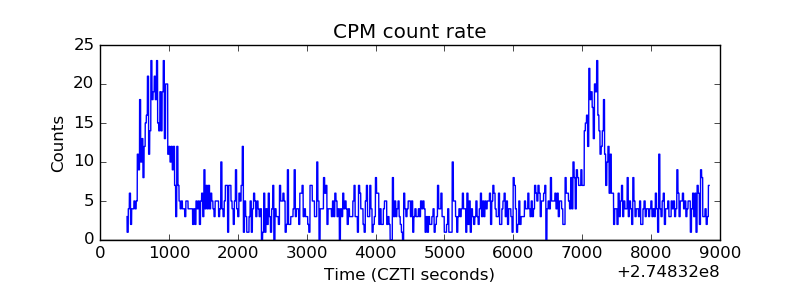 |
| CZT Counter | 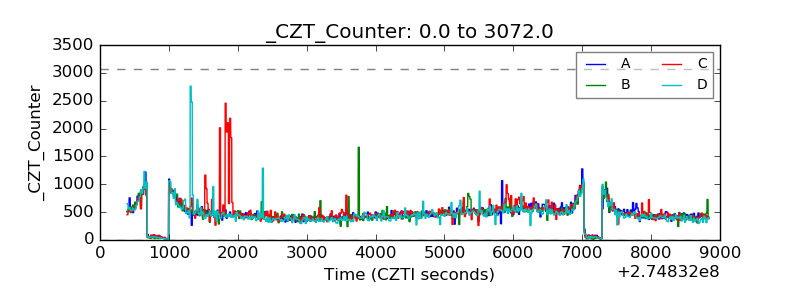 |
| +2.5 Volts monitor |  |
| +5 Volts monitor | 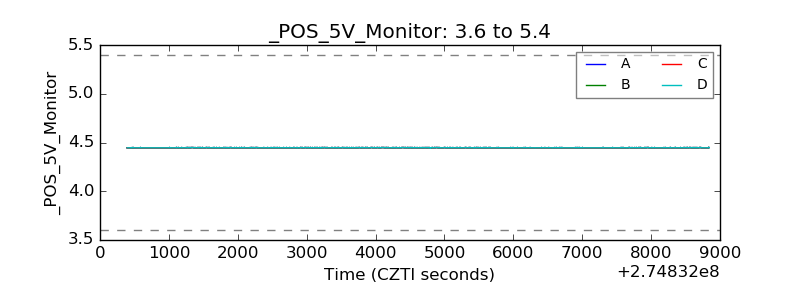 |
| _ROLL_ROT | 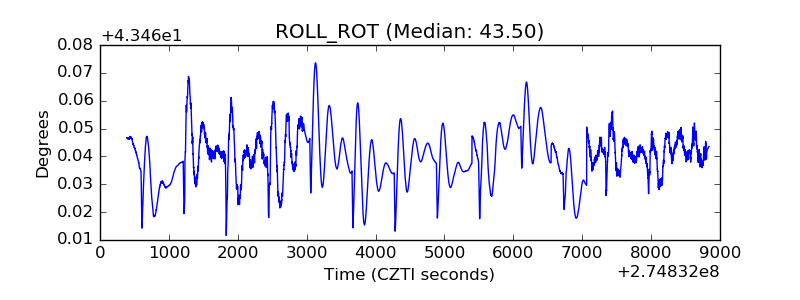 |
| _Roll_DEC | 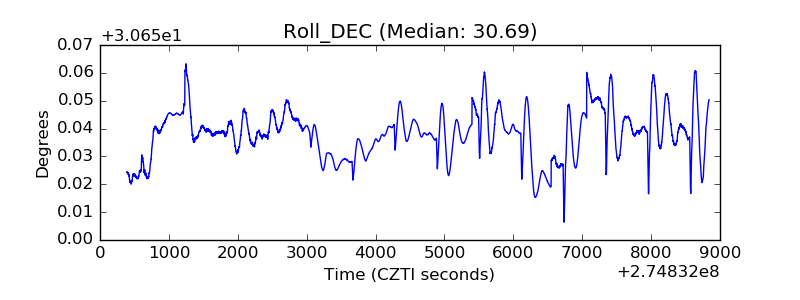 |
| _Roll_RA | 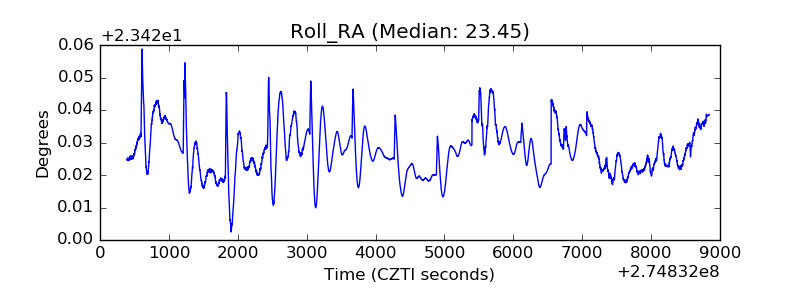 |
| Veto Counter | 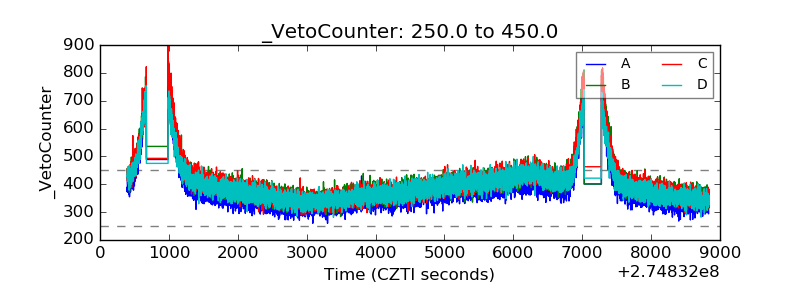 |