| Param | Original file | Final file |
|---|---|---|
| Filename | modeM0/AS1G08_012T01_9000002370_16060cztM0_level2.evt | modeM0/AS1G08_012T01_9000002370_16060cztM0_level2_quad_clean.evt |
| Size (bytes) | 778,608,000 | 147,528,000 |
| Size | 742.5 MB | 140.7 MB |
| Events in quadrant A | 6,081,000 | 913,449 |
| Events in quadrant B | 5,690,043 | 932,680 |
| Events in quadrant C | 5,618,621 | 907,149 |
| Events in quadrant D | 5,388,385 | 896,000 |
| Mode M0 | |||
|---|---|---|---|
| Quadrant | BADHDUFLAG | Total packets | Discarded packets |
| A | 0 | 25519 | 2 |
| B | 0 | 24720 | 2 |
| C | 0 | 24581 | 2 |
| D | 0 | 24496 | 2 |
| Mode M9 | |||
|---|---|---|---|
| Quadrant | BADHDUFLAG | Total packets | Discarded packets |
| A | 0 | 6 | 0 |
| B | 0 | 6 | 0 |
| C | 0 | 6 | 0 |
| D | 0 | 6 | 0 |
| Mode SS | |||
|---|---|---|---|
| Quadrant | BADHDUFLAG | Total packets | Discarded packets |
| A | 0 | 242 | 0 |
| B | 0 | 242 | 0 |
| C | 0 | 242 | 0 |
| D | 0 | 242 | 0 |
| Quadrant | Total seconds | Saturated seconds | Saturation percentage |
|---|---|---|---|
| A | 11831 | 121 | 1.022737% |
| B | 11831 | 154 | 1.301665% |
| C | 11831 | 179 | 1.512974% |
| D | 11831 | 44 | 0.371904% |
Noise dominated data is calculated using 1-second bins in cleaned event files. If a bin has >2000 counts, and if more than 50% of those come from <1% of pixels, then it is considered to be noise-dominated and hence unusable.
| Quadrant | # 1 sec bins | Bins with >0 counts | Bins with >2000 counts | High rate bins dominated by noise | Noise dominated (total time) | Noise dominated (detector-on time) | Marked lightcurve |
|---|---|---|---|---|---|---|---|
| A | 12522 | 11832 | 0 | 0 | 0.00% | 0.00% | 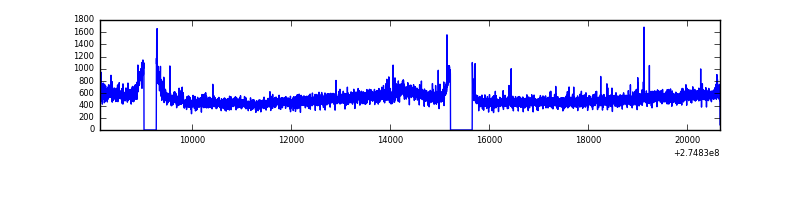 |
| B | 12522 | 11832 | 1 | 1 | 0.01% | 0.01% | 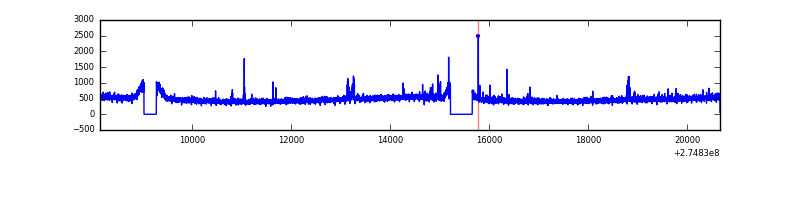 |
| C | 12522 | 11833 | 0 | 0 | 0.00% | 0.00% | 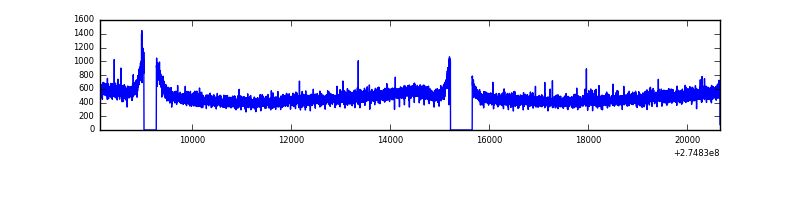 |
| D | 12522 | 11834 | 5 | 5 | 0.04% | 0.04% | 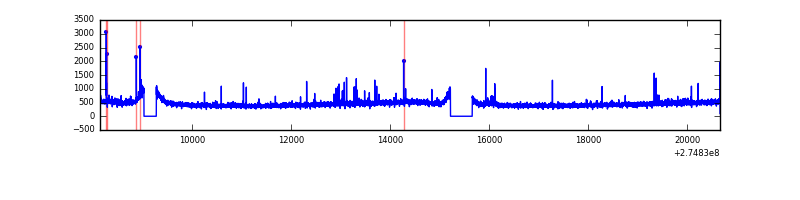 |
Top three noisy pixels from each quadrant. If the there are fewer than three noisy pixels in the level2.evt file, extra rows are filled as -1
| Pixel properties | Quadrant properties | ||||||
|---|---|---|---|---|---|---|---|
| Quadrant | DetID | PixID | Counts | Sigma | Mean | Median | Sigma |
| A | 3 | 80 | 583572 | 2022.99 | 1422 | 1390 | 287.8 |
| A | 9 | 143 | 18227 | 58.51 | 1422 | 1390 | 287.8 |
| A | 0 | 226 | 12451 | 38.44 | 1422 | 1390 | 287.8 |
| B | 0 | 230 | 59999 | 213.56 | 1422 | 1385 | 274.5 |
| B | 12 | 111 | 33686 | 117.69 | 1422 | 1385 | 274.5 |
| B | 11 | 111 | 28828 | 99.99 | 1422 | 1385 | 274.5 |
| C | 14 | 238 | 211138 | 648.1 | 1375 | 1383 | 323.6 |
| C | 3 | 233 | 38535 | 114.79 | 1375 | 1383 | 323.6 |
| C | 13 | 61 | 9805 | 26.02 | 1375 | 1383 | 323.6 |
| D | 1 | 52 | 53066 | 152.42 | 1392 | 1353 | 339.3 |
| D | 2 | 234 | 41688 | 118.89 | 1392 | 1353 | 339.3 |
| D | 2 | 152 | 36252 | 102.87 | 1392 | 1353 | 339.3 |
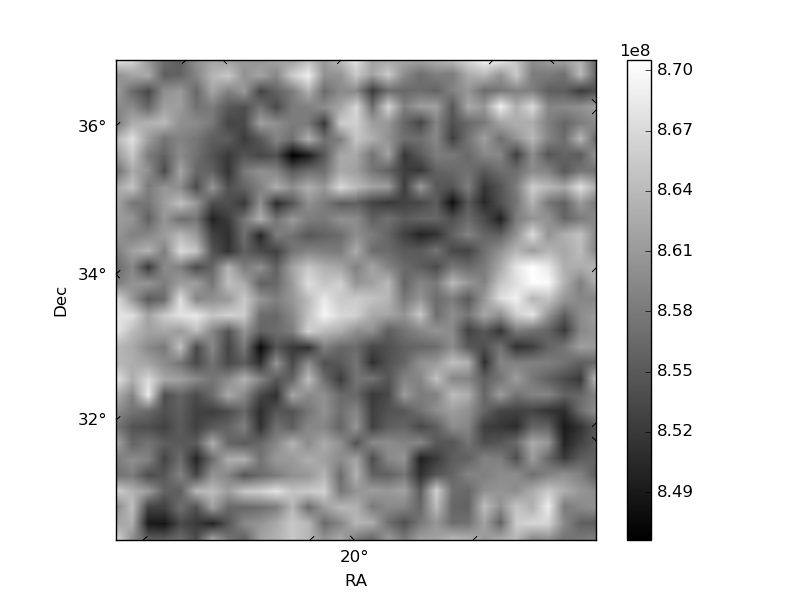
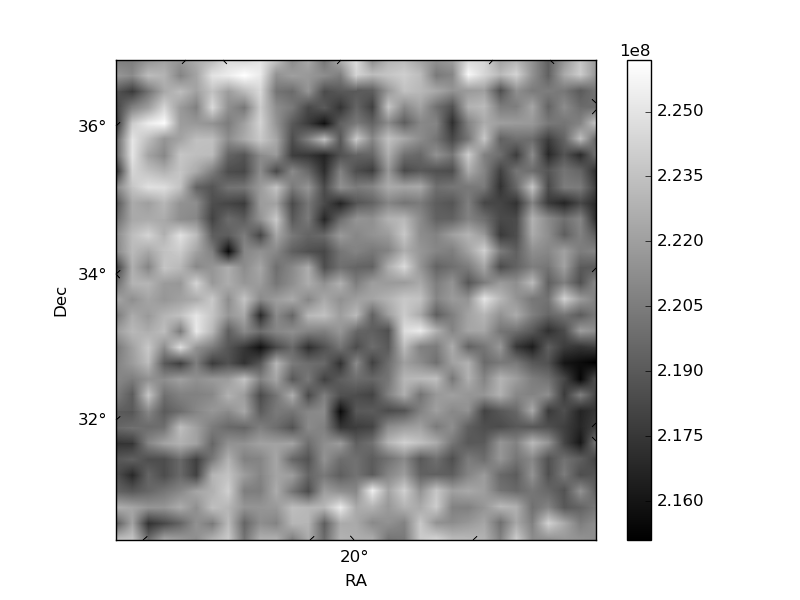
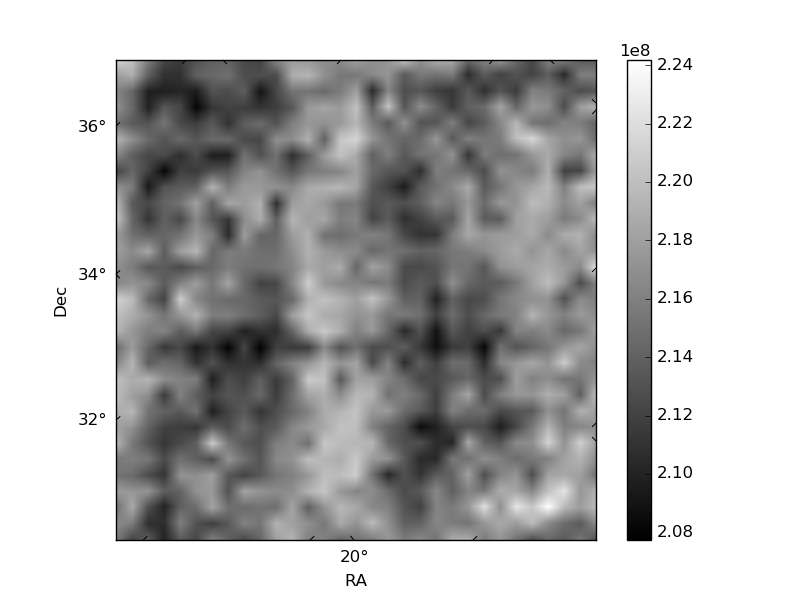
Histogram calculated using DETX and DETY for each event in the final _common_clean file
| Quadrant A | 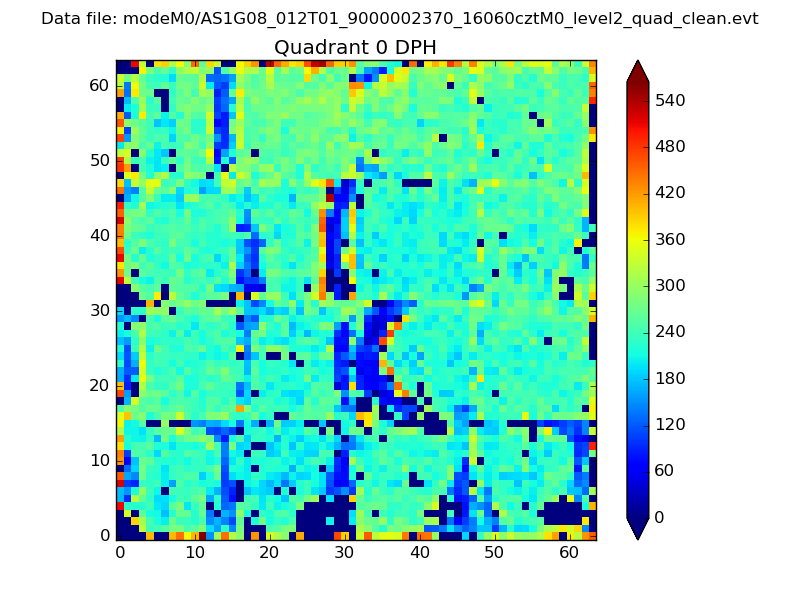 |
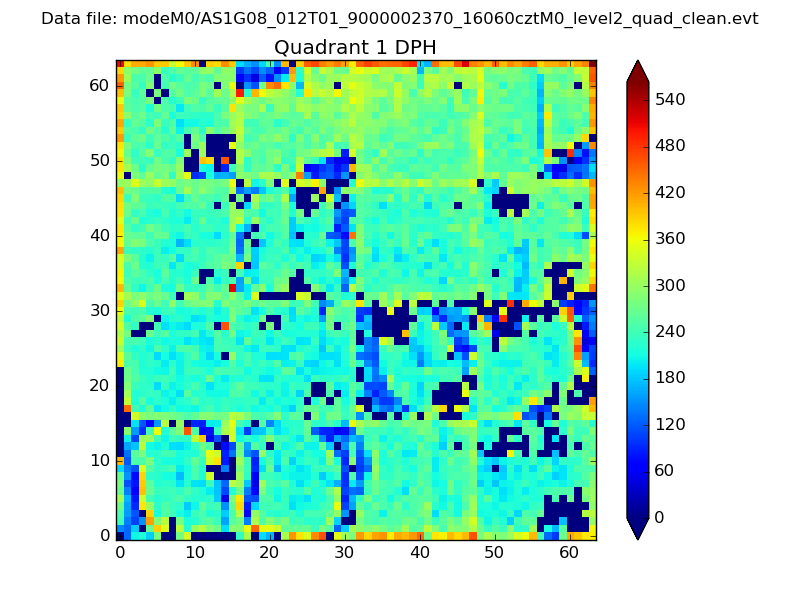 |
Quadrant B |
|---|---|---|---|
| Quadrant D |  |
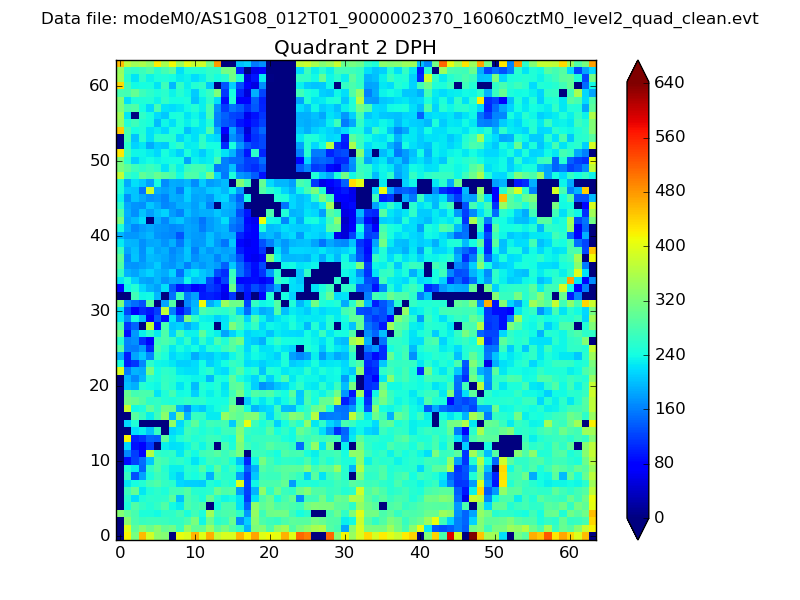 |
Quadrant C |
| Plot type | Count rate plots | Images |
|---|---|---|
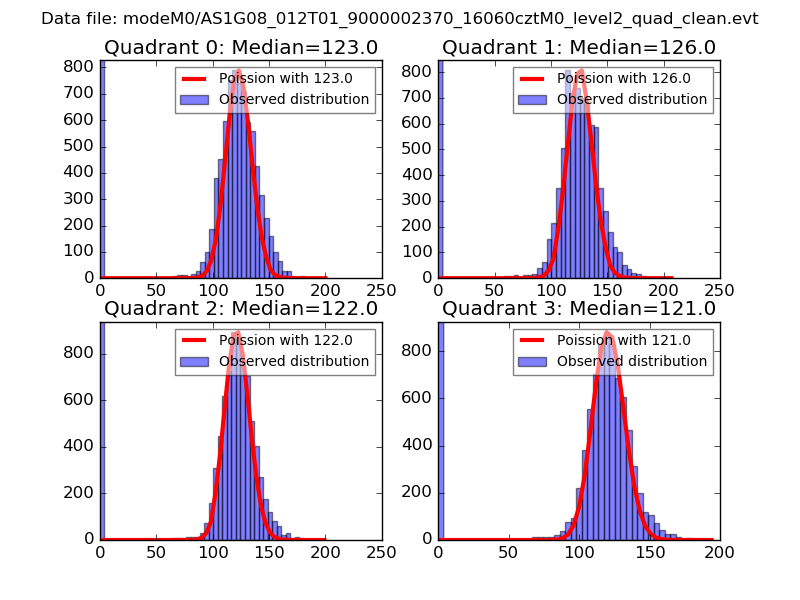
| Comparison with Poisson distribution Blue bars denote a histogram of data divided into 1 sec bins. Red curve is a Poisson curve with rate = median count rate of data. |
 |
 |
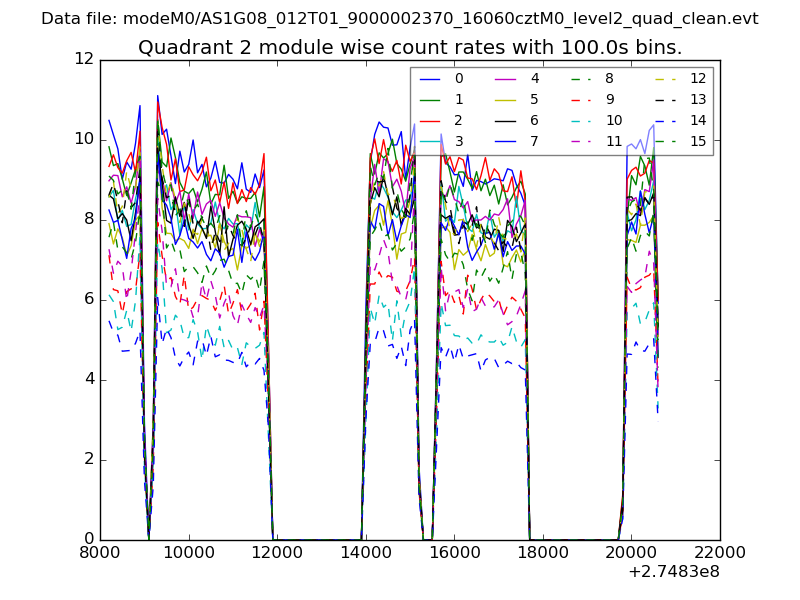
| Quadrant-wise count rates Data is divided into 100 sec bins |
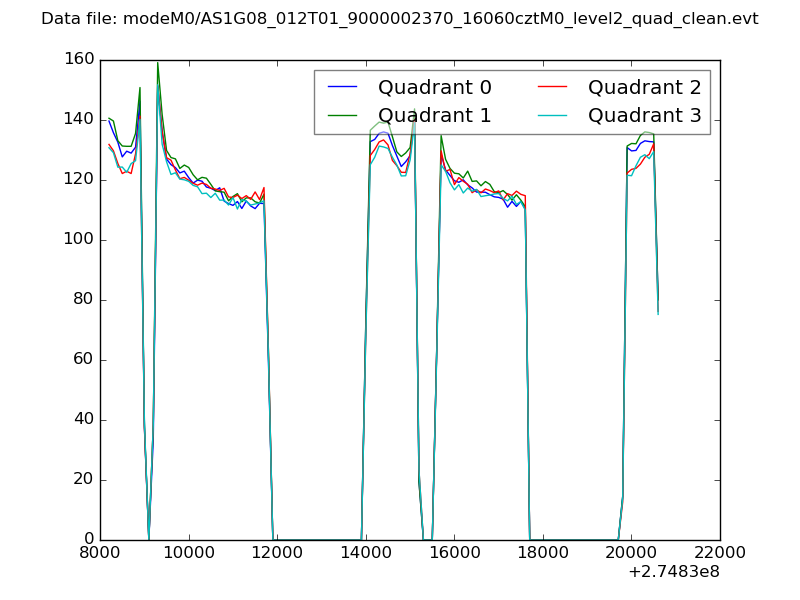 |
|
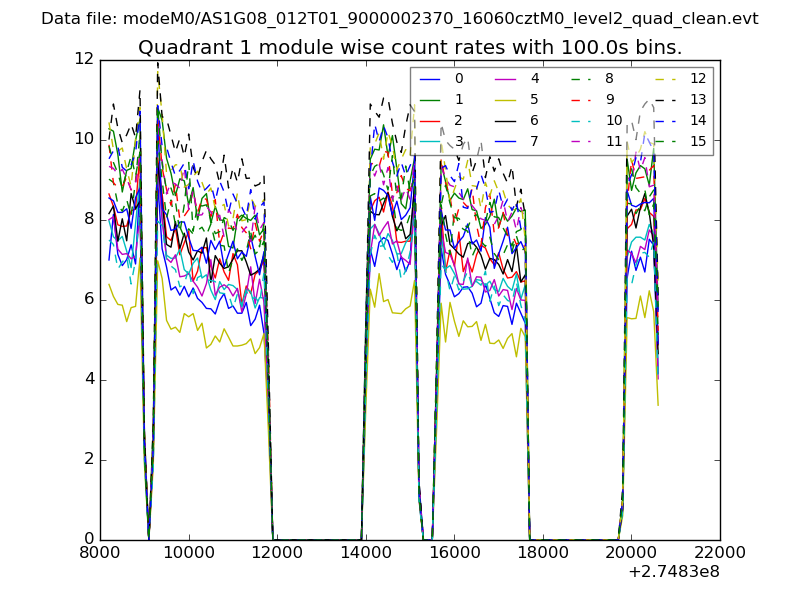
| Module-wise count rates for Quadrant A Data is divided into 100 sec bins |
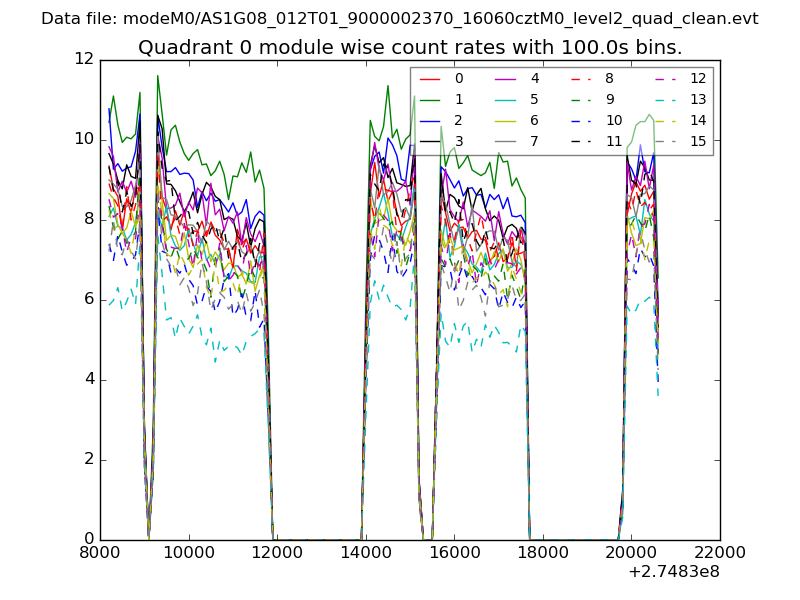 |
 |
| Module-wise count rates for Quadrant B Data is divided into 100 sec bins |
 |
 |
| Module-wise count rates for Quadrant C Data is divided into 100 sec bins |
 |
 |
| Module-wise count rates for Quadrant D Data is divided into 100 sec bins |
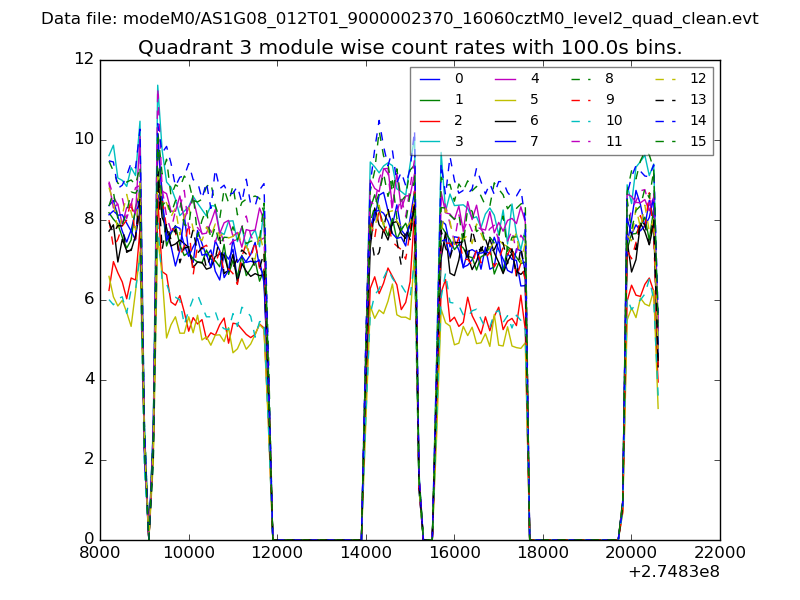 |
 |
| Parameter | Plot |
|---|---|
| CZT HV Monitor | 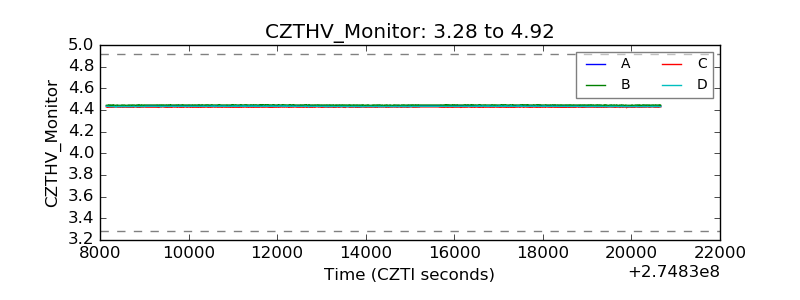 |
| D_VDD | 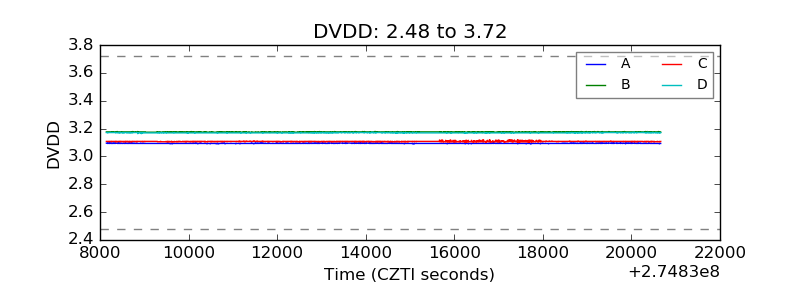 |
| Temperature 1 | 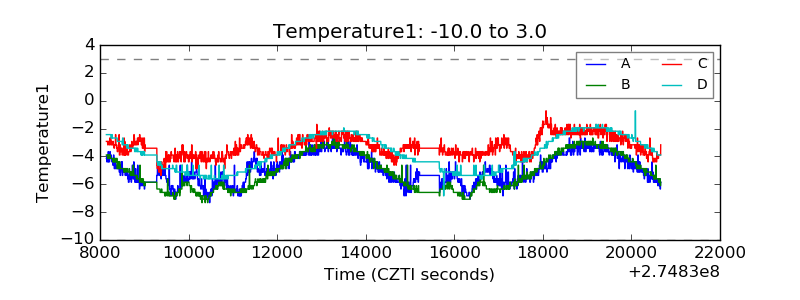 |
| Veto HV Monitor | 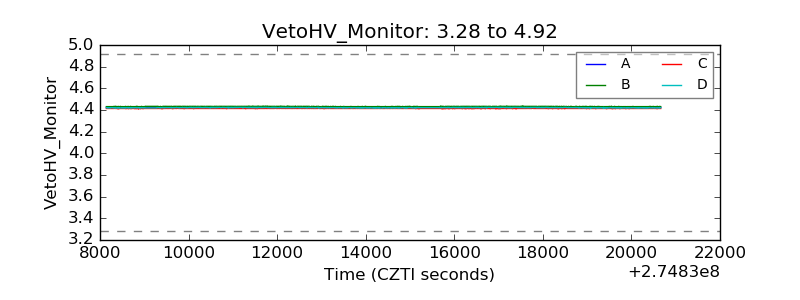 |
| Veto LLD | 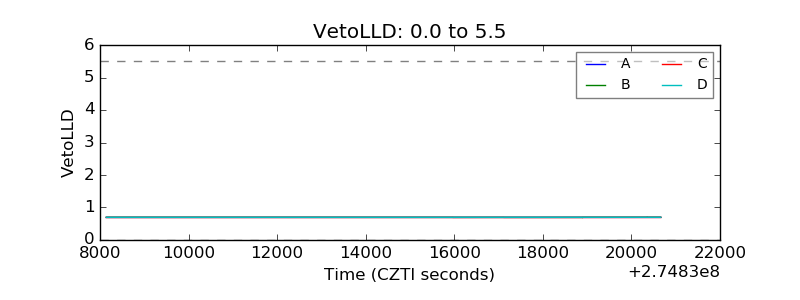 |
| Alpha Counter | 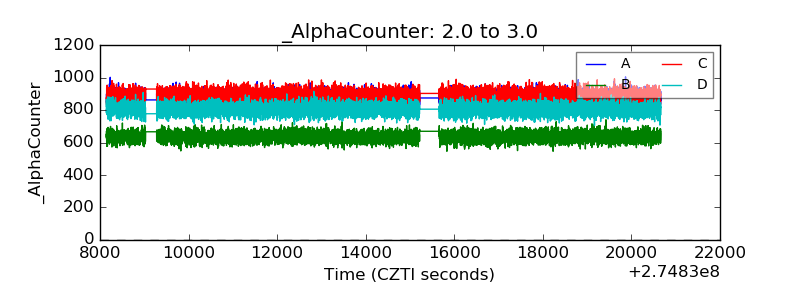 |
| _CPM_Rate |  |
| CZT Counter | 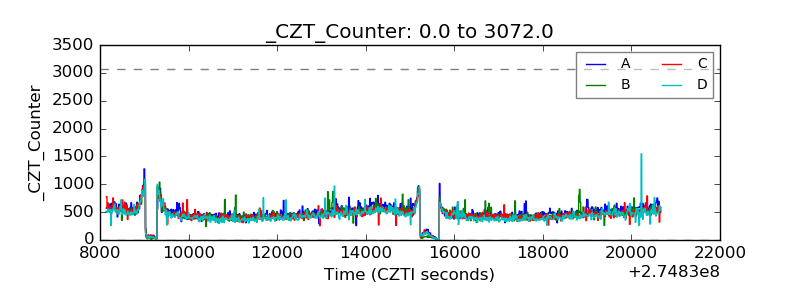 |
| +2.5 Volts monitor |  |
| +5 Volts monitor |  |
| _ROLL_ROT | 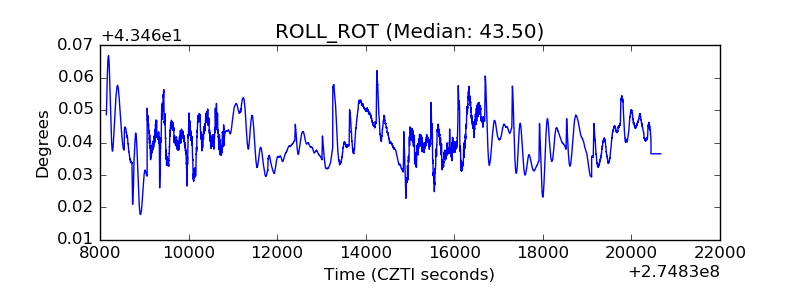 |
| _Roll_DEC | 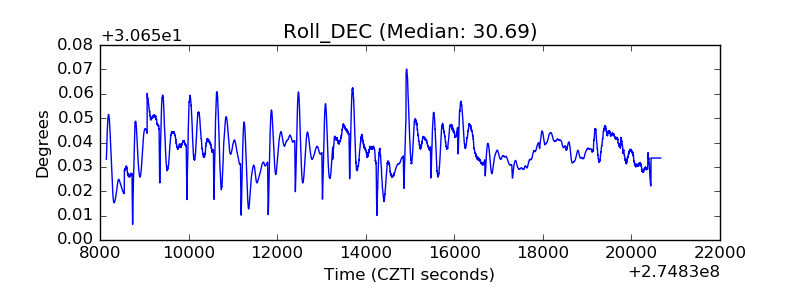 |
| _Roll_RA | 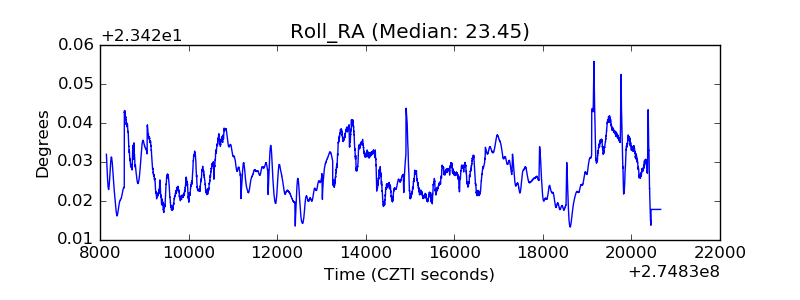 |
| Veto Counter | 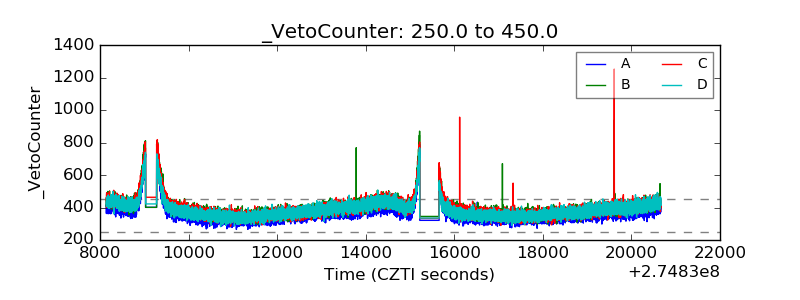 |