| Param | Original file | Final file |
|---|---|---|
| Filename | modeM0/AS1A04_230T01_9000002374cztM0_level2.fits | modeM0/AS1A04_230T01_9000002374cztM0_level2_quad_clean.evt |
| Size (bytes) | 870,376,320 | 769,671,360 |
| Size | 830.1 MB | 734.0 MB |
| Events in quadrant A | 5,386,020 | 4,554,946 |
| Events in quadrant B | 5,105,338 | 4,477,998 |
| Events in quadrant C | 5,185,006 | 4,258,873 |
| Events in quadrant D | 4,521,268 | 3,855,807 |
| Mode M9 | |||
|---|---|---|---|
| Quadrant | BADHDUFLAG | Total packets | Discarded packets |
| A | 0 | 160 | 0 |
| B | 0 | 160 | 0 |
| C | 0 | 160 | 0 |
| D | 0 | 160 | 0 |
| Mode SS | |||
|---|---|---|---|
| Quadrant | BADHDUFLAG | Total packets | Discarded packets |
| A | 0 | 1830 | 0 |
| B | 0 | 1830 | 0 |
| C | 0 | 1830 | 0 |
| D | 0 | 1830 | 0 |
| Mode M0 | |||
|---|---|---|---|
| Quadrant | BADHDUFLAG | Total packets | Discarded packets |
| A | 0 | 199125 | 0 |
| B | 0 | 201644 | 0 |
| C | 0 | 187841 | 0 |
| D | 0 | 219386 | 0 |
| Quadrant | Total seconds | Saturated seconds | Saturation percentage |
|---|---|---|---|
| A | 89875 | 1201 | 1.336300% |
| B | 89875 | 1599 | 1.779138% |
| C | 89875 | 1167 | 1.298470% |
| D | 89875 | 3074 | 3.420306% |
Noise dominated data is calculated using 1-second bins in cleaned event files. If a bin has >2000 counts, and if more than 50% of those come from <1% of pixels, then it is considered to be noise-dominated and hence unusable.
| Quadrant | # 1 sec bins | Bins with >0 counts | Bins with >2000 counts | High rate bins dominated by noise | Noise dominated (total time) | Noise dominated (detector-on time) | Marked lightcurve |
|---|---|---|---|---|---|---|---|
| A | 105890 | 89854 | 0 | 0 | 0.00% | 0.00% |  |
| B | 105889 | 89858 | 0 | 0 | 0.00% | 0.00% |  |
| C | 105889 | 89860 | 0 | 0 | 0.00% | 0.00% |  |
| D | 105890 | 89729 | 0 | 0 | 0.00% | 0.00% | 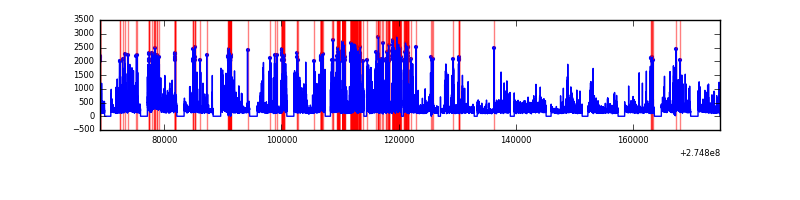 |
Top three noisy pixels from each quadrant. If the there are fewer than three noisy pixels in the level2.evt file, extra rows are filled as -1
| Pixel properties | Quadrant properties | ||||||
|---|---|---|---|---|---|---|---|
| Quadrant | DetID | PixID | Counts | Sigma | Mean | Median | Sigma |
| A | 0 | 29 | 5228 | 11.54 | 1400 | 1316 | 339.1 |
| A | 7 | 110 | 4277 | 8.73 | 1400 | 1316 | 339.1 |
| A | 0 | 30 | 4128 | 8.29 | 1400 | 1316 | 339.1 |
| B | 2 | 9 | 4242 | 11.09 | 1355 | 1295 | 265.8 |
| B | 2 | 8 | 3515 | 8.35 | 1355 | 1295 | 265.8 |
| B | 3 | 17 | 3431 | 8.04 | 1355 | 1295 | 265.8 |
| C | 12 | 241 | 3733 | 7.0 | 1371 | 1277 | 350.7 |
| C | 7 | 111 | 3438 | 6.16 | 1371 | 1277 | 350.7 |
| C | 3 | 158 | 3437 | 6.16 | 1371 | 1277 | 350.7 |
| D | 6 | 231 | 3311 | 6.23 | 1293 | 1179 | 342.3 |
| D | 3 | 14 | 3240 | 6.02 | 1293 | 1179 | 342.3 |
| D | 10 | 189 | 3193 | 5.88 | 1293 | 1179 | 342.3 |
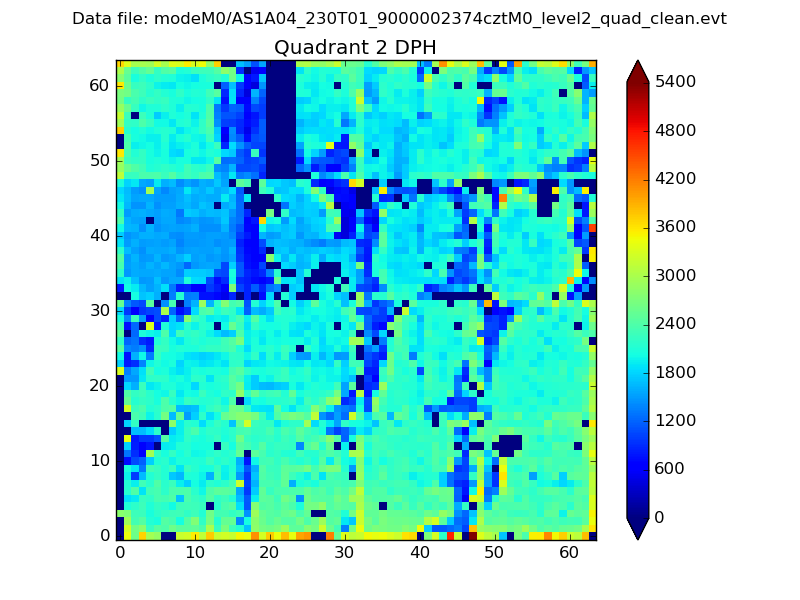
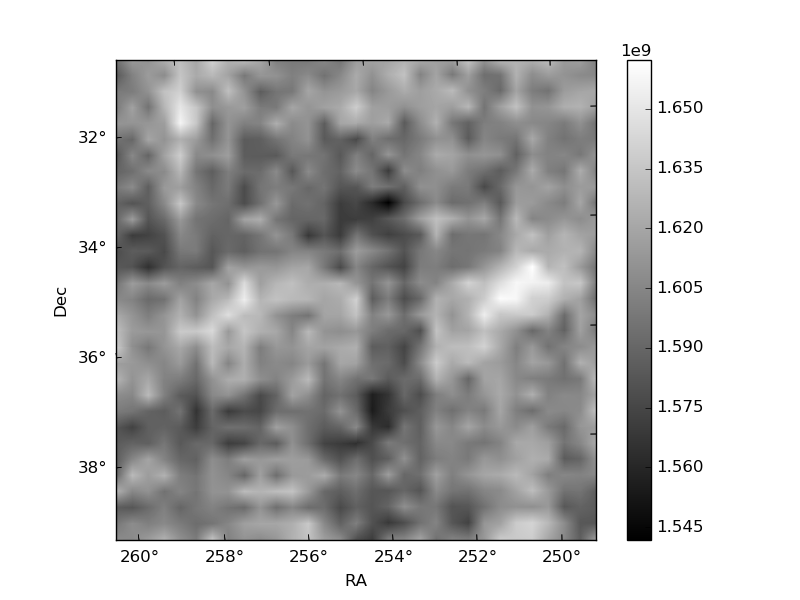
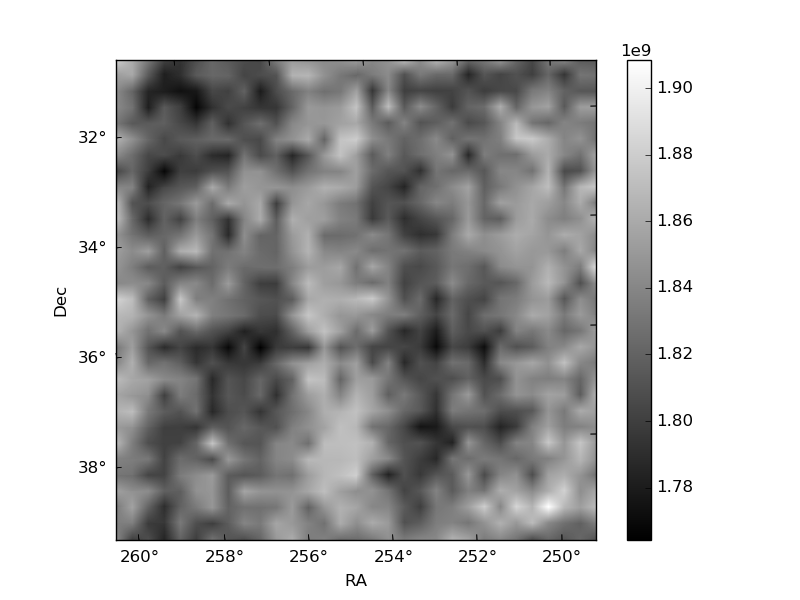
Histogram calculated using DETX and DETY for each event in the final _common_clean file
| Quadrant A | 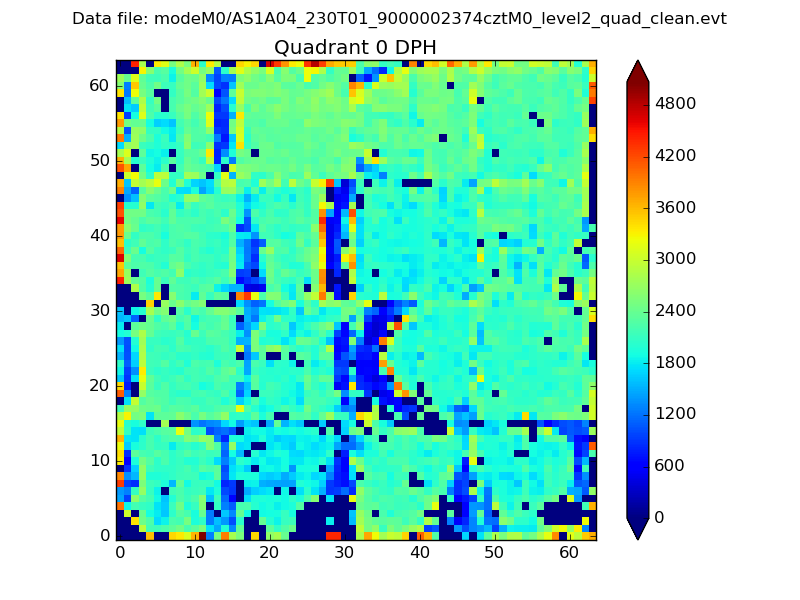 |
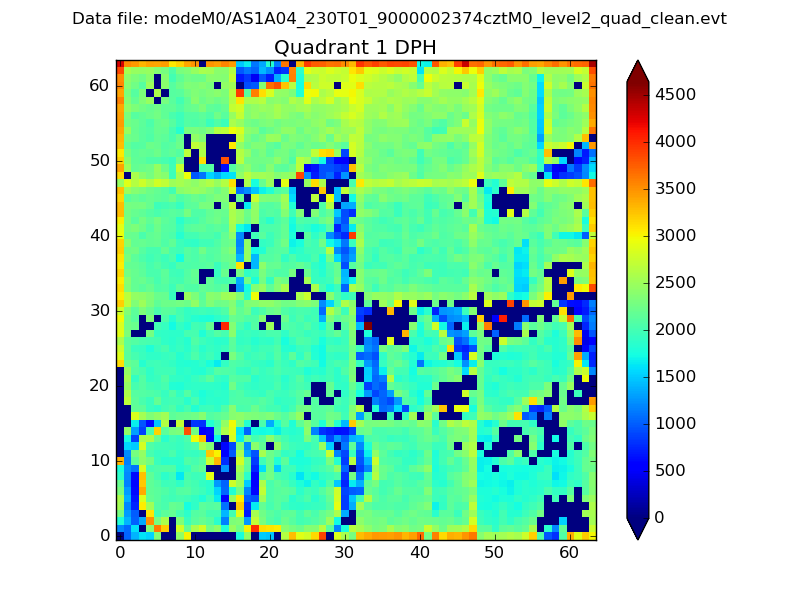 |
Quadrant B |
|---|---|---|---|
| Quadrant D | 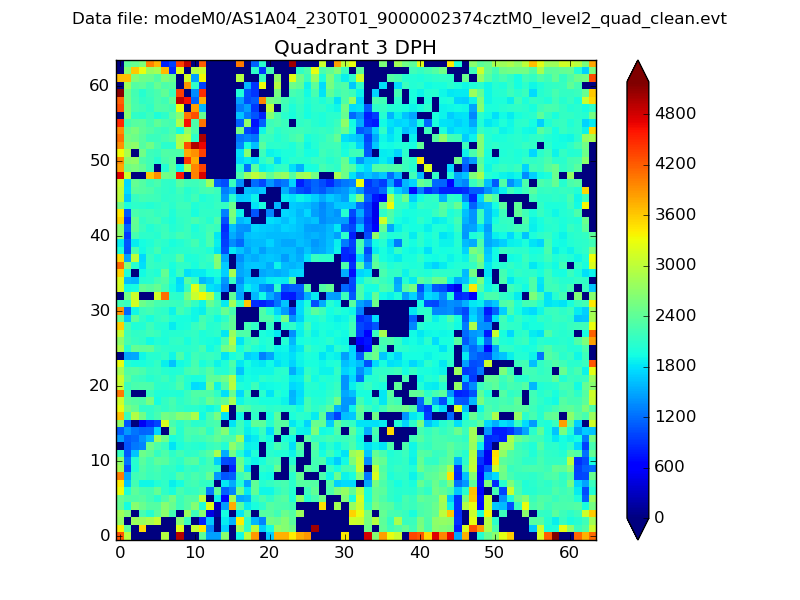 |
 |
Quadrant C |
| Plot type | Count rate plots | Images |
|---|---|---|
| Comparison with Poisson distribution Blue bars denote a histogram of data divided into 1 sec bins. Red curve is a Poisson curve with rate = median count rate of data. |
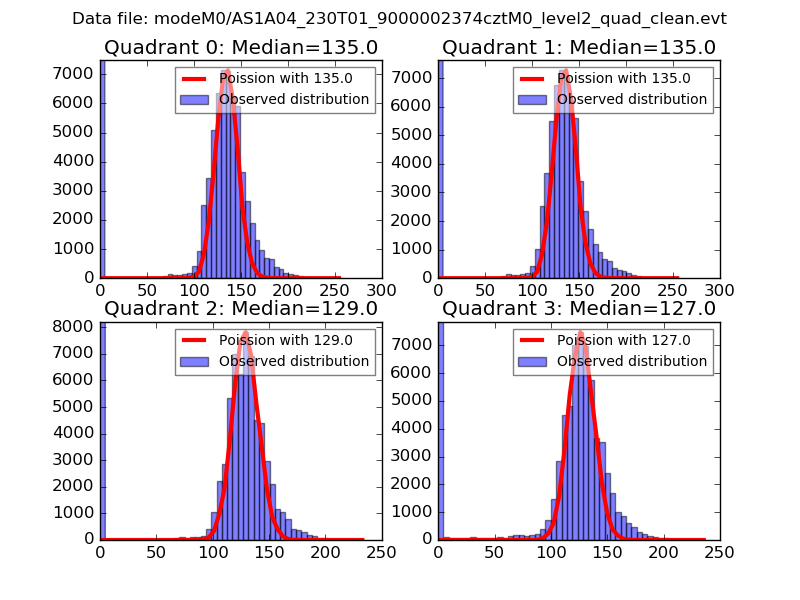 |
 |
| Quadrant-wise count rates Data is divided into 100 sec bins |
 |
|
| Module-wise count rates for Quadrant A Data is divided into 100 sec bins |
 |
 |
| Module-wise count rates for Quadrant B Data is divided into 100 sec bins |
 |
 |
| Module-wise count rates for Quadrant C Data is divided into 100 sec bins |
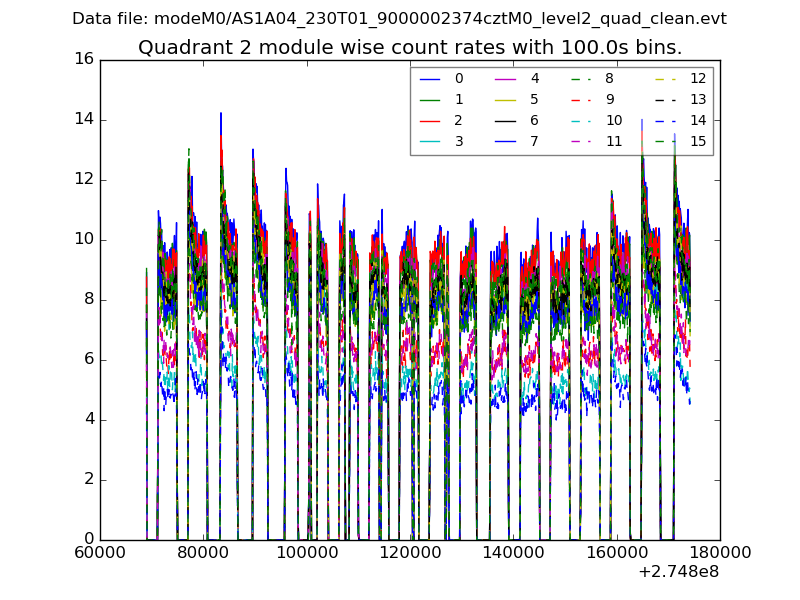 |
 |
| Module-wise count rates for Quadrant D Data is divided into 100 sec bins |
 |
 |
| Parameter | Plot |
|---|---|
| CZT HV Monitor |  |
| D_VDD | 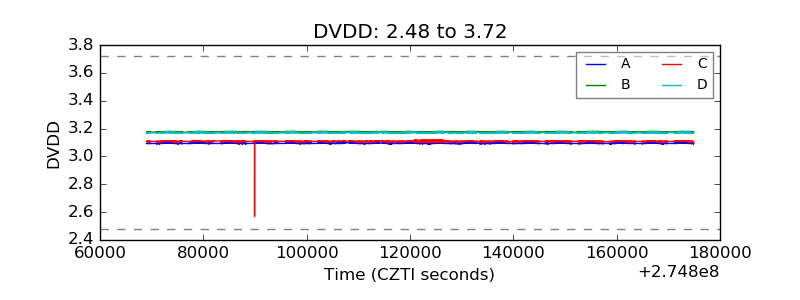 |
| Temperature 1 | 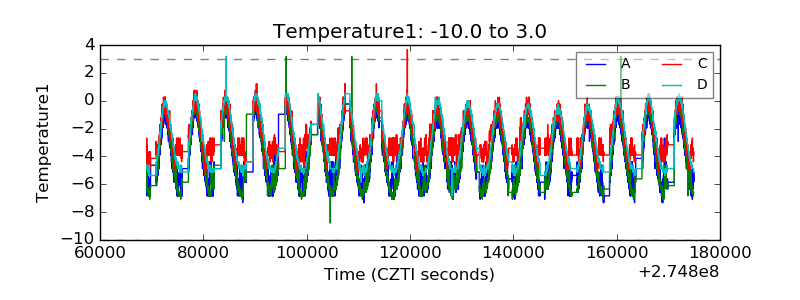 |
| Veto HV Monitor | 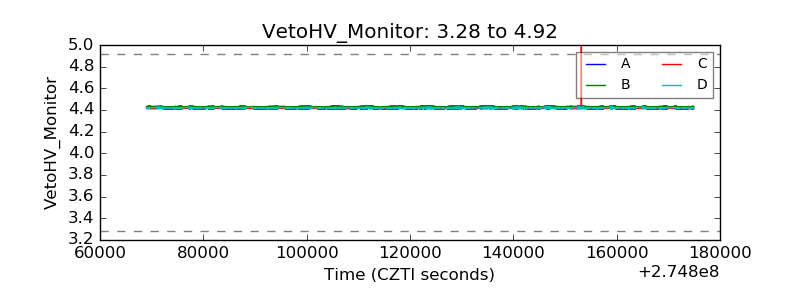 |
| Veto LLD |  |
| Alpha Counter |  |
| _CPM_Rate |  |
| CZT Counter | 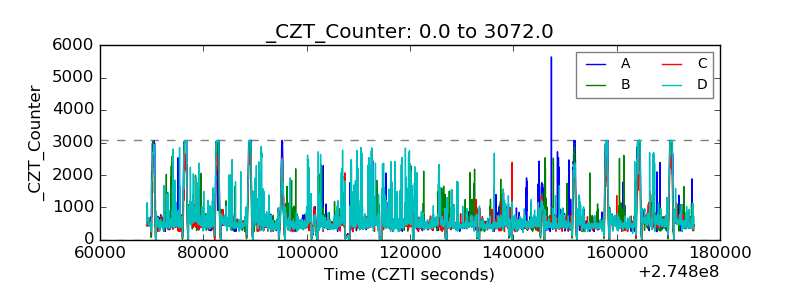 |
| +2.5 Volts monitor |  |
| +5 Volts monitor | 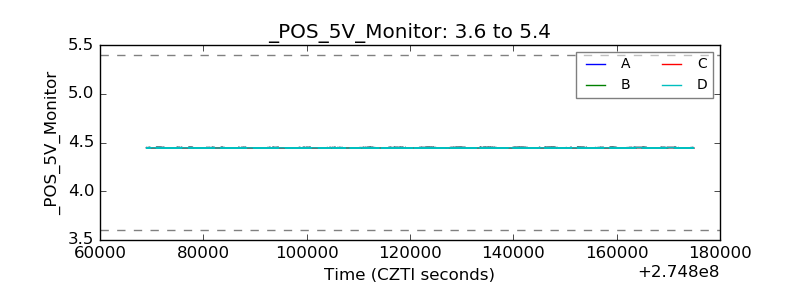 |
| _ROLL_ROT |  |
| _Roll_DEC |  |
| _Roll_RA | 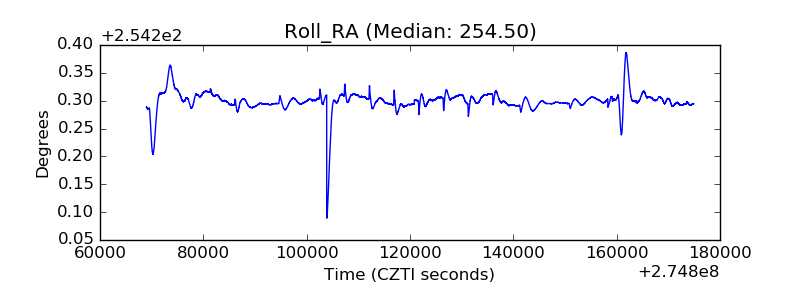 |
| Veto Counter |  |