| Param | Original file | Final file |
|---|---|---|
| Filename | modeM0/AS1A04_230T01_9000002374_16062cztM0_level2.evt | modeM0/AS1A04_230T01_9000002374_16062cztM0_level2_quad_clean.evt |
| Size (bytes) | 156,862,080 | 23,924,160 |
| Size | 149.6 MB | 22.8 MB |
| Events in quadrant A | 1,187,969 | 145,148 |
| Events in quadrant B | 1,140,584 | 148,248 |
| Events in quadrant C | 1,114,893 | 138,902 |
| Events in quadrant D | 1,160,488 | 137,885 |
| Mode M9 | |||
|---|---|---|---|
| Quadrant | BADHDUFLAG | Total packets | Discarded packets |
| A | 0 | 11 | 0 |
| B | 0 | 11 | 0 |
| C | 0 | 11 | 0 |
| D | 0 | 11 | 0 |
| Mode SS | |||
|---|---|---|---|
| Quadrant | BADHDUFLAG | Total packets | Discarded packets |
| A | 0 | 44 | 0 |
| B | 0 | 44 | 0 |
| C | 0 | 44 | 0 |
| D | 0 | 44 | 0 |
| Mode M0 | |||
|---|---|---|---|
| Quadrant | BADHDUFLAG | Total packets | Discarded packets |
| A | 0 | 4910 | 2 |
| B | 0 | 4653 | 1 |
| C | 0 | 4560 | 1 |
| D | 0 | 4746 | 1 |
| Quadrant | Total seconds | Saturated seconds | Saturation percentage |
|---|---|---|---|
| A | 2123 | 60 | 2.826189% |
| B | 2123 | 58 | 2.731983% |
| C | 2123 | 60 | 2.826189% |
| D | 2123 | 46 | 2.166745% |
Noise dominated data is calculated using 1-second bins in cleaned event files. If a bin has >2000 counts, and if more than 50% of those come from <1% of pixels, then it is considered to be noise-dominated and hence unusable.
| Quadrant | # 1 sec bins | Bins with >0 counts | Bins with >2000 counts | High rate bins dominated by noise | Noise dominated (total time) | Noise dominated (detector-on time) | Marked lightcurve |
|---|---|---|---|---|---|---|---|
| A | 3189 | 2124 | 1 | 1 | 0.03% | 0.05% | 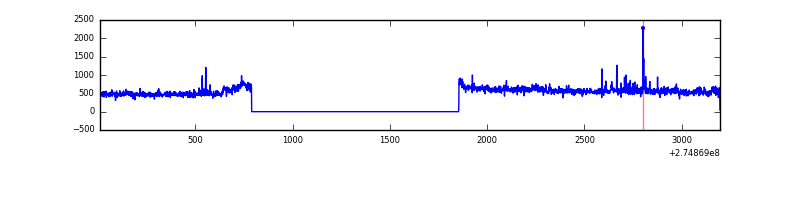 |
| B | 3189 | 2124 | 0 | 0 | 0.00% | 0.00% | 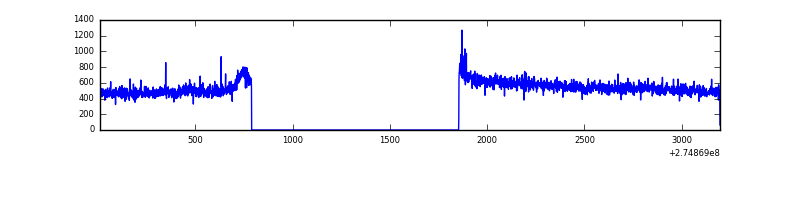 |
| C | 3189 | 2124 | 0 | 0 | 0.00% | 0.00% | 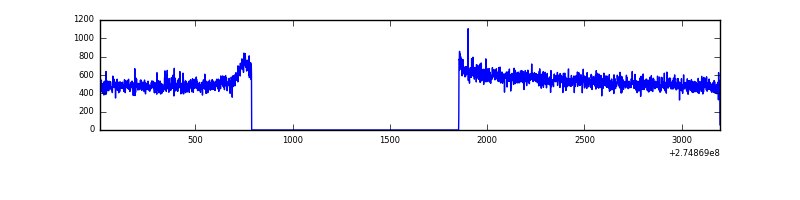 |
| D | 3189 | 2124 | 8 | 8 | 0.25% | 0.38% | 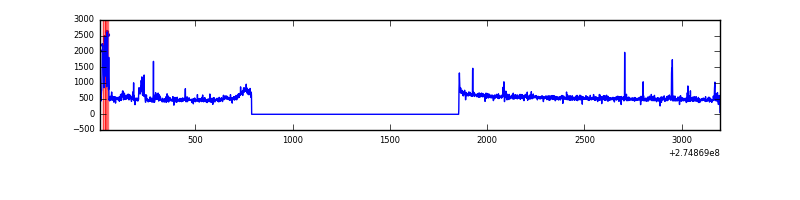 |
Top three noisy pixels from each quadrant. If the there are fewer than three noisy pixels in the level2.evt file, extra rows are filled as -1
| Pixel properties | Quadrant properties | ||||||
|---|---|---|---|---|---|---|---|
| Quadrant | DetID | PixID | Counts | Sigma | Mean | Median | Sigma |
| A | 3 | 80 | 50778 | 845.13 | 290 | 285 | 59.7 |
| A | 9 | 143 | 17096 | 281.37 | 290 | 285 | 59.7 |
| A | 12 | 96 | 3028 | 45.91 | 290 | 285 | 59.7 |
| B | 12 | 111 | 6679 | 111.8 | 289 | 281 | 57.2 |
| B | 11 | 111 | 5788 | 96.23 | 289 | 281 | 57.2 |
| B | 4 | 80 | 4783 | 78.67 | 289 | 281 | 57.2 |
| C | 14 | 238 | 41940 | 638.35 | 274 | 275 | 65.3 |
| C | 3 | 233 | 2614 | 35.84 | 274 | 275 | 65.3 |
| C | 9 | 236 | 1952 | 25.69 | 274 | 275 | 65.3 |
| D | 1 | 52 | 81281 | 1152.11 | 281 | 273 | 70.3 |
| D | 2 | 234 | 6659 | 90.82 | 281 | 273 | 70.3 |
| D | 2 | 152 | 4665 | 62.46 | 281 | 273 | 70.3 |
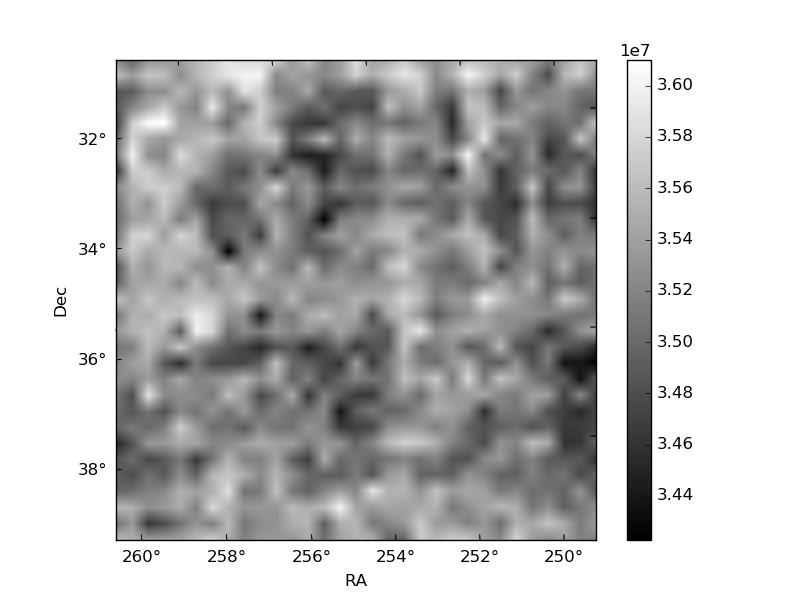
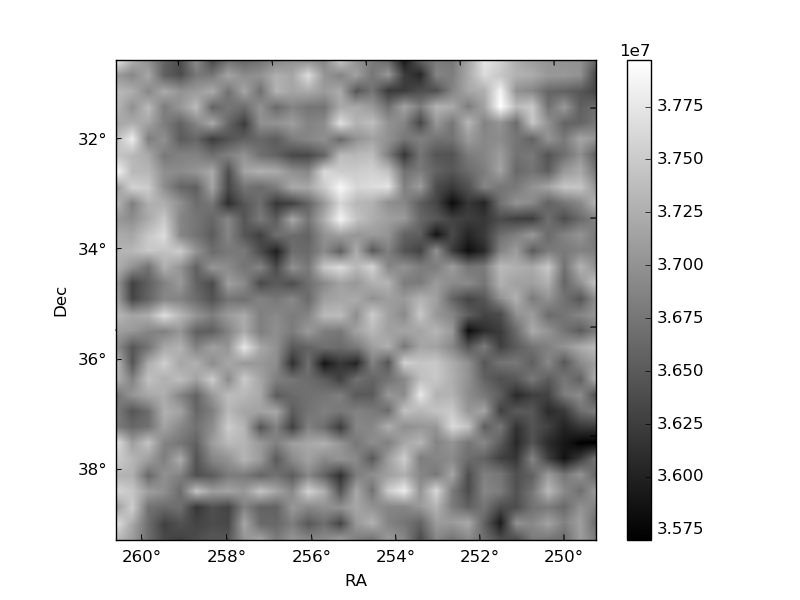
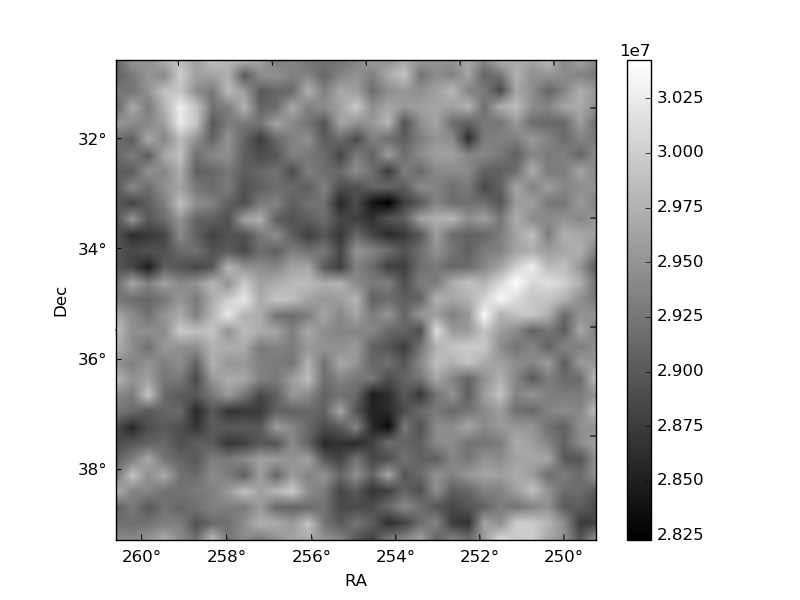
Histogram calculated using DETX and DETY for each event in the final _common_clean file
| Quadrant A | 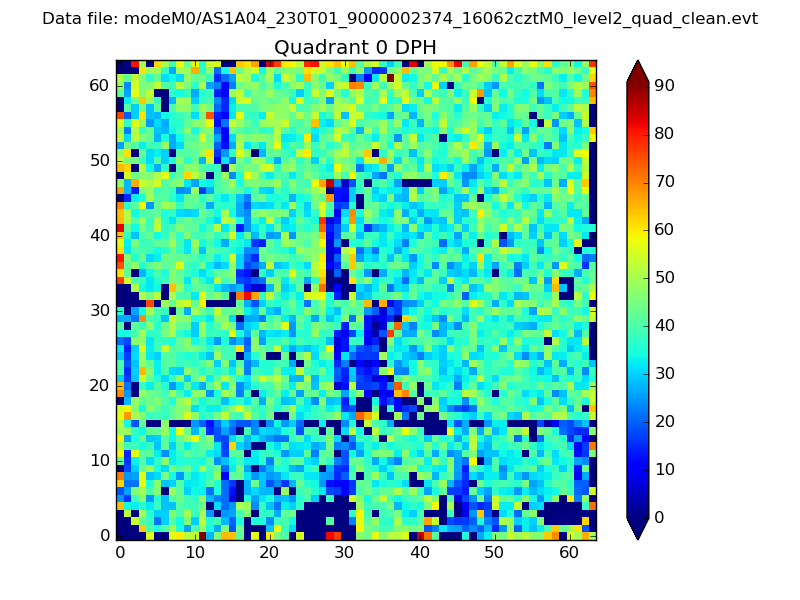 |
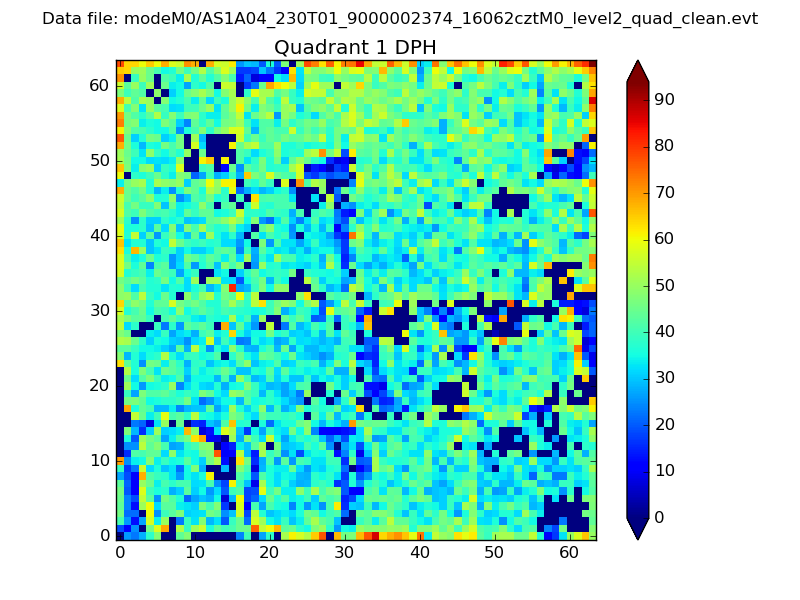 |
Quadrant B |
|---|---|---|---|
| Quadrant D |  |
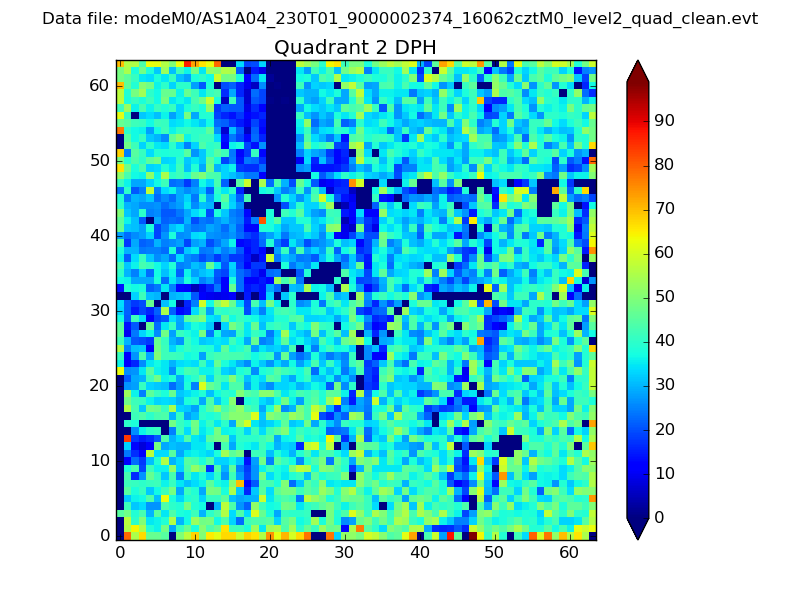 |
Quadrant C |
| Plot type | Count rate plots | Images |
|---|---|---|
| Comparison with Poisson distribution Blue bars denote a histogram of data divided into 1 sec bins. Red curve is a Poisson curve with rate = median count rate of data. |
 |
 |
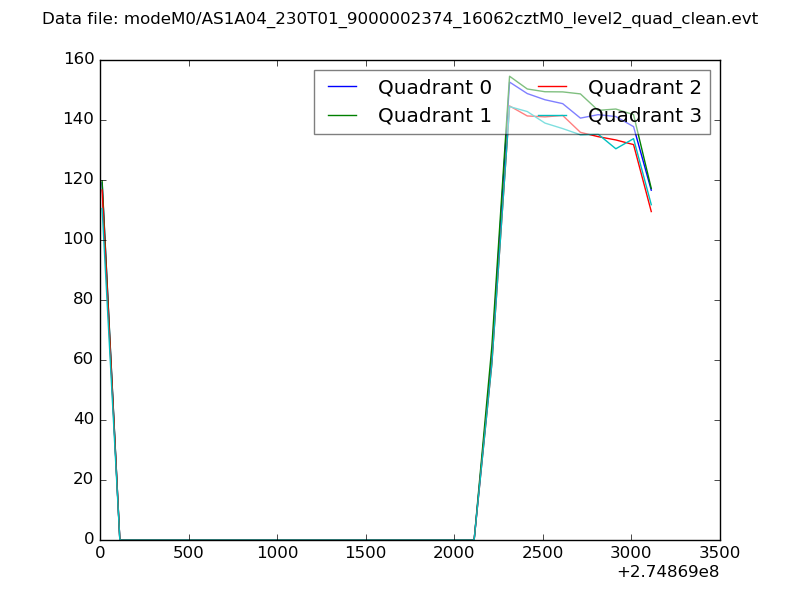
| Quadrant-wise count rates Data is divided into 100 sec bins |
 |
|
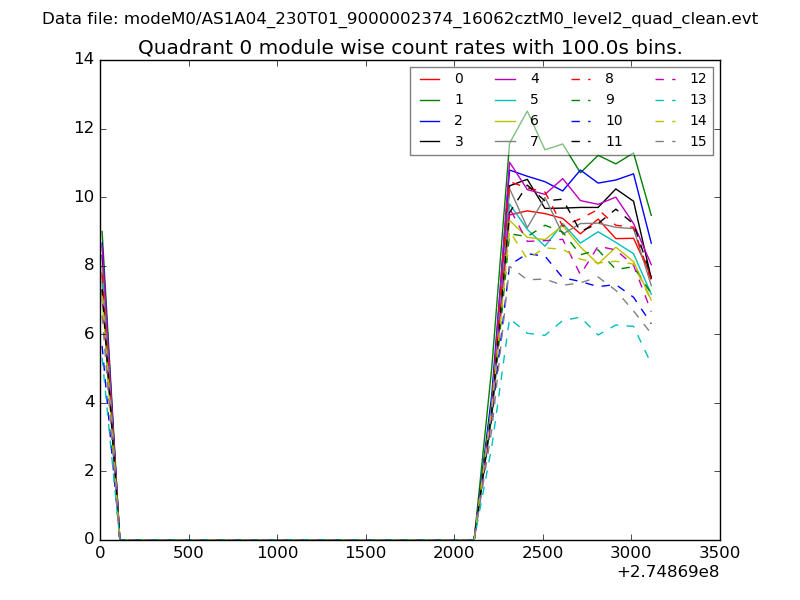
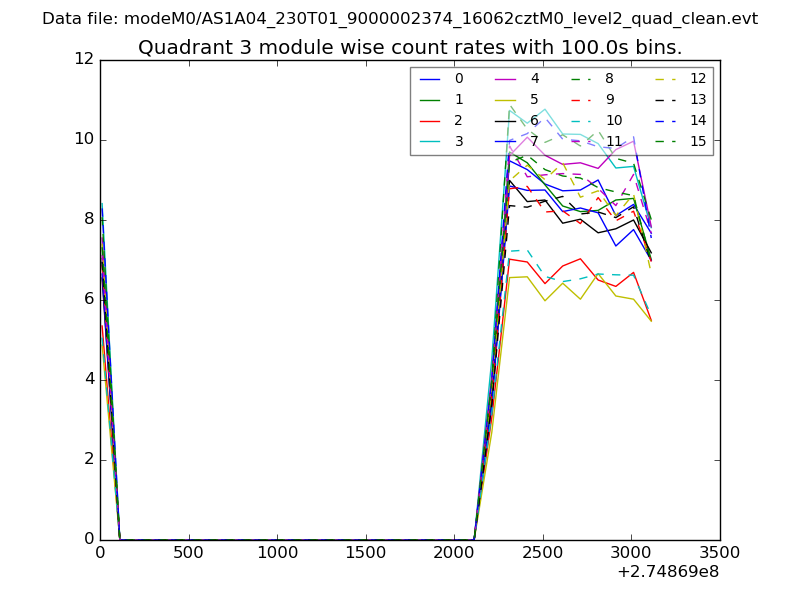
| Module-wise count rates for Quadrant A Data is divided into 100 sec bins |
 |
 |
| Module-wise count rates for Quadrant B Data is divided into 100 sec bins |
 |
 |
| Module-wise count rates for Quadrant C Data is divided into 100 sec bins |
 |
 |
| Module-wise count rates for Quadrant D Data is divided into 100 sec bins |
 |
 |
| Parameter | Plot |
|---|---|
| CZT HV Monitor |  |
| D_VDD | 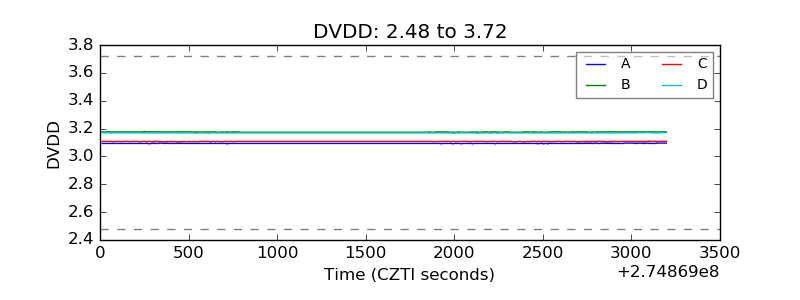 |
| Temperature 1 | 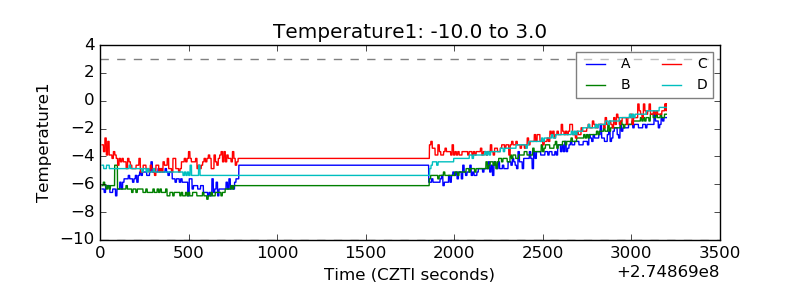 |
| Veto HV Monitor | 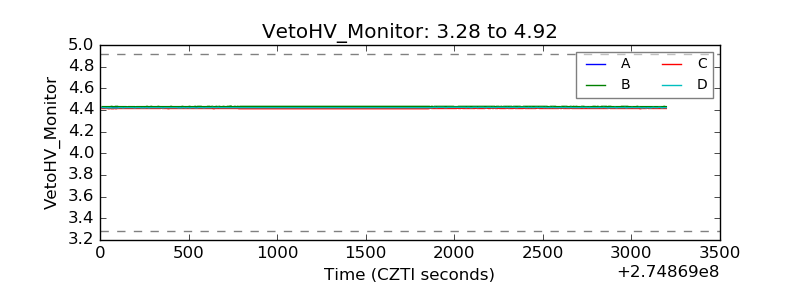 |
| Veto LLD | 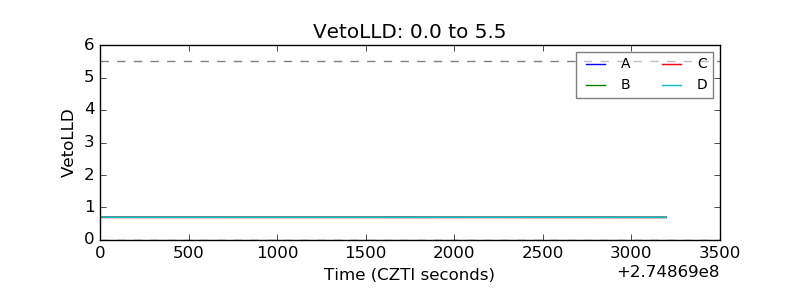 |
| Alpha Counter | 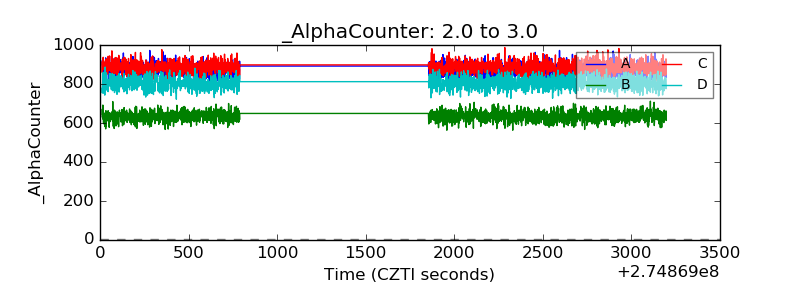 |
| _CPM_Rate | 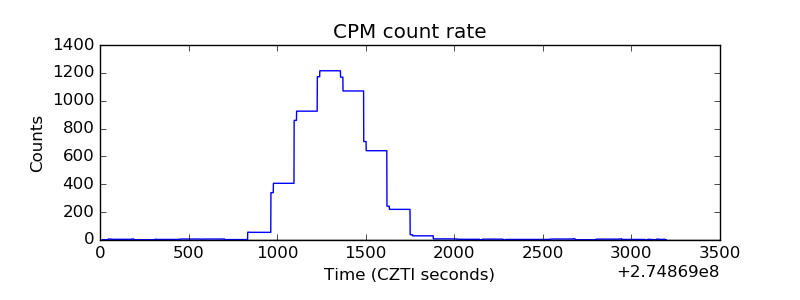 |
| CZT Counter | 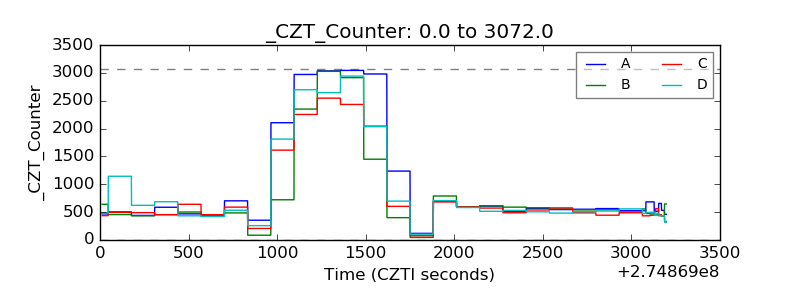 |
| +2.5 Volts monitor |  |
| +5 Volts monitor |  |
| _ROLL_ROT | 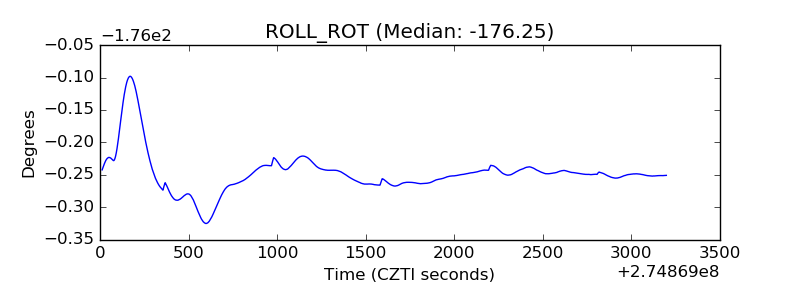 |
| _Roll_DEC | 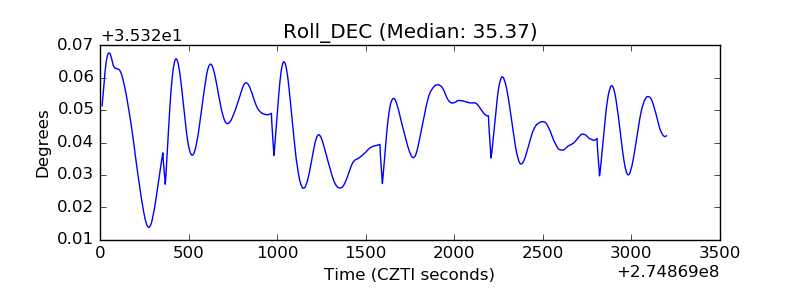 |
| _Roll_RA | 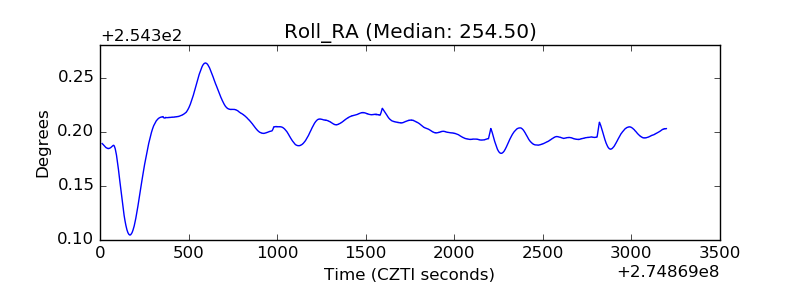 |
| Veto Counter | 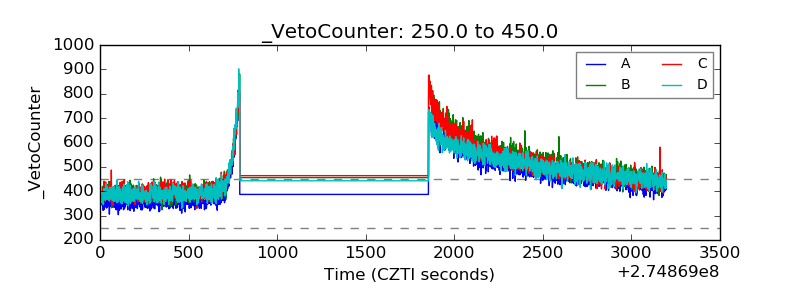 |