| Param | Original file | Final file |
|---|---|---|
| Filename | modeM0/AS1A04_230T01_9000002374_16064cztM0_level2.evt | modeM0/AS1A04_230T01_9000002374_16064cztM0_level2_quad_clean.evt |
| Size (bytes) | 434,828,160 | 101,934,720 |
| Size | 414.7 MB | 97.2 MB |
| Events in quadrant A | 3,122,160 | 691,904 |
| Events in quadrant B | 3,184,023 | 689,520 |
| Events in quadrant C | 2,884,133 | 650,376 |
| Events in quadrant D | 3,580,038 | 645,515 |
| Mode M9 | |||
|---|---|---|---|
| Quadrant | BADHDUFLAG | Total packets | Discarded packets |
| A | 0 | 12 | 0 |
| B | 0 | 12 | 0 |
| C | 0 | 12 | 0 |
| D | 0 | 12 | 0 |
| Mode SS | |||
|---|---|---|---|
| Quadrant | BADHDUFLAG | Total packets | Discarded packets |
| A | 0 | 118 | 0 |
| B | 0 | 118 | 0 |
| C | 0 | 118 | 0 |
| D | 0 | 118 | 0 |
| Mode M0 | |||
|---|---|---|---|
| Quadrant | BADHDUFLAG | Total packets | Discarded packets |
| A | 0 | 12924 | 2 |
| B | 0 | 13095 | 1 |
| C | 0 | 12271 | 1 |
| D | 0 | 14462 | 1 |
| Quadrant | Total seconds | Saturated seconds | Saturation percentage |
|---|---|---|---|
| A | 5870 | 47 | 0.800681% |
| B | 5870 | 71 | 1.209540% |
| C | 5870 | 50 | 0.851789% |
| D | 5870 | 108 | 1.839864% |
Noise dominated data is calculated using 1-second bins in cleaned event files. If a bin has >2000 counts, and if more than 50% of those come from <1% of pixels, then it is considered to be noise-dominated and hence unusable.
| Quadrant | # 1 sec bins | Bins with >0 counts | Bins with >2000 counts | High rate bins dominated by noise | Noise dominated (total time) | Noise dominated (detector-on time) | Marked lightcurve |
|---|---|---|---|---|---|---|---|
| A | 7056 | 5871 | 3 | 3 | 0.04% | 0.05% | 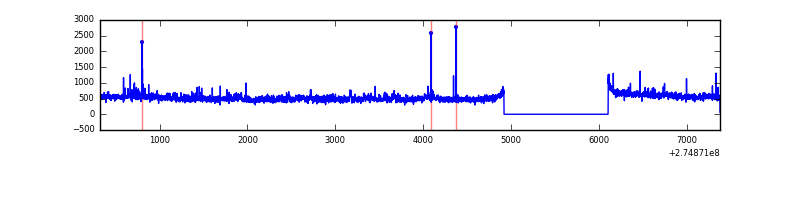 |
| B | 7056 | 5871 | 28 | 28 | 0.40% | 0.48% | 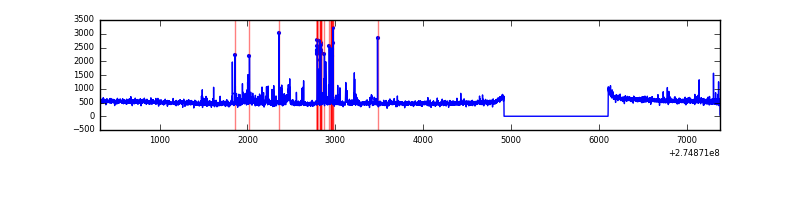 |
| C | 7056 | 5871 | 3 | 3 | 0.04% | 0.05% | 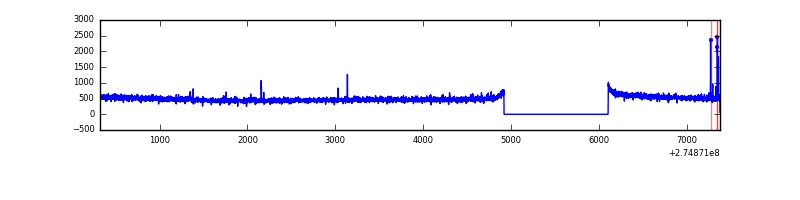 |
| D | 7056 | 5871 | 82 | 82 | 1.16% | 1.40% | 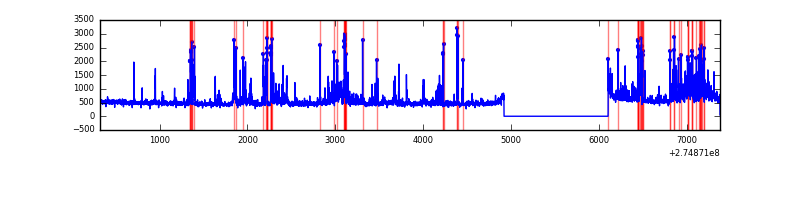 |
Top three noisy pixels from each quadrant. If the there are fewer than three noisy pixels in the level2.evt file, extra rows are filled as -1
| Pixel properties | Quadrant properties | ||||||
|---|---|---|---|---|---|---|---|
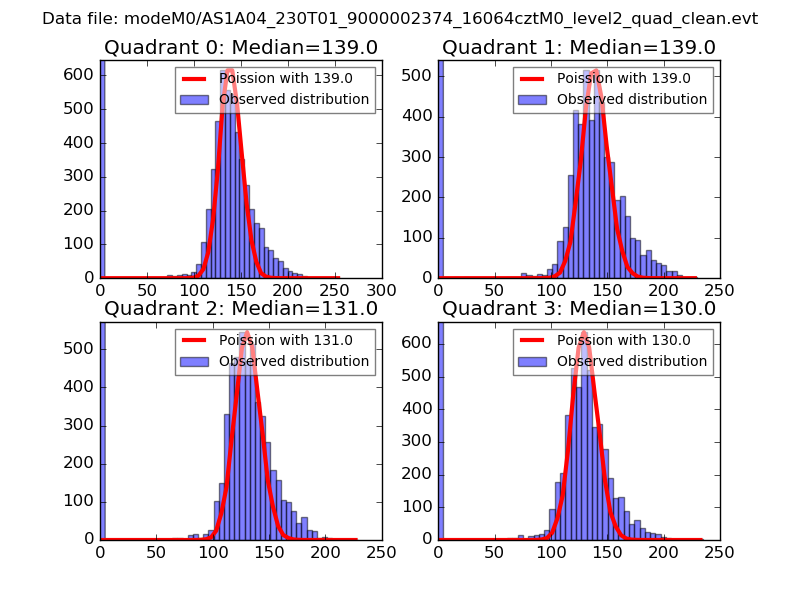
| Quadrant | DetID | PixID | Counts | Sigma | Mean | Median | Sigma |
| A | 3 | 80 | 184887 | 1221.84 | 750 | 735 | 150.7 |
| A | 9 | 143 | 38694 | 251.86 | 750 | 735 | 150.7 |
| A | 12 | 96 | 13044 | 81.67 | 750 | 735 | 150.7 |
| B | 7 | 220 | 155127 | 1113.97 | 738 | 720 | 138.6 |
| B | 0 | 189 | 39459 | 279.48 | 738 | 720 | 138.6 |
| B | 0 | 197 | 20419 | 142.12 | 738 | 720 | 138.6 |
| C | 14 | 238 | 108366 | 659.58 | 702 | 706 | 163.2 |
| C | 3 | 233 | 17152 | 100.76 | 702 | 706 | 163.2 |
| C | 0 | 207 | 16973 | 99.66 | 702 | 706 | 163.2 |
| D | 12 | 218 | 412580 | 2354.17 | 720 | 701 | 175.0 |
| D | 1 | 52 | 263221 | 1500.48 | 720 | 701 | 175.0 |
| D | 13 | 232 | 56309 | 317.84 | 720 | 701 | 175.0 |
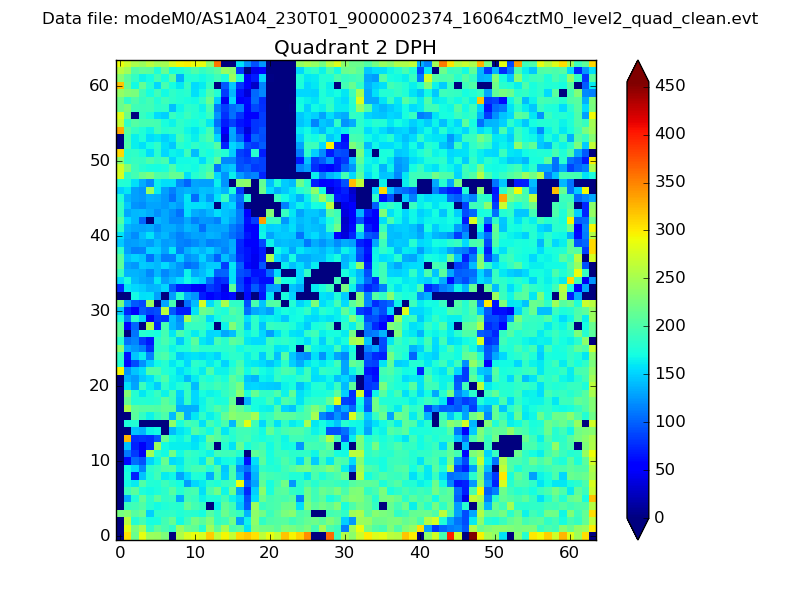
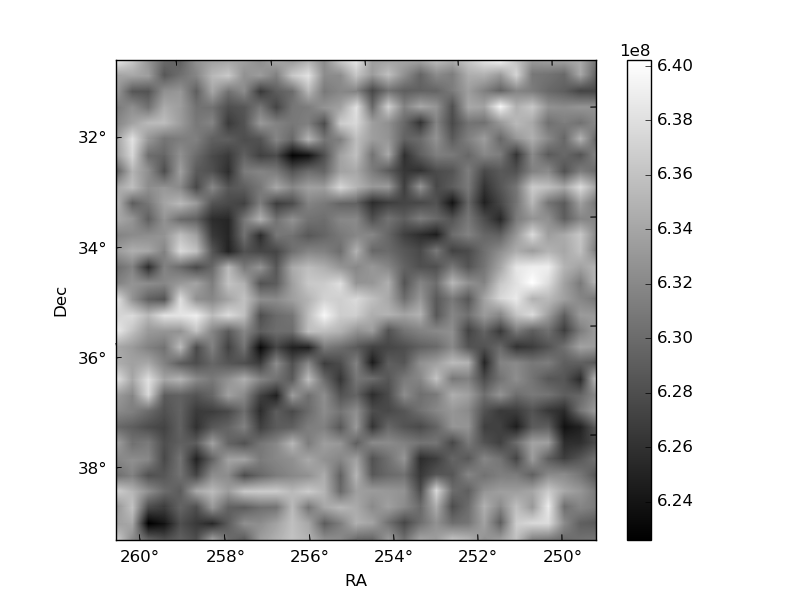
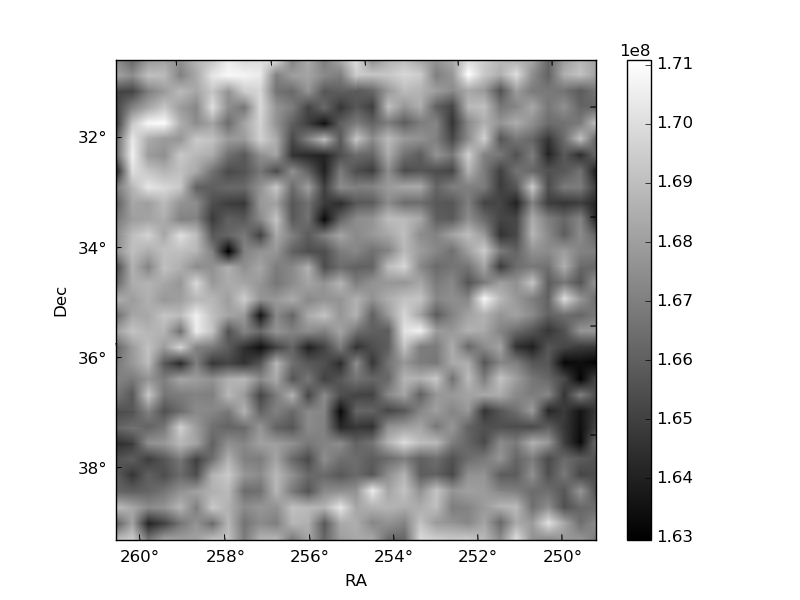
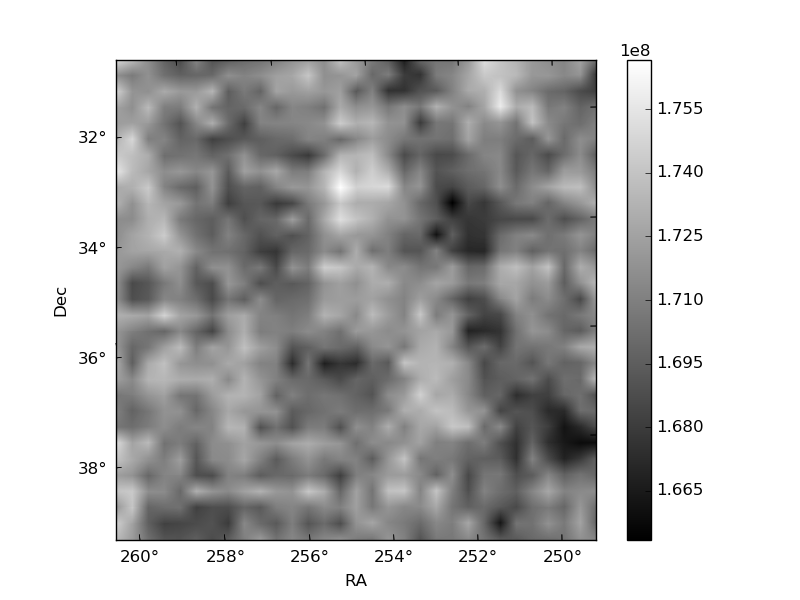
Histogram calculated using DETX and DETY for each event in the final _common_clean file
| Quadrant A | 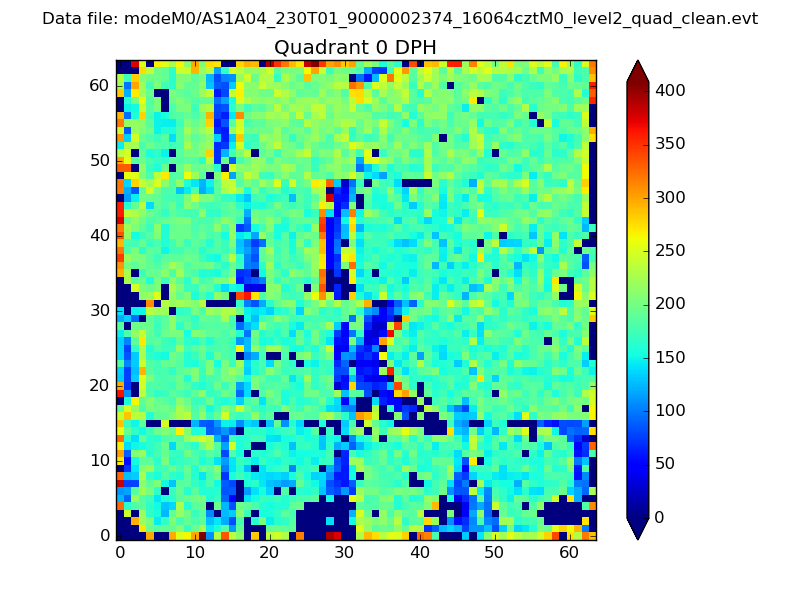 |
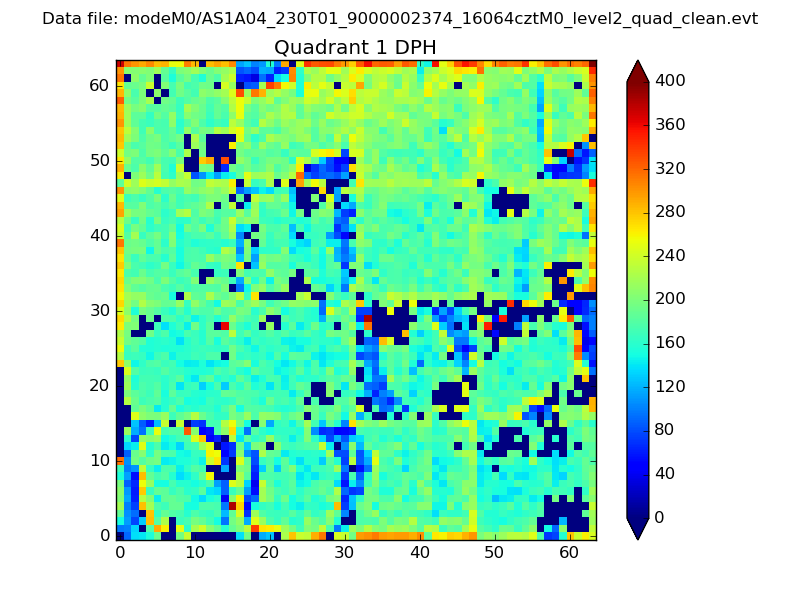 |
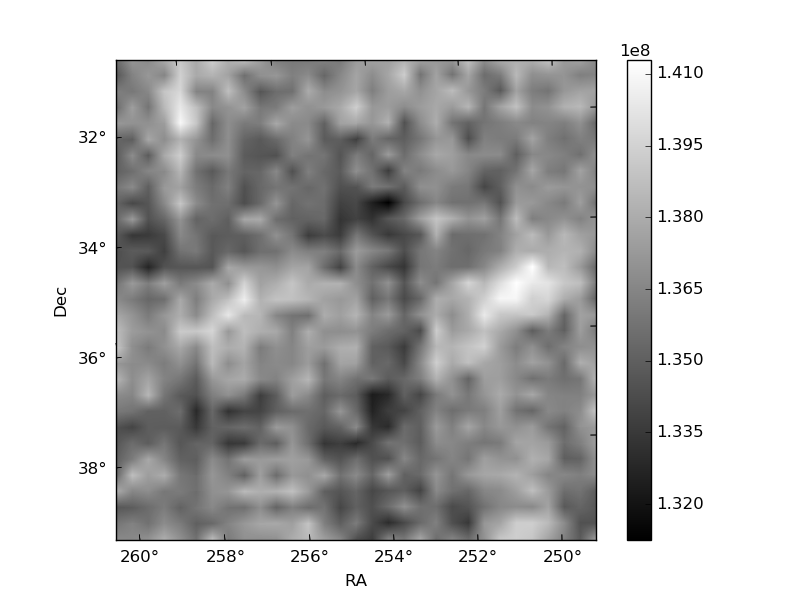
Quadrant B |
|---|---|---|---|
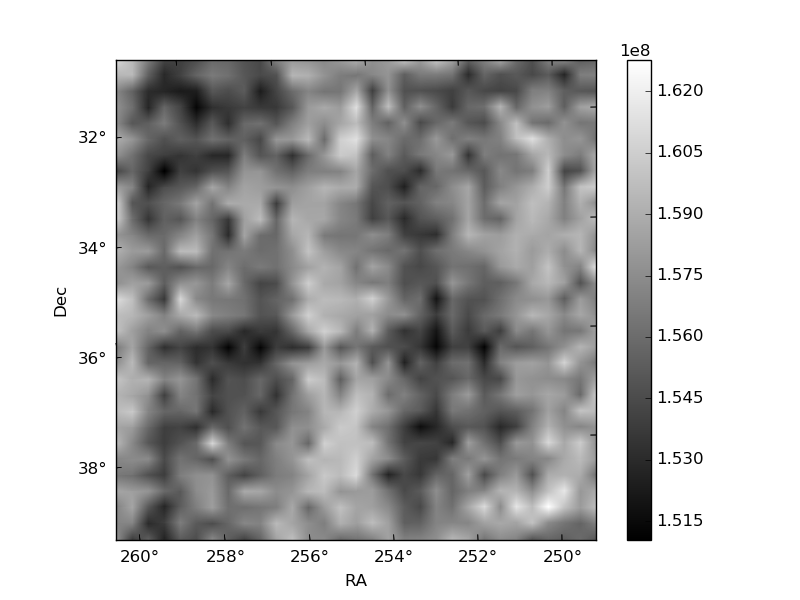
| Quadrant D | 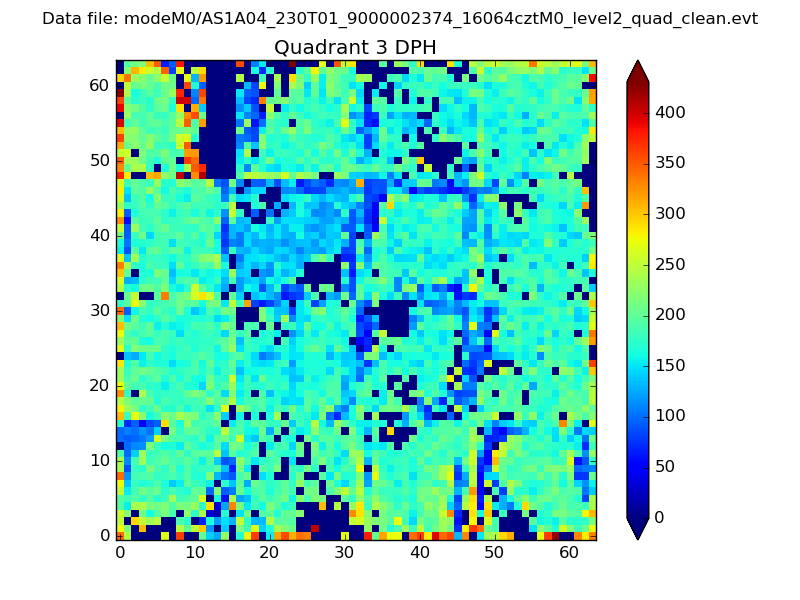 |
 |
Quadrant C |
| Plot type | Count rate plots | Images |
|---|---|---|
| Comparison with Poisson distribution Blue bars denote a histogram of data divided into 1 sec bins. Red curve is a Poisson curve with rate = median count rate of data. |
 |
 |
| Quadrant-wise count rates Data is divided into 100 sec bins |
 |
|
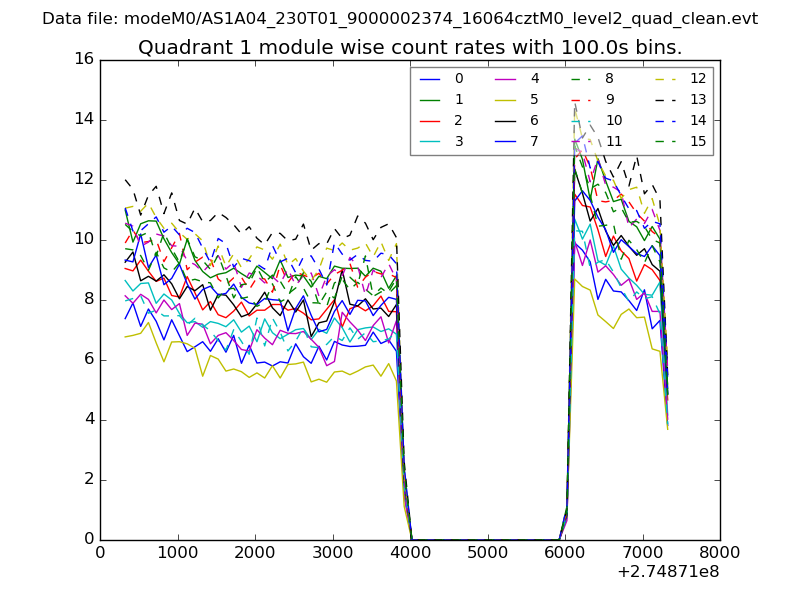
| Module-wise count rates for Quadrant A Data is divided into 100 sec bins |
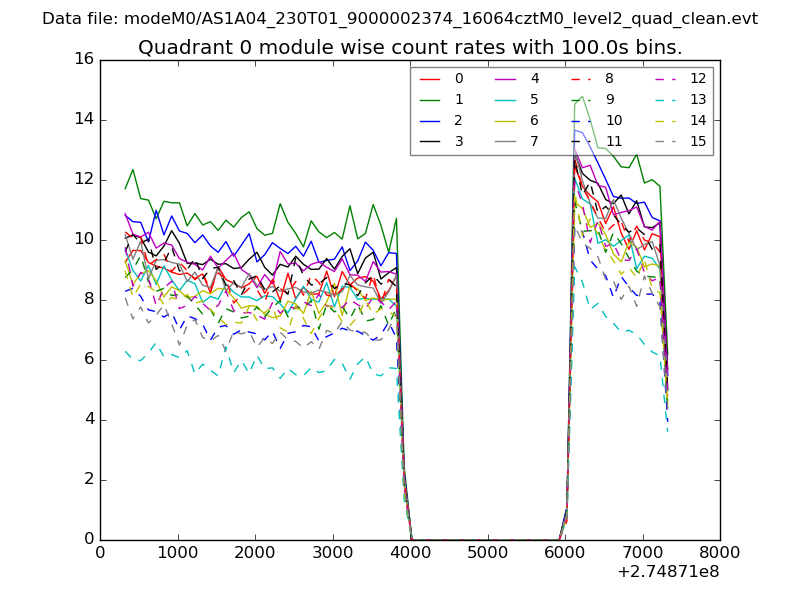 |
 |
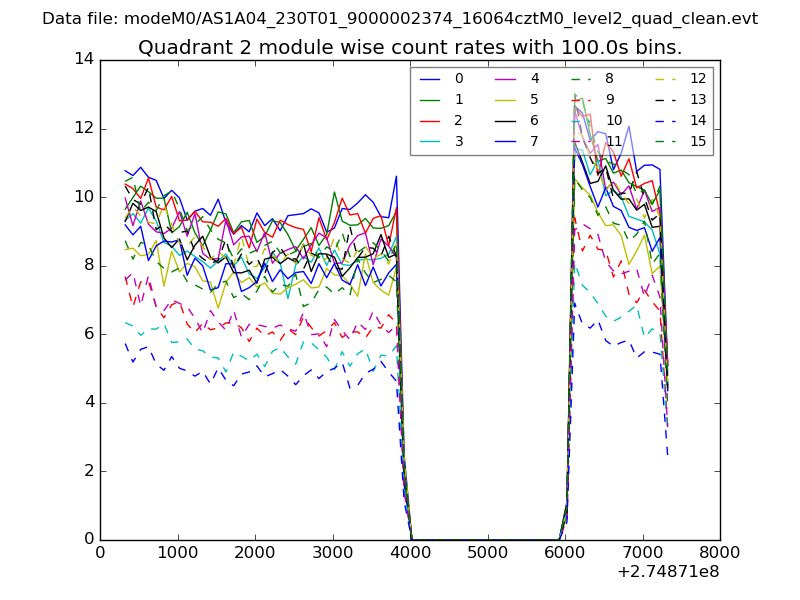
| Module-wise count rates for Quadrant B Data is divided into 100 sec bins |
 |
 |
| Module-wise count rates for Quadrant C Data is divided into 100 sec bins |
 |
 |
| Module-wise count rates for Quadrant D Data is divided into 100 sec bins |
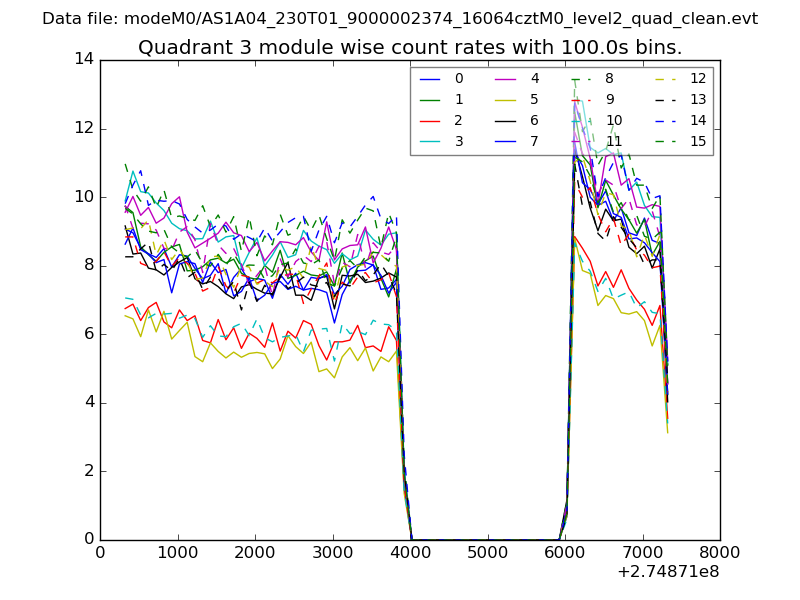 |
 |
| Parameter | Plot |
|---|---|
| CZT HV Monitor | 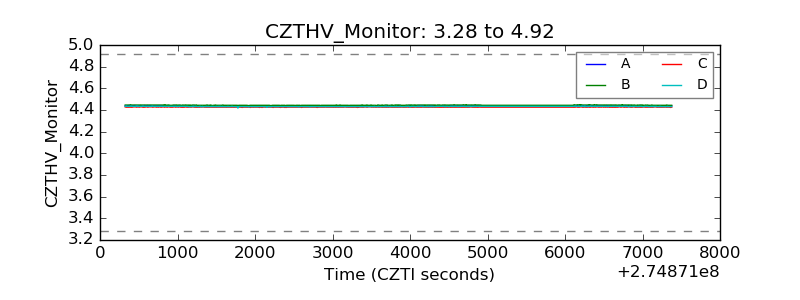 |
| D_VDD | 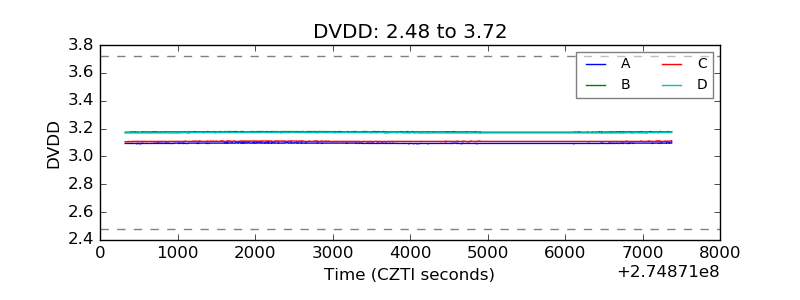 |
| Temperature 1 | 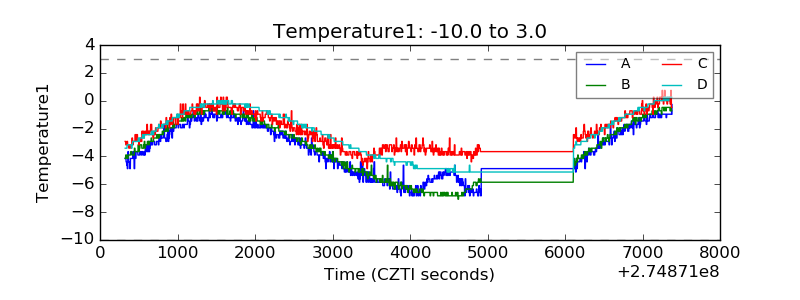 |
| Veto HV Monitor | 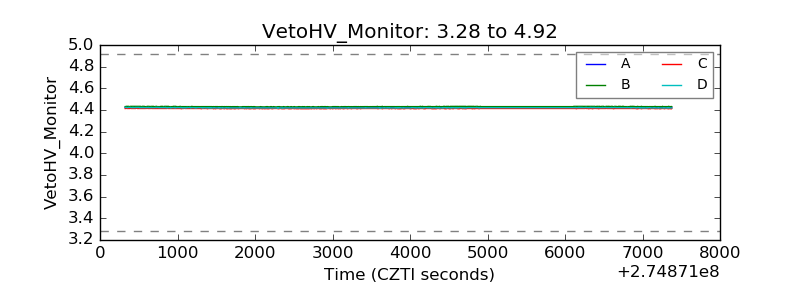 |
| Veto LLD | 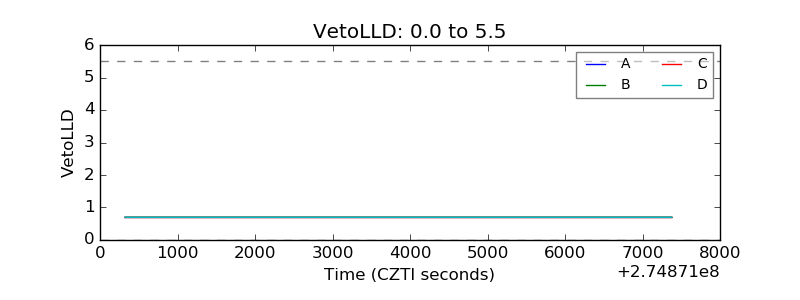 |
| Alpha Counter | 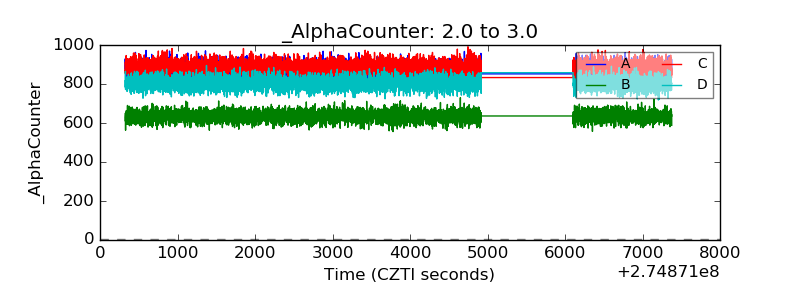 |
| _CPM_Rate |  |
| CZT Counter | 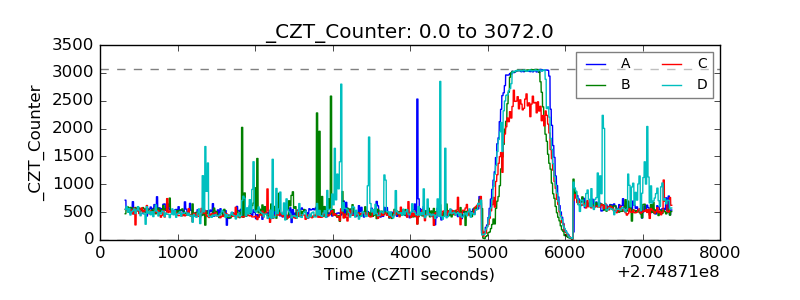 |
| +2.5 Volts monitor |  |
| +5 Volts monitor | 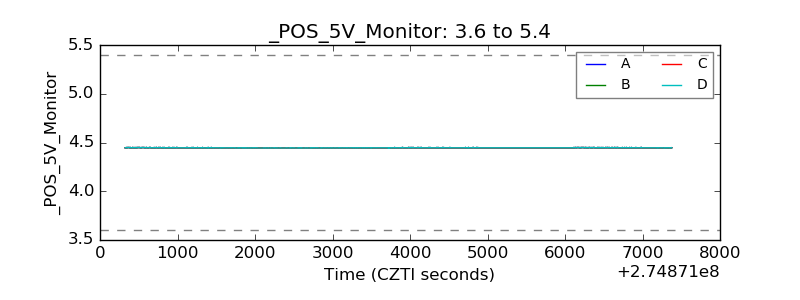 |
| _ROLL_ROT | 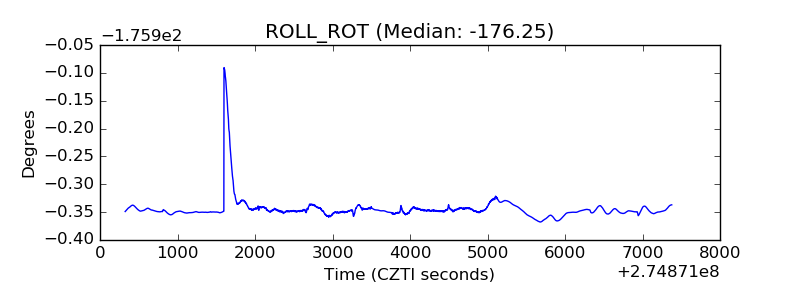 |
| _Roll_DEC | 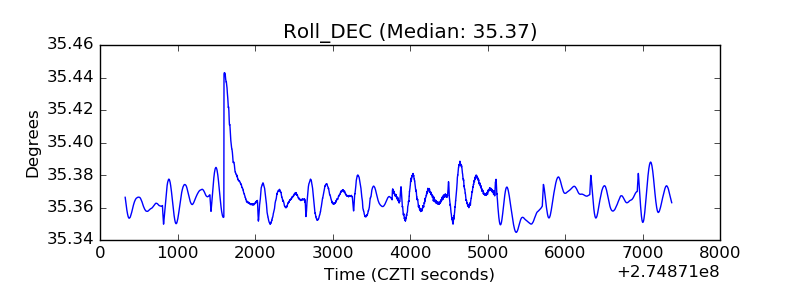 |
| _Roll_RA | 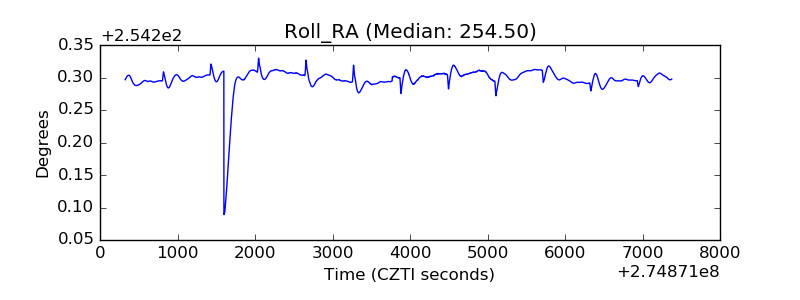 |
| Veto Counter | 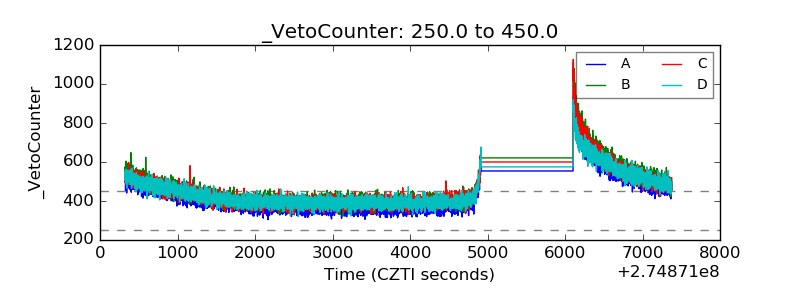 |