| Param | Original file | Final file |
|---|---|---|
| Filename | modeM0/AS1A04_230T01_9000002374_16065cztM0_level2.evt | modeM0/AS1A04_230T01_9000002374_16065cztM0_level2_quad_clean.evt |
| Size (bytes) | 498,931,200 | 112,273,920 |
| Size | 475.8 MB | 107.1 MB |
| Events in quadrant A | 3,565,265 | 767,272 |
| Events in quadrant B | 3,552,431 | 762,916 |
| Events in quadrant C | 3,225,080 | 714,754 |
| Events in quadrant D | 4,335,471 | 711,194 |
| Mode M9 | |||
|---|---|---|---|
| Quadrant | BADHDUFLAG | Total packets | Discarded packets |
| A | 0 | 12 | 0 |
| B | 0 | 12 | 0 |
| C | 0 | 12 | 0 |
| D | 0 | 12 | 0 |
| Mode SS | |||
|---|---|---|---|
| Quadrant | BADHDUFLAG | Total packets | Discarded packets |
| A | 0 | 130 | 0 |
| B | 0 | 130 | 0 |
| C | 0 | 130 | 0 |
| D | 0 | 130 | 0 |
| Mode M0 | |||
|---|---|---|---|
| Quadrant | BADHDUFLAG | Total packets | Discarded packets |
| A | 0 | 14791 | 2 |
| B | 0 | 14541 | 1 |
| C | 0 | 13501 | 1 |
| D | 0 | 17061 | 1 |
| Quadrant | Total seconds | Saturated seconds | Saturation percentage |
|---|---|---|---|
| A | 6367 | 82 | 1.287891% |
| B | 6367 | 89 | 1.397833% |
| C | 6367 | 90 | 1.413539% |
| D | 6367 | 155 | 2.434428% |
Noise dominated data is calculated using 1-second bins in cleaned event files. If a bin has >2000 counts, and if more than 50% of those come from <1% of pixels, then it is considered to be noise-dominated and hence unusable.
| Quadrant | # 1 sec bins | Bins with >0 counts | Bins with >2000 counts | High rate bins dominated by noise | Noise dominated (total time) | Noise dominated (detector-on time) | Marked lightcurve |
|---|---|---|---|---|---|---|---|
| A | 7618 | 6368 | 0 | 0 | 0.00% | 0.00% | 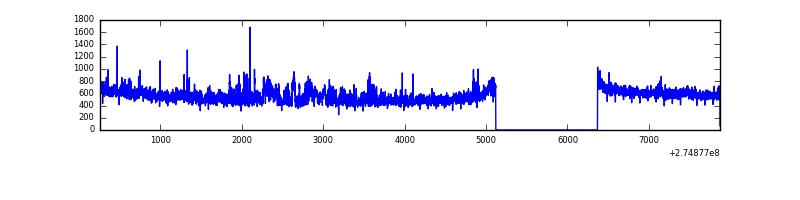 |
| B | 7618 | 6368 | 11 | 11 | 0.14% | 0.17% | 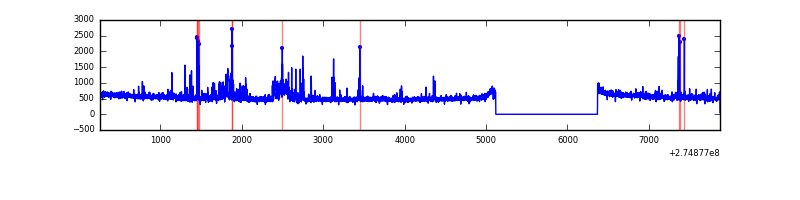 |
| C | 7618 | 6368 | 3 | 3 | 0.04% | 0.05% | 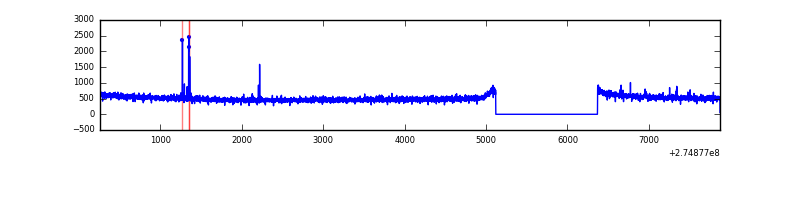 |
| D | 7618 | 6368 | 83 | 83 | 1.09% | 1.30% | 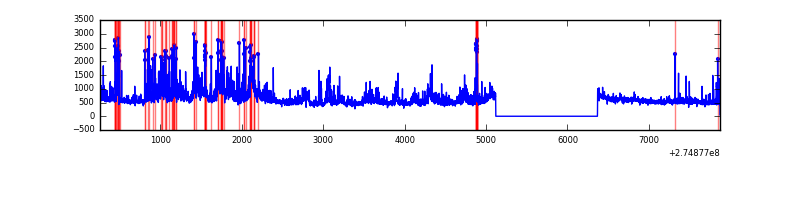 |
Top three noisy pixels from each quadrant. If the there are fewer than three noisy pixels in the level2.evt file, extra rows are filled as -1
| Pixel properties | Quadrant properties | ||||||
|---|---|---|---|---|---|---|---|
| Quadrant | DetID | PixID | Counts | Sigma | Mean | Median | Sigma |
| A | 3 | 80 | 304928 | 1809.58 | 840 | 825 | 168.1 |
| A | 9 | 143 | 22111 | 126.66 | 840 | 825 | 168.1 |
| A | 0 | 226 | 7838 | 41.73 | 840 | 825 | 168.1 |
| B | 7 | 220 | 108808 | 698.71 | 829 | 811 | 154.6 |
| B | 0 | 189 | 63130 | 403.19 | 829 | 811 | 154.6 |
| B | 0 | 229 | 27366 | 171.8 | 829 | 811 | 154.6 |
| C | 14 | 238 | 122309 | 665.54 | 787 | 792 | 182.6 |
| C | 0 | 207 | 24868 | 131.86 | 787 | 792 | 182.6 |
| C | 3 | 233 | 9690 | 48.73 | 787 | 792 | 182.6 |
| D | 1 | 52 | 749856 | 3780.88 | 810 | 787 | 198.1 |
| D | 12 | 218 | 374203 | 1884.79 | 810 | 787 | 198.1 |
| D | 13 | 232 | 78848 | 394.01 | 810 | 787 | 198.1 |
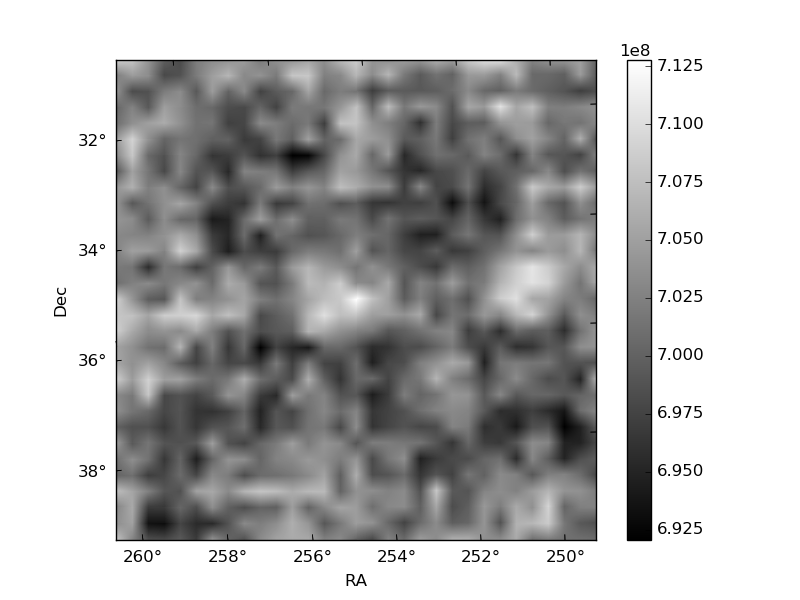
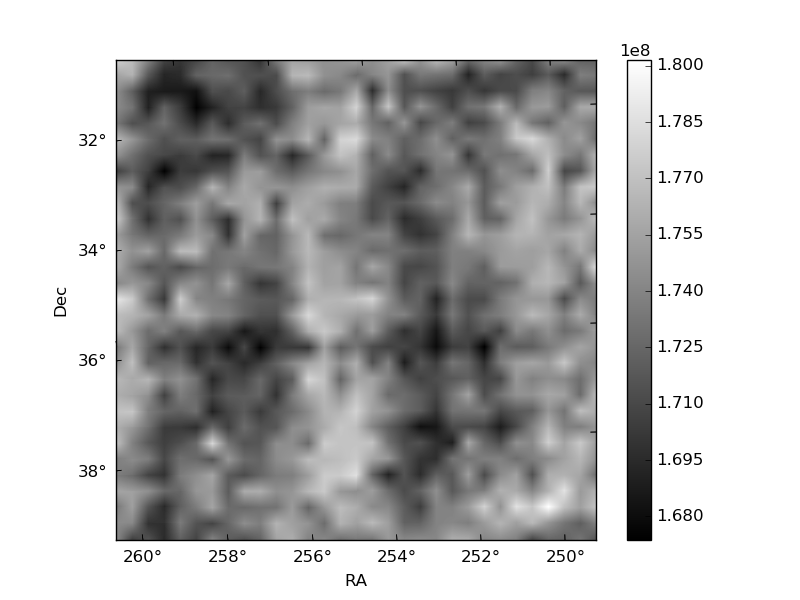
Histogram calculated using DETX and DETY for each event in the final _common_clean file
| Quadrant A | 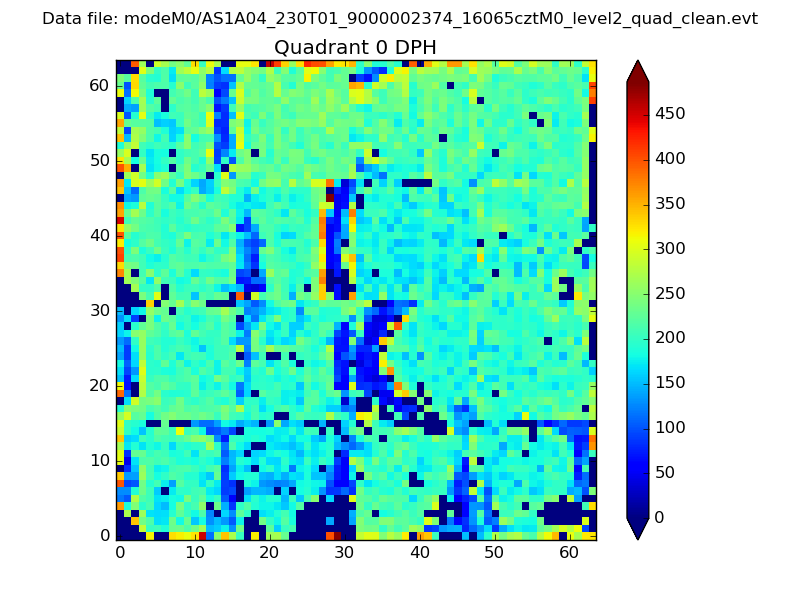 |
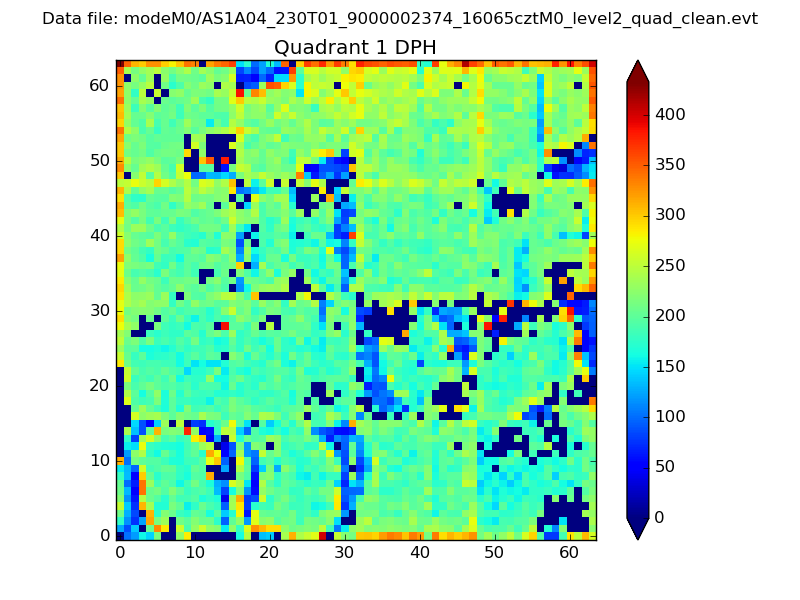 |
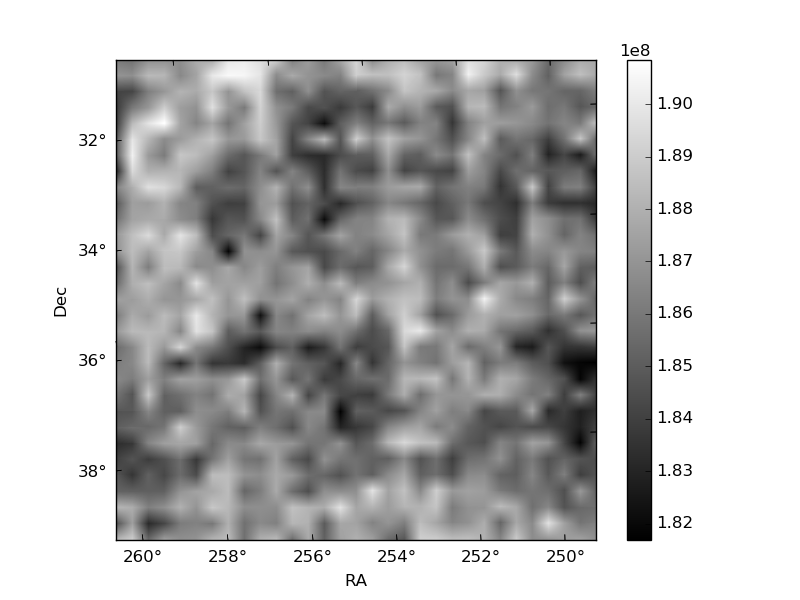
Quadrant B |
|---|---|---|---|
| Quadrant D | 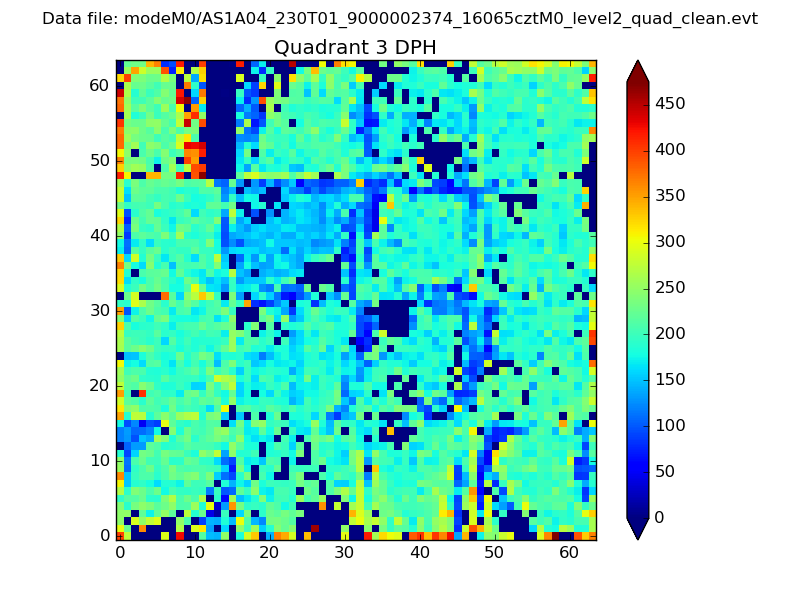 |
 |
Quadrant C |
| Plot type | Count rate plots | Images |
|---|---|---|
| Comparison with Poisson distribution Blue bars denote a histogram of data divided into 1 sec bins. Red curve is a Poisson curve with rate = median count rate of data. |
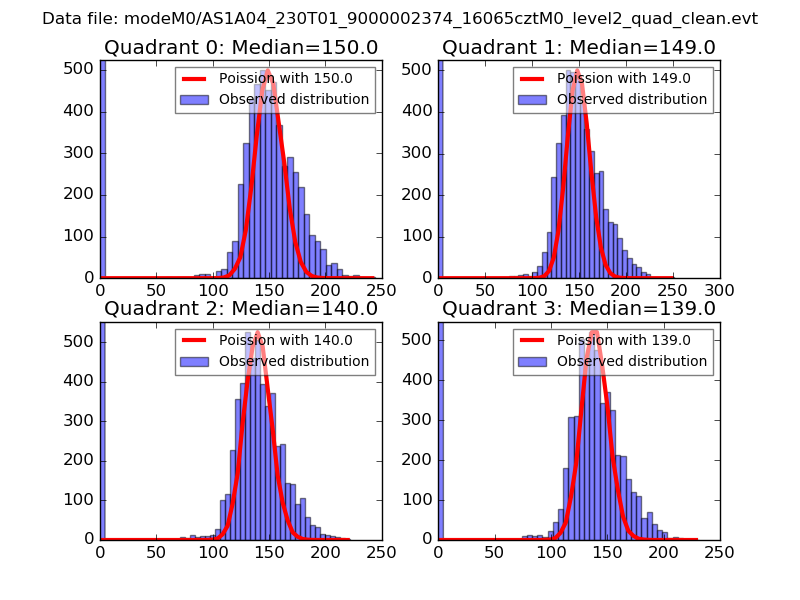 |
 |
| Quadrant-wise count rates Data is divided into 100 sec bins |
 |
|
| Module-wise count rates for Quadrant A Data is divided into 100 sec bins |
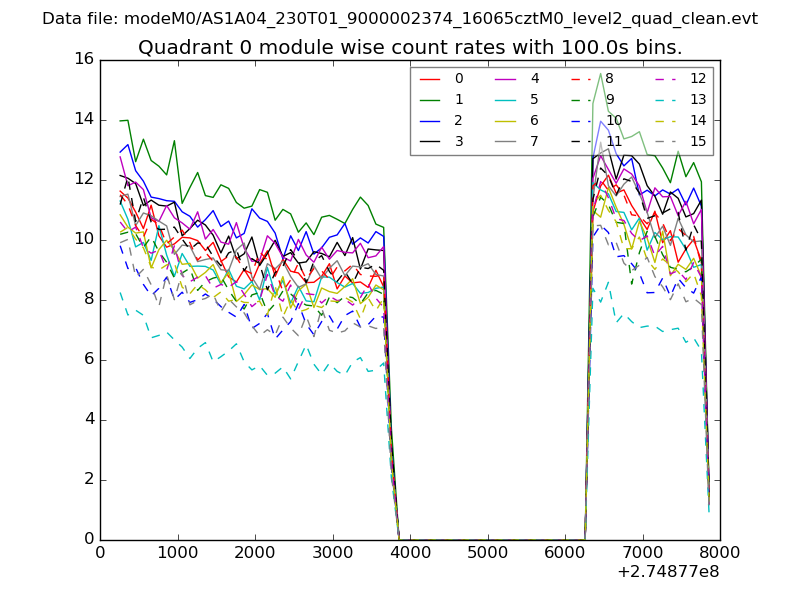 |
 |
| Module-wise count rates for Quadrant B Data is divided into 100 sec bins |
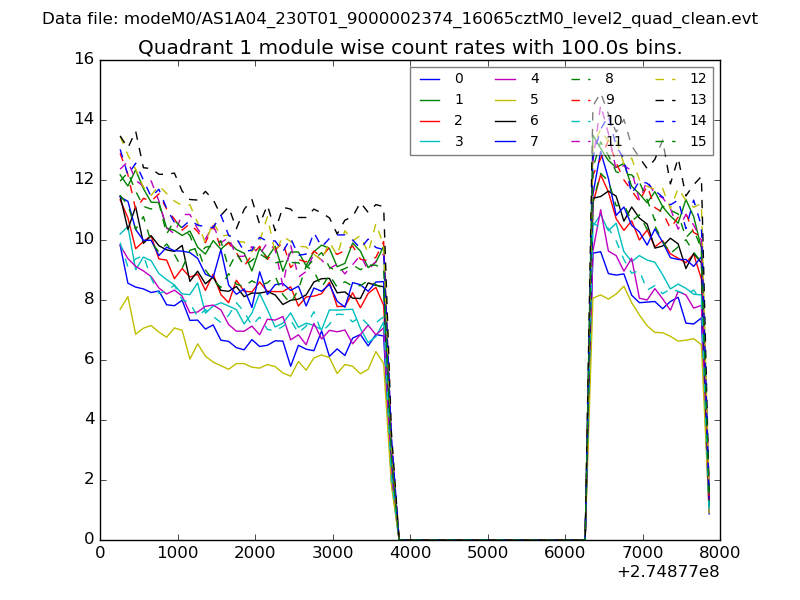 |
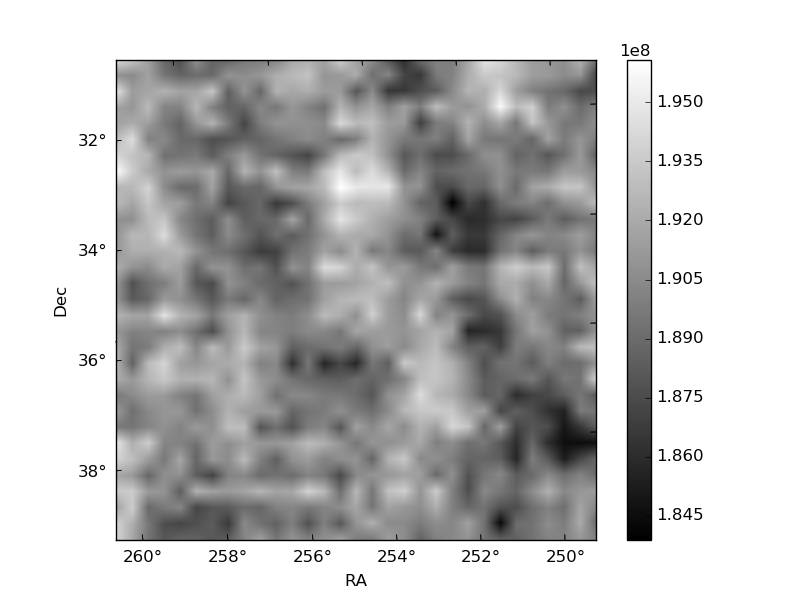 |
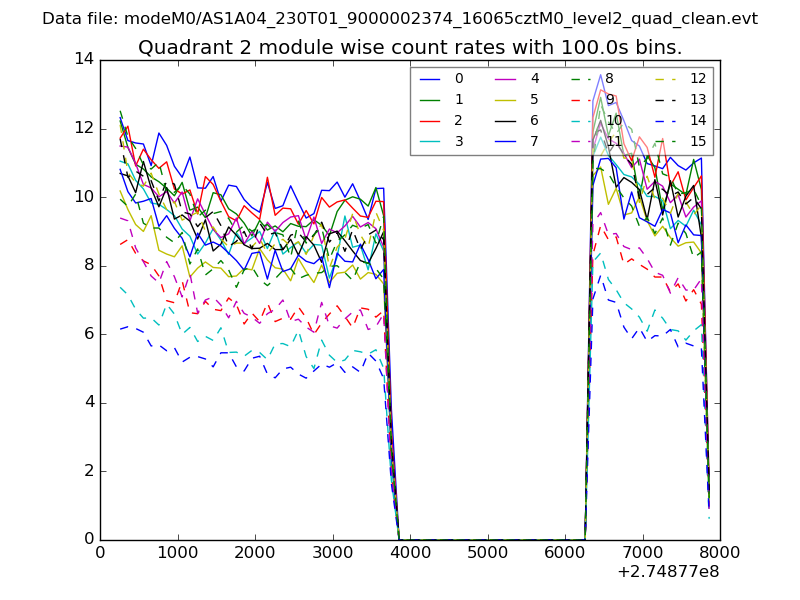
| Module-wise count rates for Quadrant C Data is divided into 100 sec bins |
 |
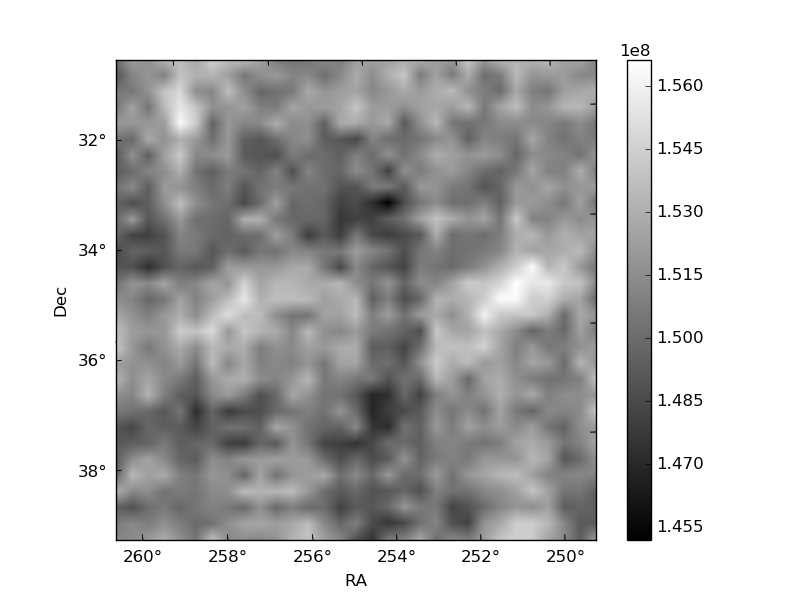 |
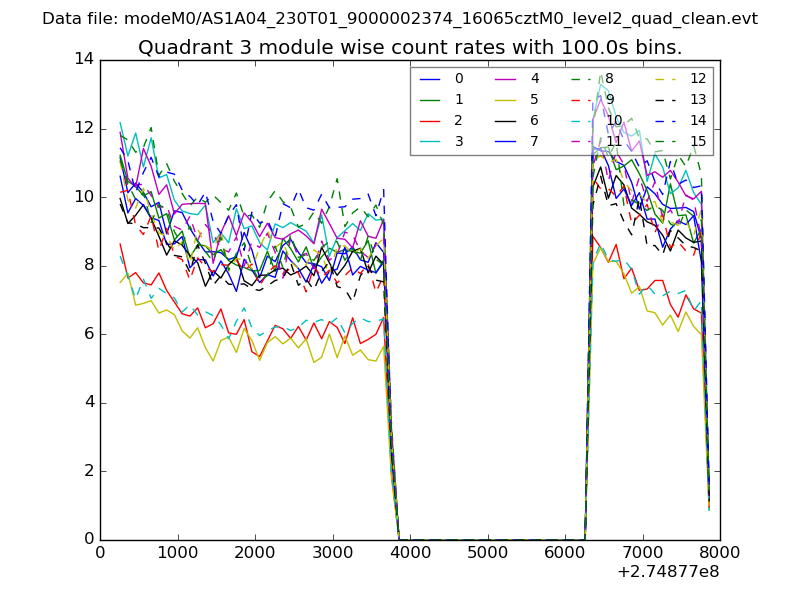
| Module-wise count rates for Quadrant D Data is divided into 100 sec bins |
 |
 |
| Parameter | Plot |
|---|---|
| CZT HV Monitor | 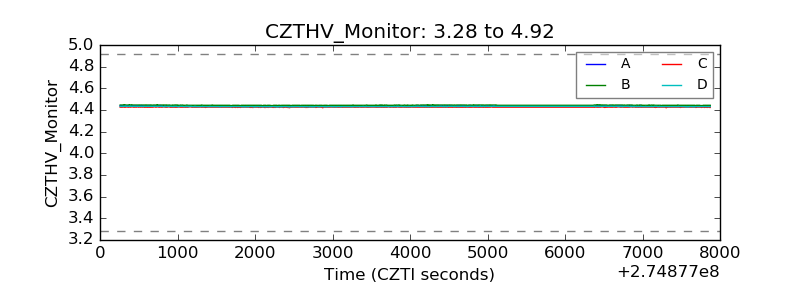 |
| D_VDD | 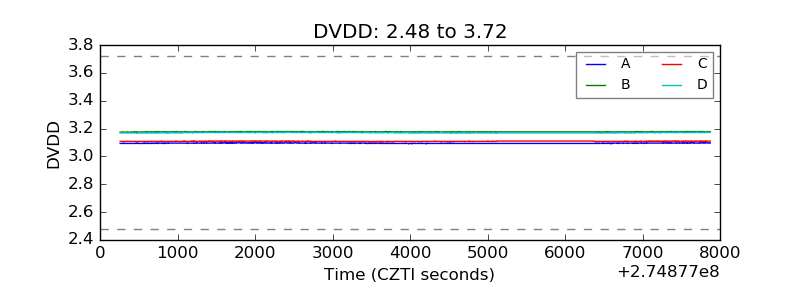 |
| Temperature 1 | 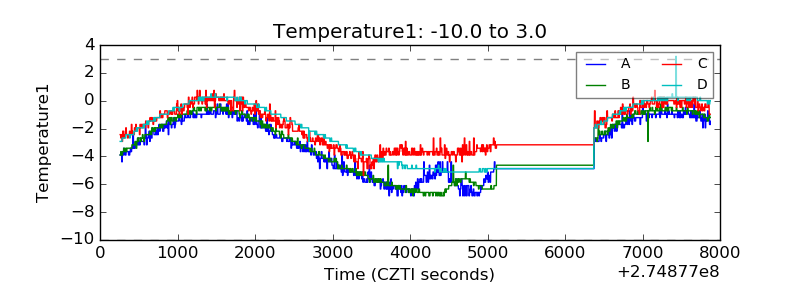 |
| Veto HV Monitor |  |
| Veto LLD | 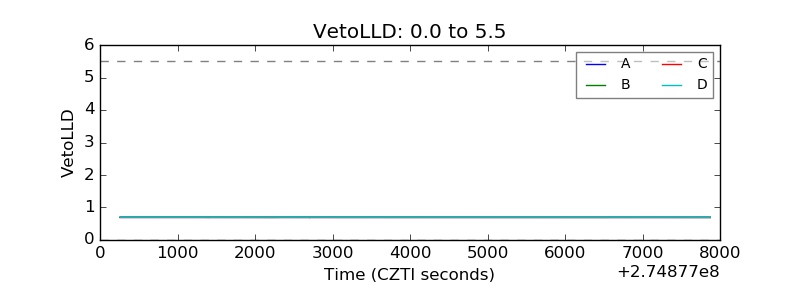 |
| Alpha Counter | 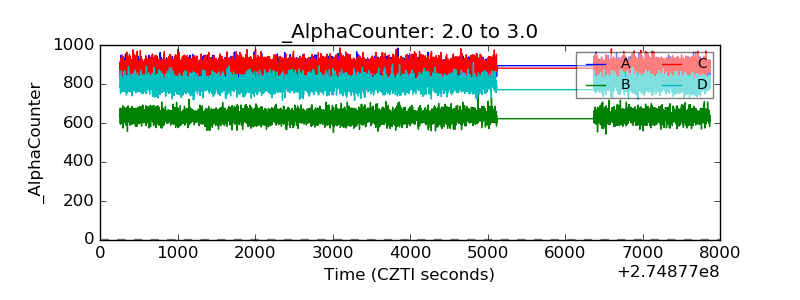 |
| _CPM_Rate |  |
| CZT Counter | 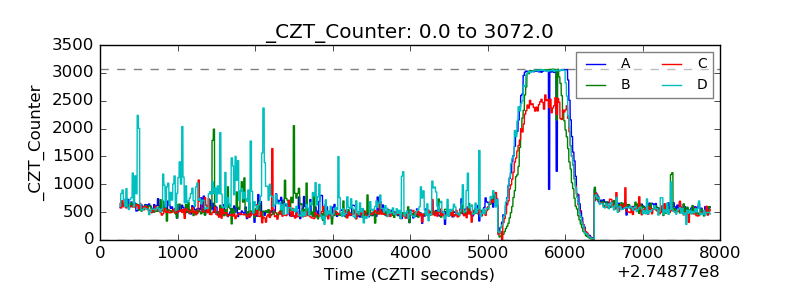 |
| +2.5 Volts monitor | 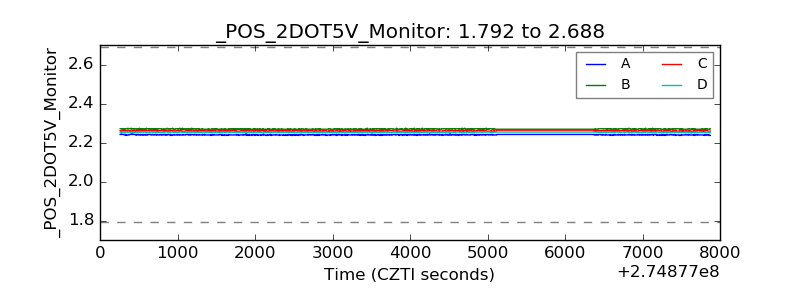 |
| +5 Volts monitor |  |
| _ROLL_ROT | 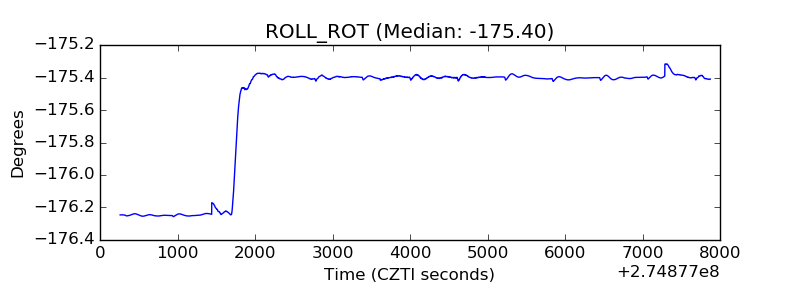 |
| _Roll_DEC | 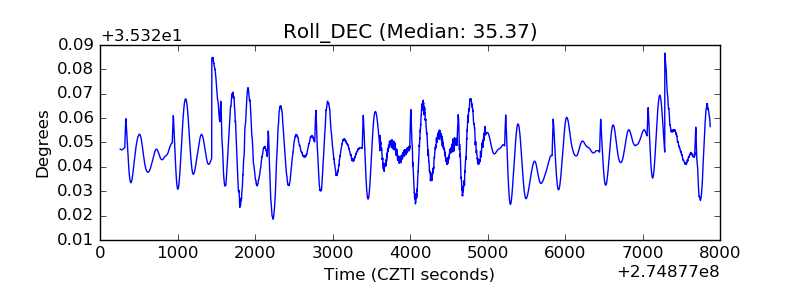 |
| _Roll_RA | 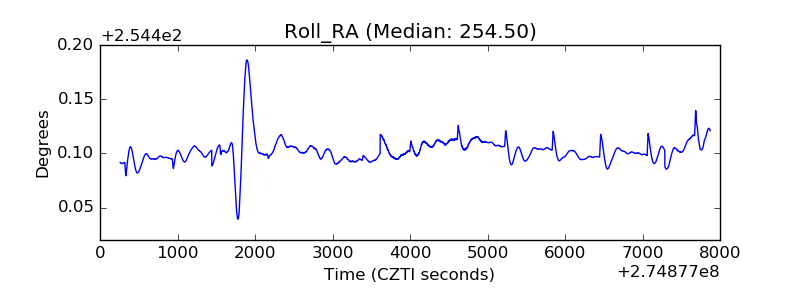 |
| Veto Counter | 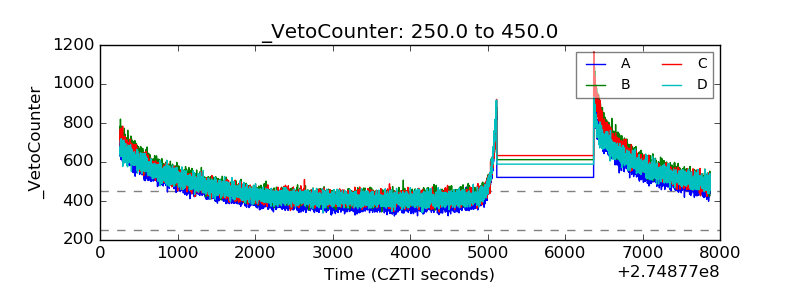 |