| Param | Original file | Final file |
|---|---|---|
| Filename | modeM0/AS1A04_230T01_9000002374_16066cztM0_level2.evt | modeM0/AS1A04_230T01_9000002374_16066cztM0_level2_quad_clean.evt |
| Size (bytes) | 457,277,760 | 98,493,120 |
| Size | 436.1 MB | 93.9 MB |
| Events in quadrant A | 3,316,996 | 666,135 |
| Events in quadrant B | 3,403,927 | 659,464 |
| Events in quadrant C | 3,055,229 | 620,860 |
| Events in quadrant D | 3,663,454 | 615,686 |
| Mode M9 | |||
|---|---|---|---|
| Quadrant | BADHDUFLAG | Total packets | Discarded packets |
| A | 0 | 13 | 0 |
| B | 0 | 13 | 0 |
| C | 0 | 13 | 0 |
| D | 0 | 13 | 0 |
| Mode SS | |||
|---|---|---|---|
| Quadrant | BADHDUFLAG | Total packets | Discarded packets |
| A | 0 | 122 | 0 |
| B | 0 | 122 | 0 |
| C | 0 | 122 | 0 |
| D | 0 | 122 | 0 |
| Mode M0 | |||
|---|---|---|---|
| Quadrant | BADHDUFLAG | Total packets | Discarded packets |
| A | 0 | 13498 | 2 |
| B | 0 | 13893 | 1 |
| C | 0 | 12636 | 1 |
| D | 0 | 14783 | 1 |
| Quadrant | Total seconds | Saturated seconds | Saturation percentage |
|---|---|---|---|
| A | 6025 | 89 | 1.477178% |
| B | 6025 | 118 | 1.958506% |
| C | 6025 | 97 | 1.609959% |
| D | 6025 | 226 | 3.751037% |
Noise dominated data is calculated using 1-second bins in cleaned event files. If a bin has >2000 counts, and if more than 50% of those come from <1% of pixels, then it is considered to be noise-dominated and hence unusable.
| Quadrant | # 1 sec bins | Bins with >0 counts | Bins with >2000 counts | High rate bins dominated by noise | Noise dominated (total time) | Noise dominated (detector-on time) | Marked lightcurve |
|---|---|---|---|---|---|---|---|
| A | 7321 | 6026 | 0 | 0 | 0.00% | 0.00% | 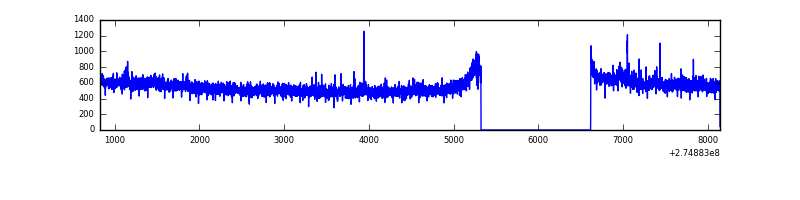 |
| B | 7321 | 6026 | 23 | 23 | 0.31% | 0.38% | 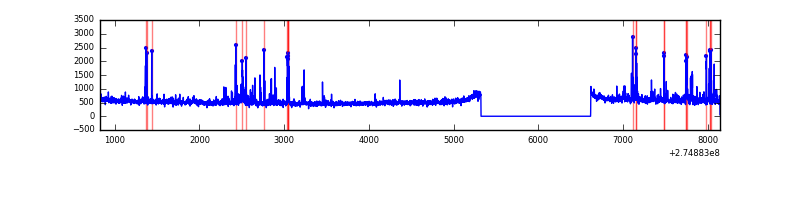 |
| C | 7321 | 6026 | 0 | 0 | 0.00% | 0.00% | 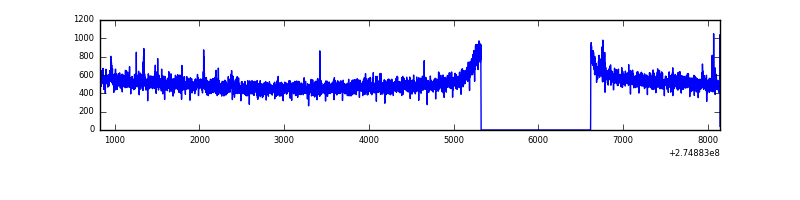 |
| D | 7320 | 6025 | 117 | 117 | 1.60% | 1.94% | 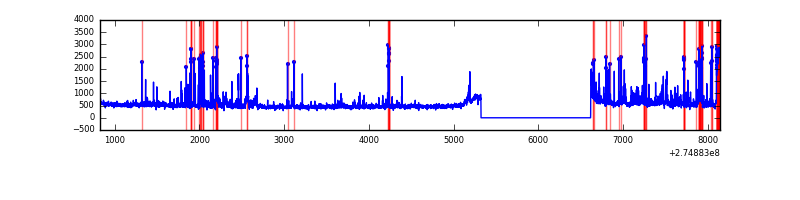 |
Top three noisy pixels from each quadrant. If the there are fewer than three noisy pixels in the level2.evt file, extra rows are filled as -1
| Pixel properties | Quadrant properties | ||||||
|---|---|---|---|---|---|---|---|
| Quadrant | DetID | PixID | Counts | Sigma | Mean | Median | Sigma |
| A | 3 | 80 | 274557 | 1751.2 | 786 | 771 | 156.3 |
| A | 9 | 143 | 10948 | 65.09 | 786 | 771 | 156.3 |
| A | 0 | 226 | 7169 | 40.92 | 786 | 771 | 156.3 |
| B | 7 | 220 | 129454 | 890.11 | 778 | 762 | 144.6 |
| B | 0 | 189 | 56736 | 387.15 | 778 | 762 | 144.6 |
| B | 0 | 190 | 37823 | 256.33 | 778 | 762 | 144.6 |
| C | 14 | 238 | 115931 | 669.6 | 742 | 749 | 172.0 |
| C | 3 | 233 | 27599 | 156.09 | 742 | 749 | 172.0 |
| C | 0 | 207 | 16357 | 90.74 | 742 | 749 | 172.0 |
| D | 7 | 38 | 286154 | 1544.88 | 759 | 738 | 184.7 |
| D | 1 | 52 | 178648 | 962.98 | 759 | 738 | 184.7 |
| D | 12 | 218 | 149020 | 802.61 | 759 | 738 | 184.7 |
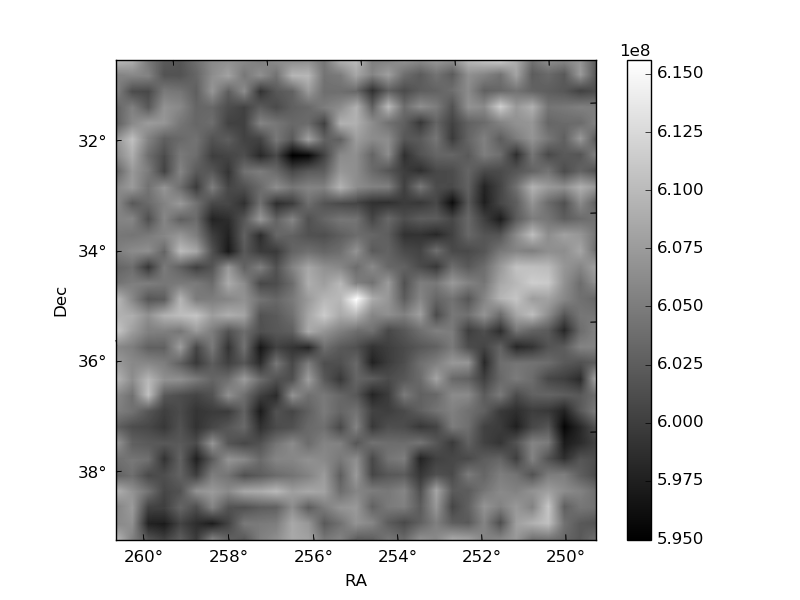
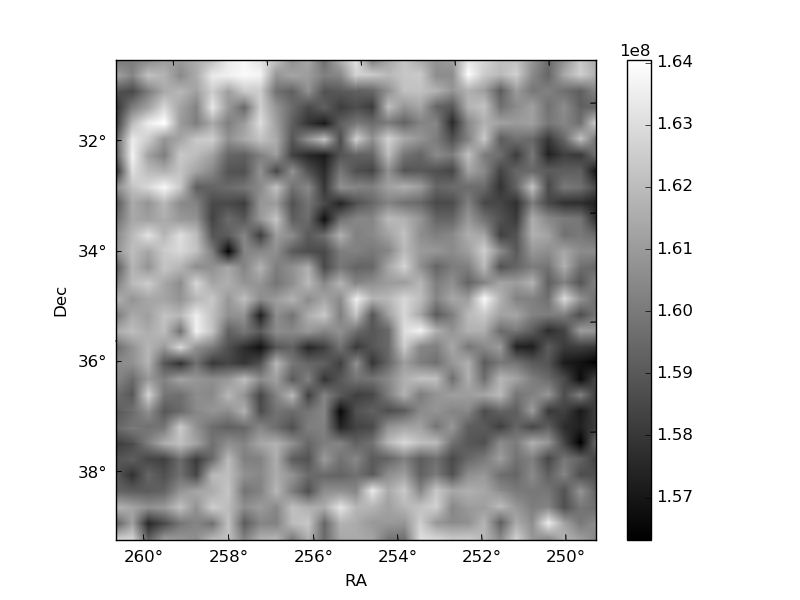
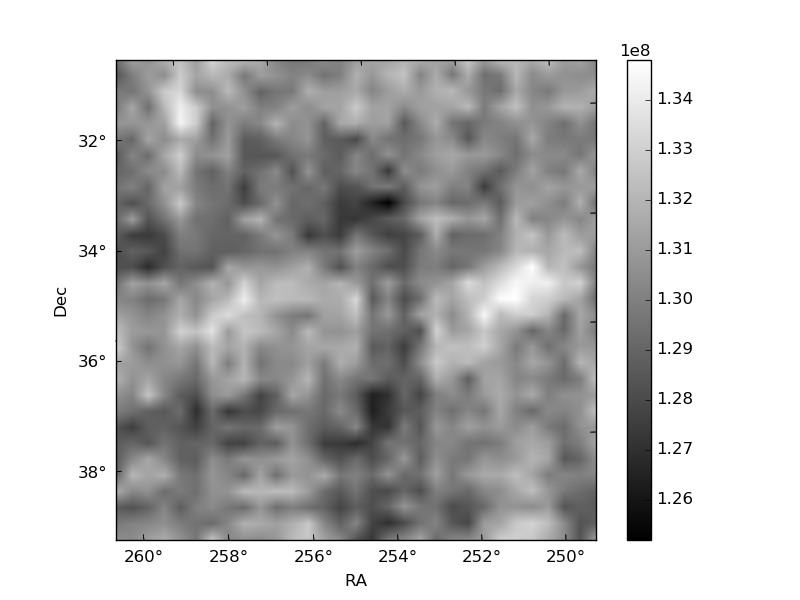
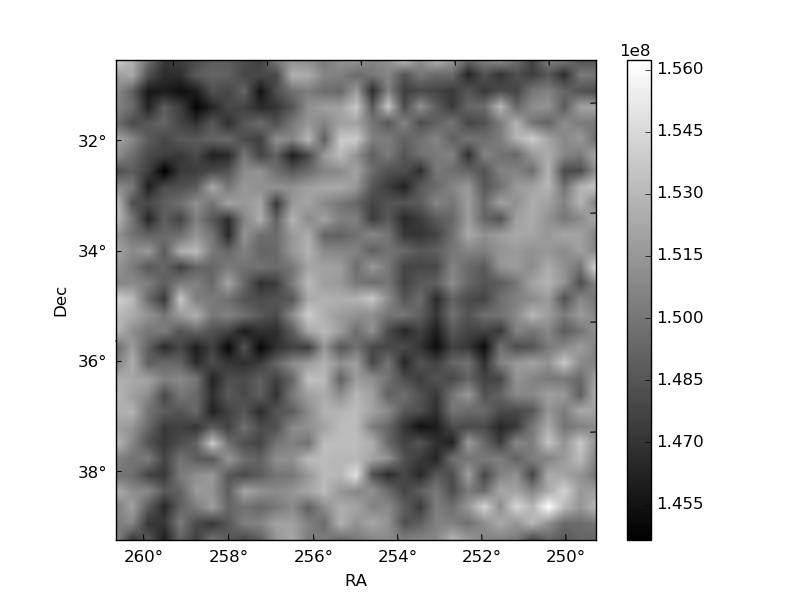
Histogram calculated using DETX and DETY for each event in the final _common_clean file
| Quadrant A | 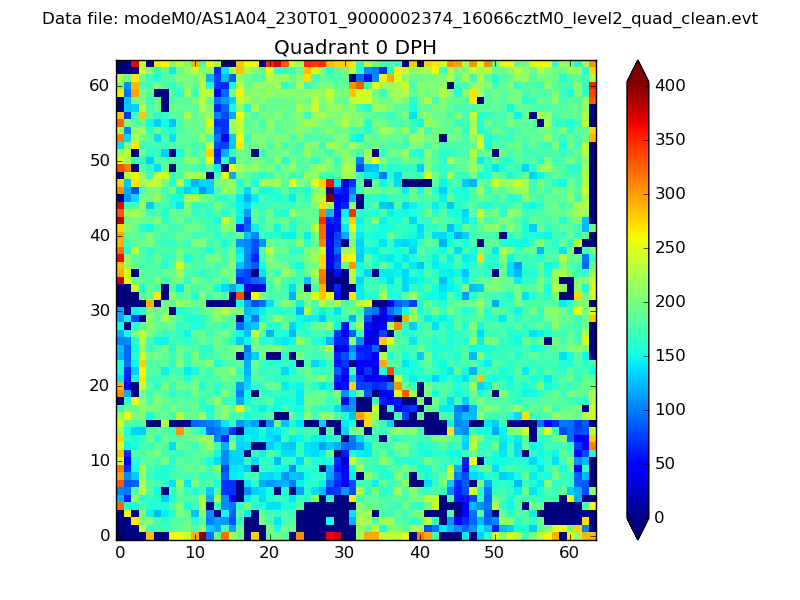 |
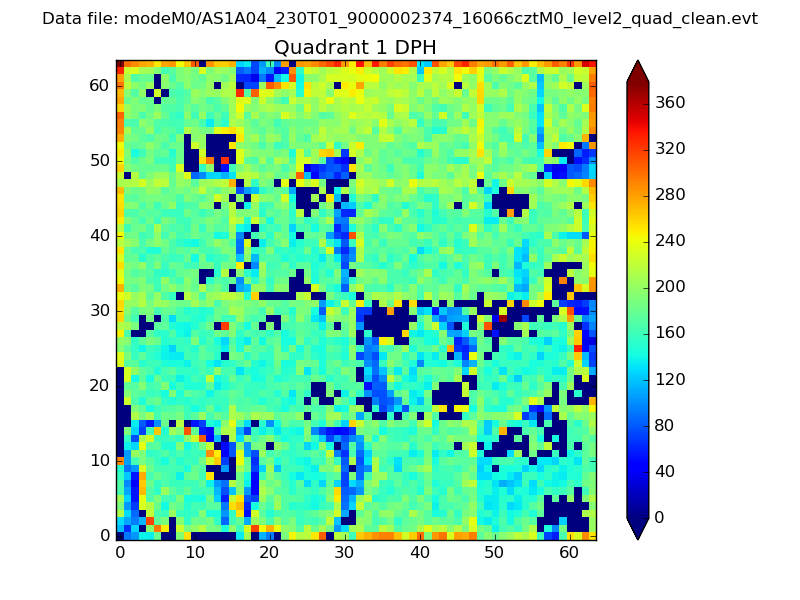 |
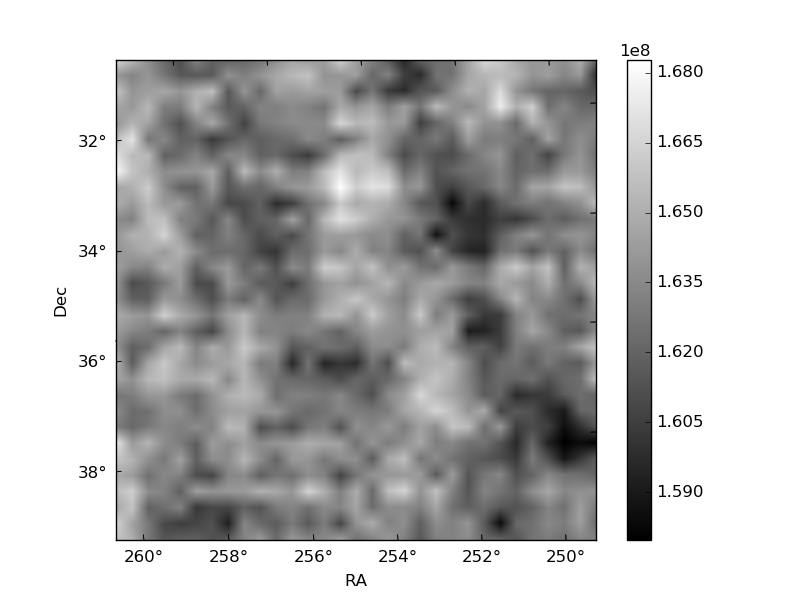
Quadrant B |
|---|---|---|---|
| Quadrant D | 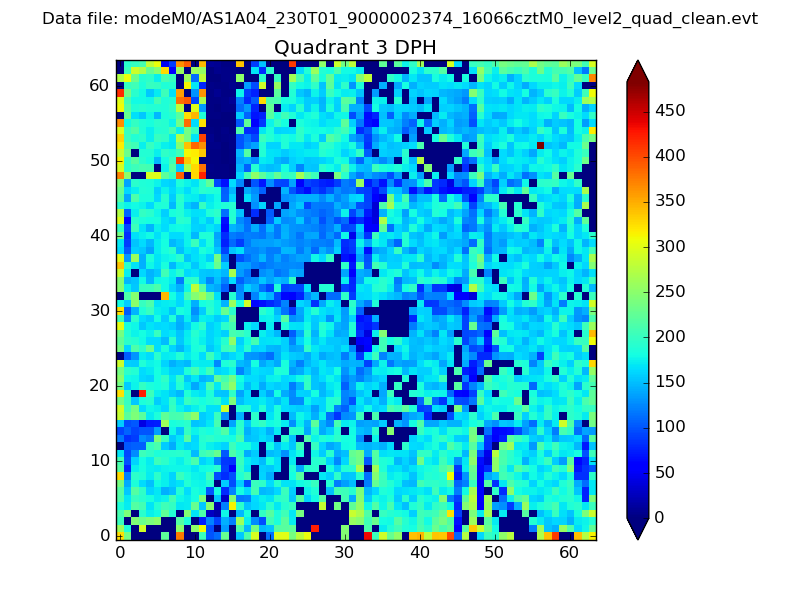 |
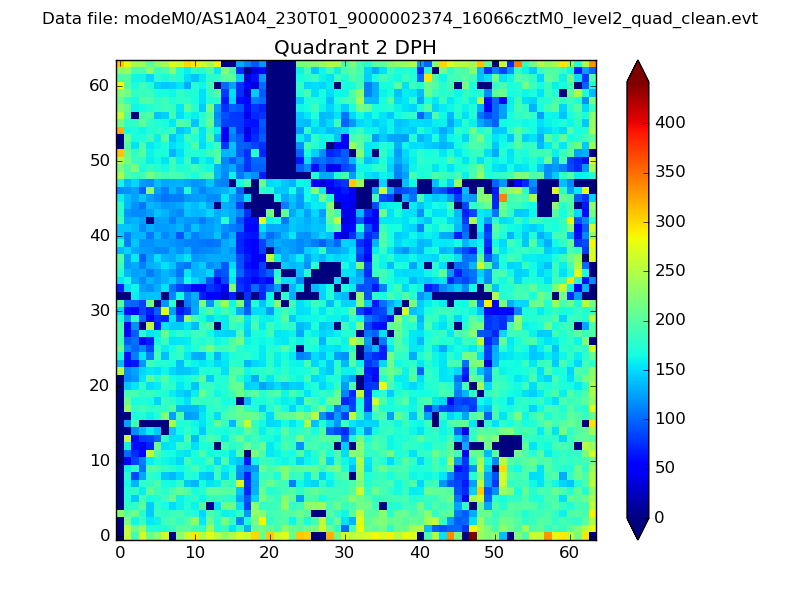 |
Quadrant C |
| Plot type | Count rate plots | Images |
|---|---|---|
| Comparison with Poisson distribution Blue bars denote a histogram of data divided into 1 sec bins. Red curve is a Poisson curve with rate = median count rate of data. |
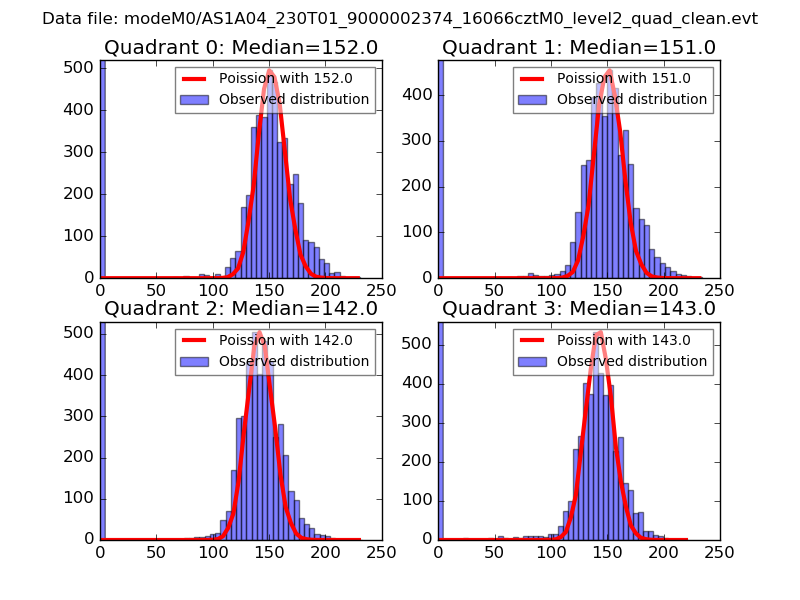 |
 |
| Quadrant-wise count rates Data is divided into 100 sec bins |
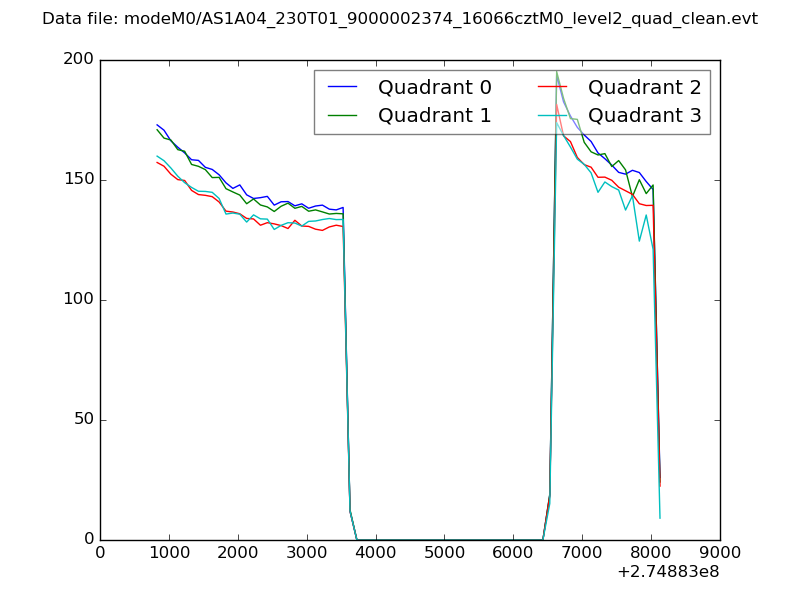 |
|
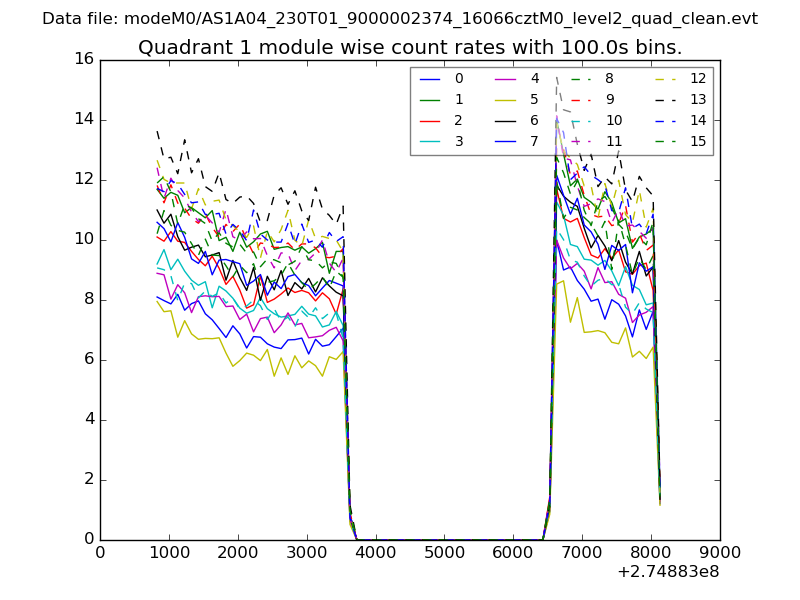
| Module-wise count rates for Quadrant A Data is divided into 100 sec bins |
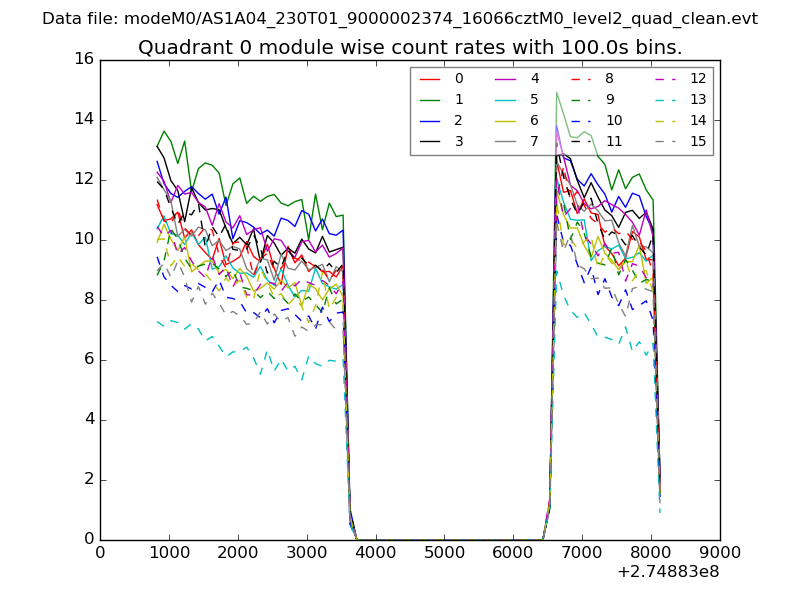 |
 |
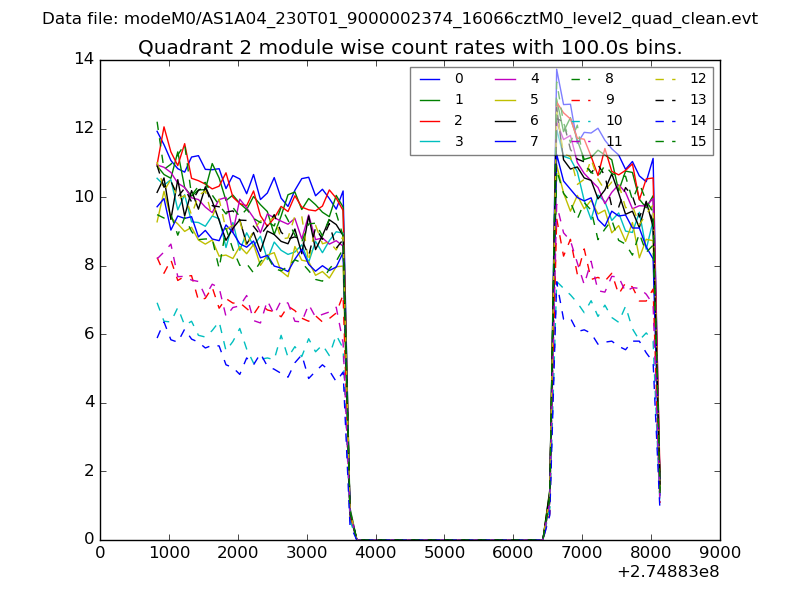
| Module-wise count rates for Quadrant B Data is divided into 100 sec bins |
 |
 |
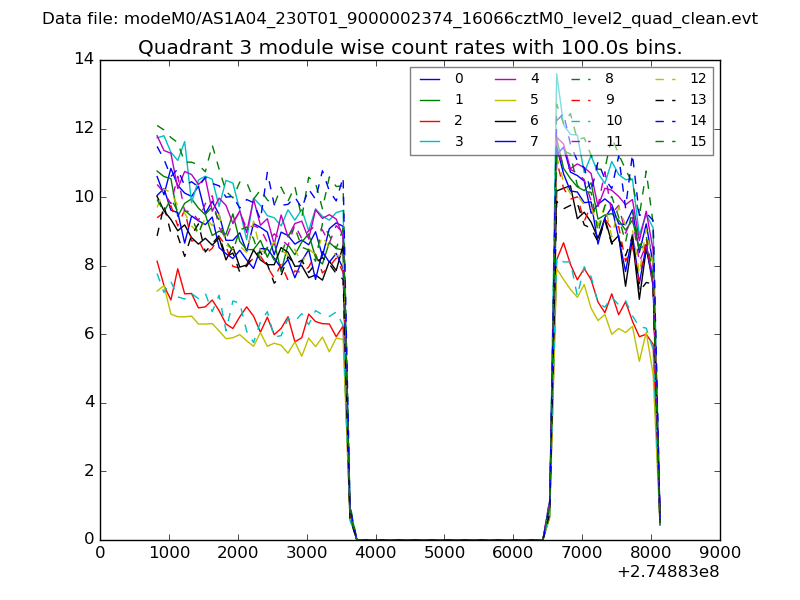
| Module-wise count rates for Quadrant C Data is divided into 100 sec bins |
 |
 |
| Module-wise count rates for Quadrant D Data is divided into 100 sec bins |
 |
 |
| Parameter | Plot |
|---|---|
| CZT HV Monitor | 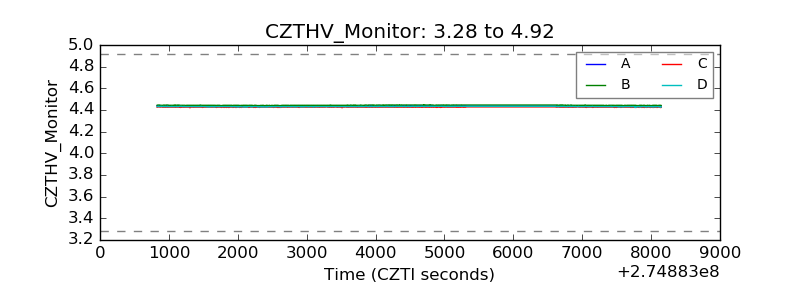 |
| D_VDD | 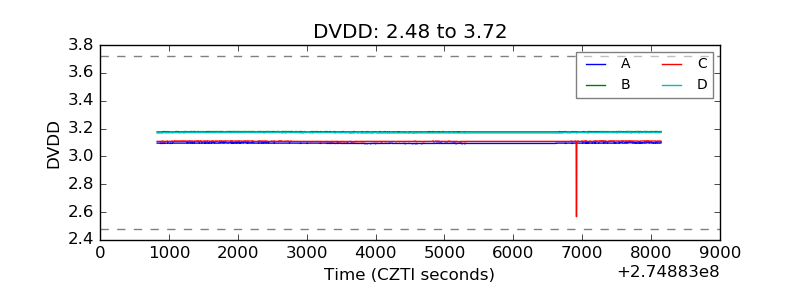 |
| Temperature 1 | 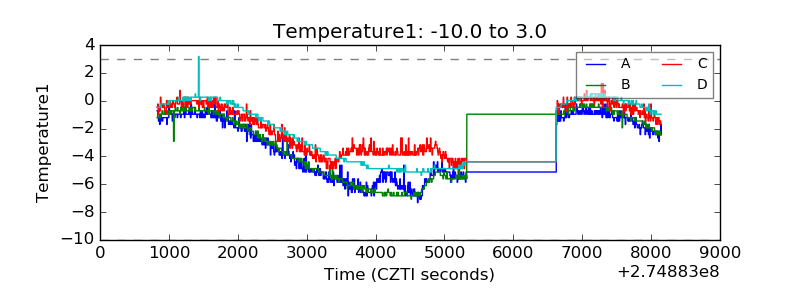 |
| Veto HV Monitor |  |
| Veto LLD | 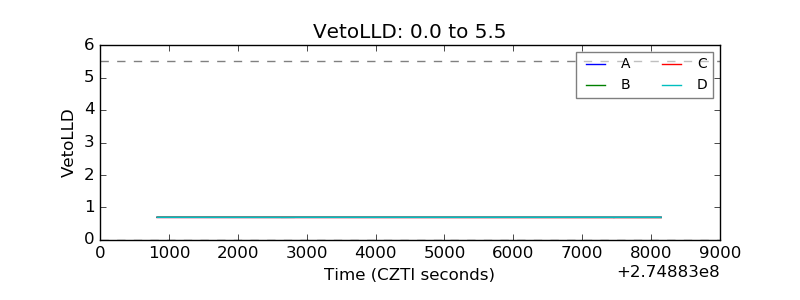 |
| Alpha Counter | 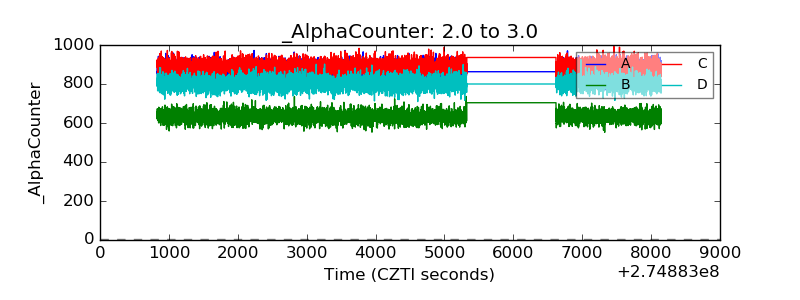 |
| _CPM_Rate | 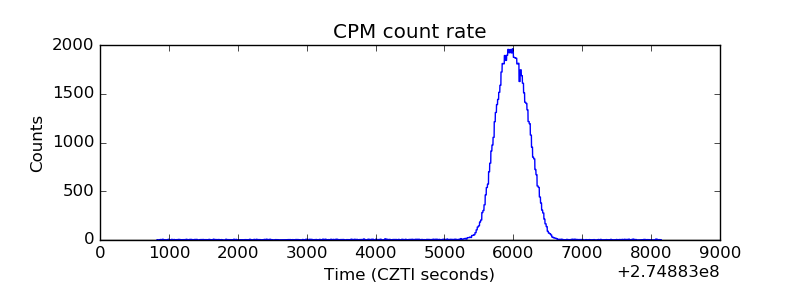 |
| CZT Counter | 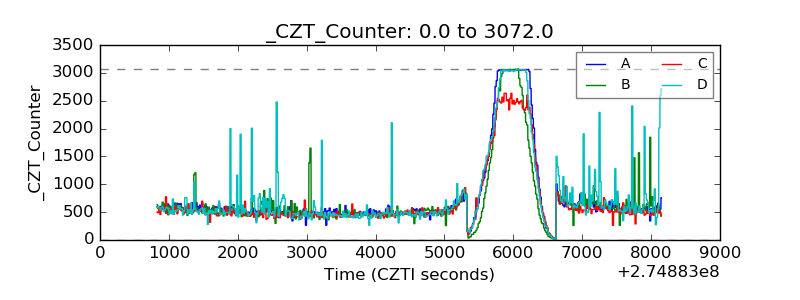 |
| +2.5 Volts monitor |  |
| +5 Volts monitor |  |
| _ROLL_ROT | 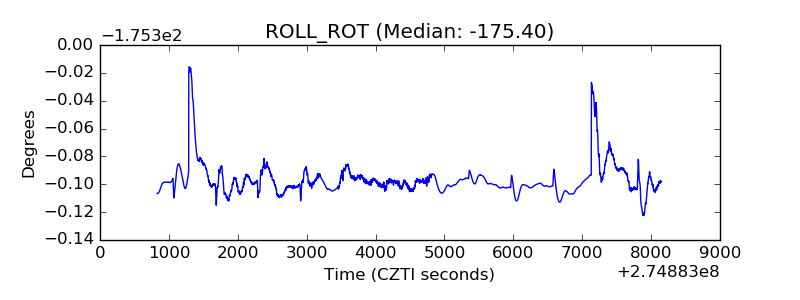 |
| _Roll_DEC | 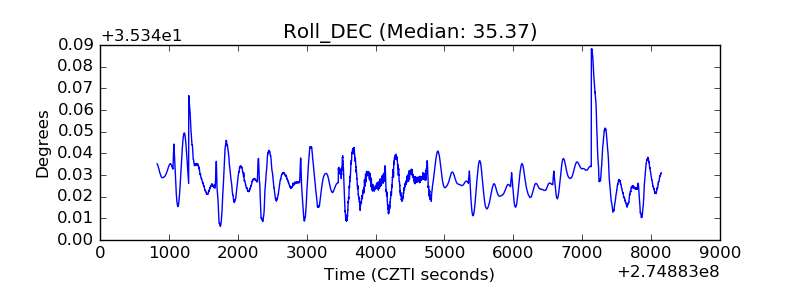 |
| _Roll_RA | 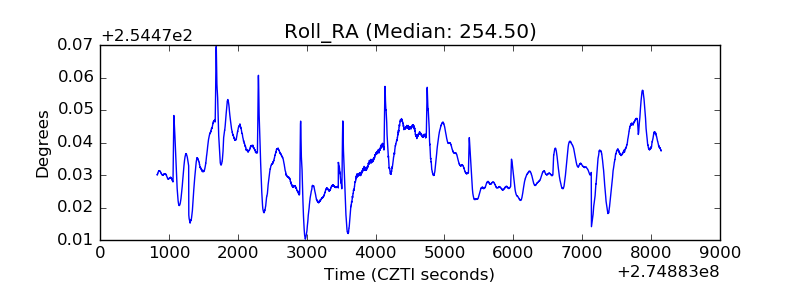 |
| Veto Counter | 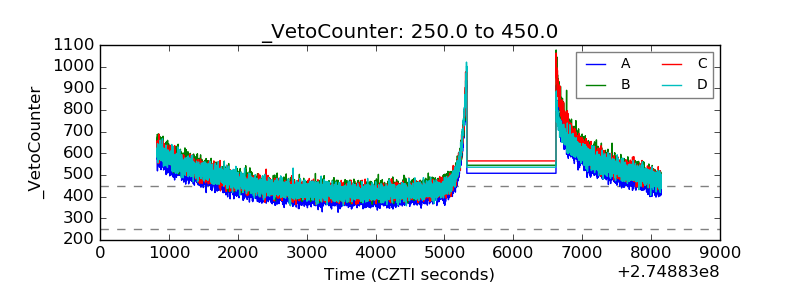 |