| Param | Original file | Final file |
|---|---|---|
| Filename | modeM0/AS1A04_230T01_9000002374_16068cztM0_level2.evt | modeM0/AS1A04_230T01_9000002374_16068cztM0_level2_quad_clean.evt |
| Size (bytes) | 462,303,360 | 81,302,400 |
| Size | 440.9 MB | 77.5 MB |
| Events in quadrant A | 3,567,383 | 525,098 |
| Events in quadrant B | 3,617,316 | 523,931 |
| Events in quadrant C | 2,908,484 | 505,489 |
| Events in quadrant D | 3,506,586 | 494,681 |
| Mode M9 | |||
|---|---|---|---|
| Quadrant | BADHDUFLAG | Total packets | Discarded packets |
| A | 0 | 12 | 0 |
| B | 0 | 12 | 0 |
| C | 0 | 12 | 0 |
| D | 0 | 12 | 0 |
| Mode SS | |||
|---|---|---|---|
| Quadrant | BADHDUFLAG | Total packets | Discarded packets |
| A | 0 | 120 | 0 |
| B | 0 | 120 | 0 |
| C | 0 | 120 | 0 |
| D | 0 | 120 | 0 |
| Mode M0 | |||
|---|---|---|---|
| Quadrant | BADHDUFLAG | Total packets | Discarded packets |
| A | 0 | 14341 | 2 |
| B | 0 | 14622 | 1 |
| C | 0 | 12341 | 1 |
| D | 0 | 14425 | 1 |
| Quadrant | Total seconds | Saturated seconds | Saturation percentage |
|---|---|---|---|
| A | 5908 | 40 | 0.677048% |
| B | 5908 | 124 | 2.098849% |
| C | 5908 | 51 | 0.863236% |
| D | 5908 | 151 | 2.555856% |
Noise dominated data is calculated using 1-second bins in cleaned event files. If a bin has >2000 counts, and if more than 50% of those come from <1% of pixels, then it is considered to be noise-dominated and hence unusable.
| Quadrant | # 1 sec bins | Bins with >0 counts | Bins with >2000 counts | High rate bins dominated by noise | Noise dominated (total time) | Noise dominated (detector-on time) | Marked lightcurve |
|---|---|---|---|---|---|---|---|
| A | 7124 | 5910 | 11 | 11 | 0.15% | 0.19% | 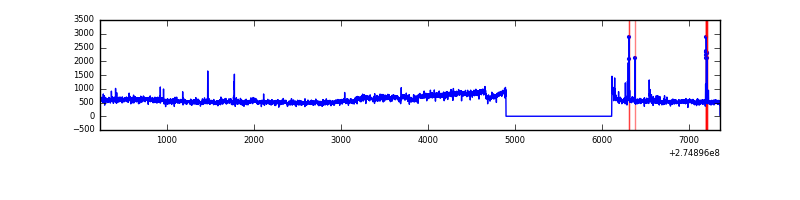 |
| B | 7124 | 5910 | 54 | 54 | 0.76% | 0.91% | 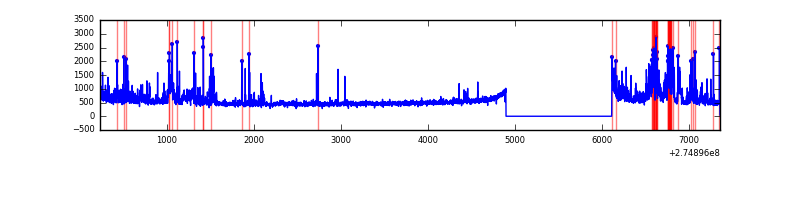 |
| C | 7124 | 5910 | 4 | 4 | 0.06% | 0.07% | 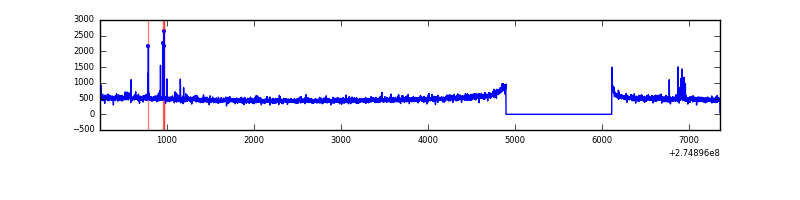 |
| D | 7124 | 5910 | 114 | 114 | 1.60% | 1.93% | 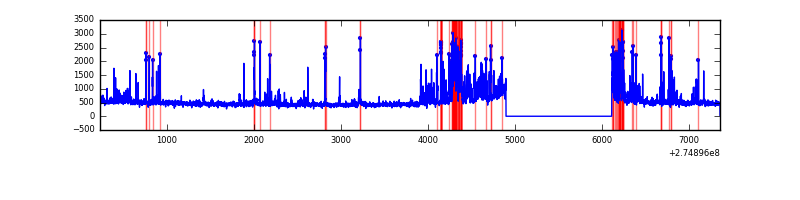 |
Top three noisy pixels from each quadrant. If the there are fewer than three noisy pixels in the level2.evt file, extra rows are filled as -1
| Pixel properties | Quadrant properties | ||||||
|---|---|---|---|---|---|---|---|
| Quadrant | DetID | PixID | Counts | Sigma | Mean | Median | Sigma |
| A | 13 | 210 | 464928 | 3148.72 | 725 | 710 | 147.4 |
| A | 3 | 80 | 251078 | 1698.21 | 725 | 710 | 147.4 |
| A | 15 | 239 | 52224 | 349.41 | 725 | 710 | 147.4 |
| B | 0 | 189 | 347709 | 2546.73 | 728 | 711 | 136.3 |
| B | 7 | 220 | 182927 | 1337.34 | 728 | 711 | 136.3 |
| B | 4 | 216 | 87585 | 637.6 | 728 | 711 | 136.3 |
| C | 14 | 238 | 106381 | 638.67 | 702 | 708 | 165.5 |
| C | 0 | 207 | 34243 | 202.68 | 702 | 708 | 165.5 |
| C | 7 | 247 | 12386 | 70.58 | 702 | 708 | 165.5 |
| D | 12 | 218 | 608486 | 3509.63 | 706 | 686 | 173.2 |
| D | 1 | 52 | 69833 | 399.28 | 706 | 686 | 173.2 |
| D | 13 | 232 | 34538 | 195.47 | 706 | 686 | 173.2 |
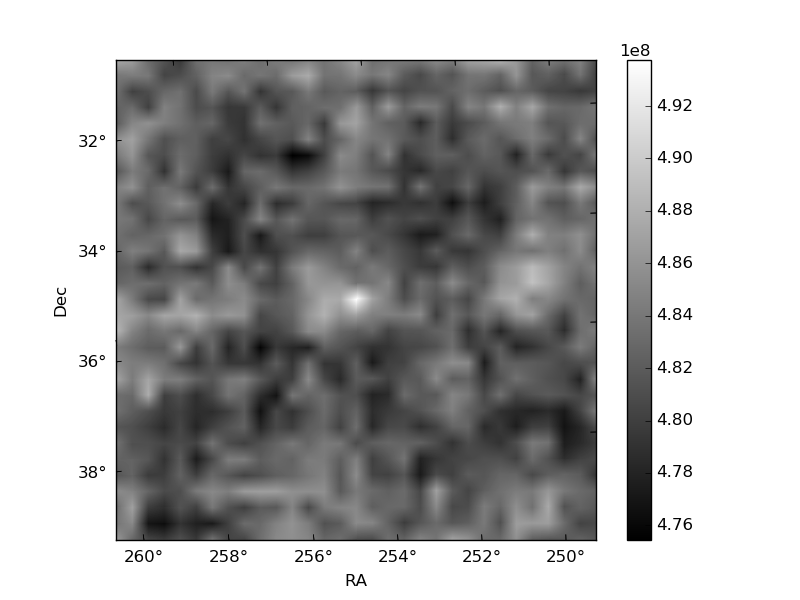
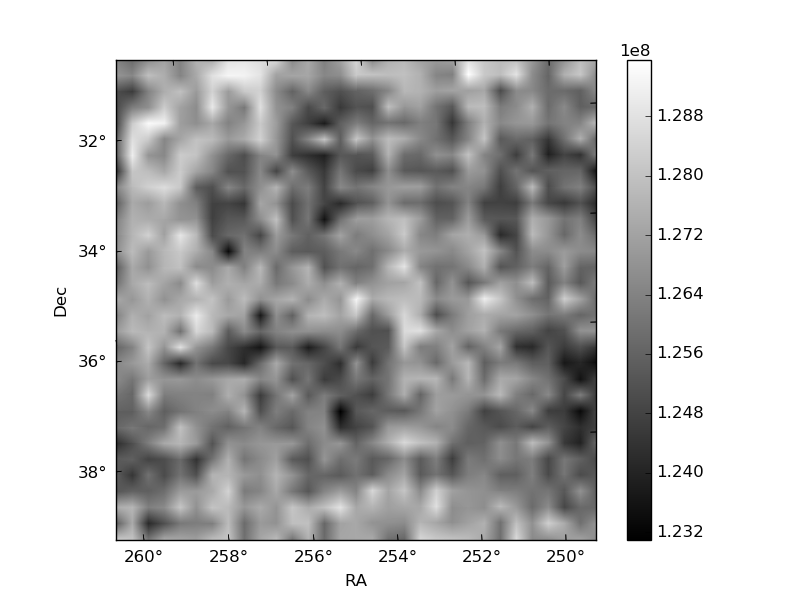
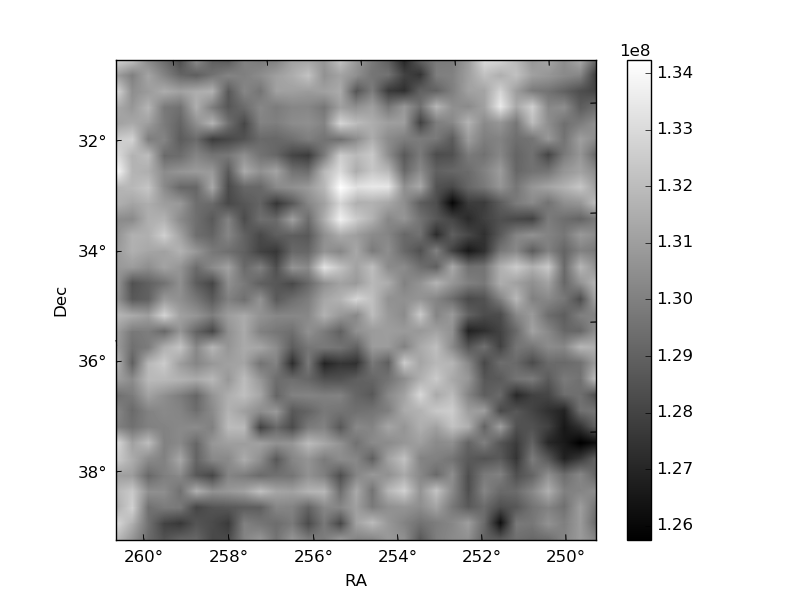
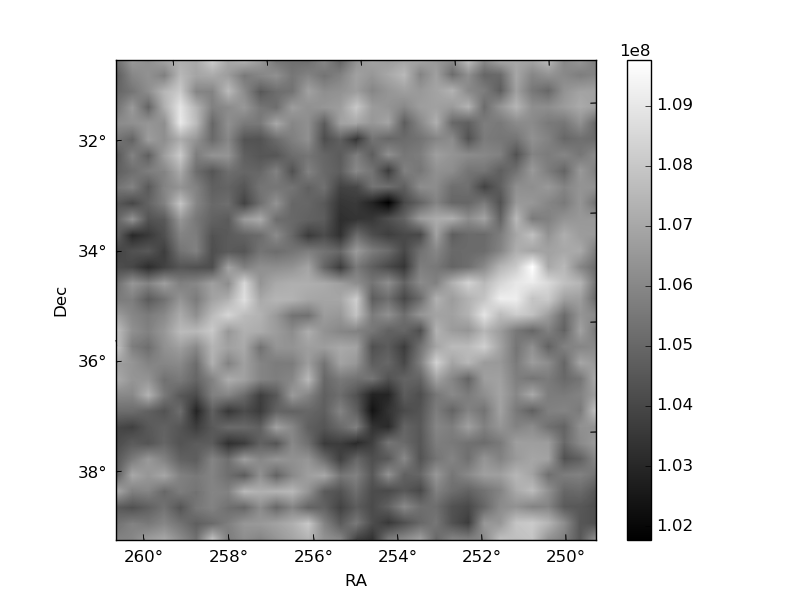
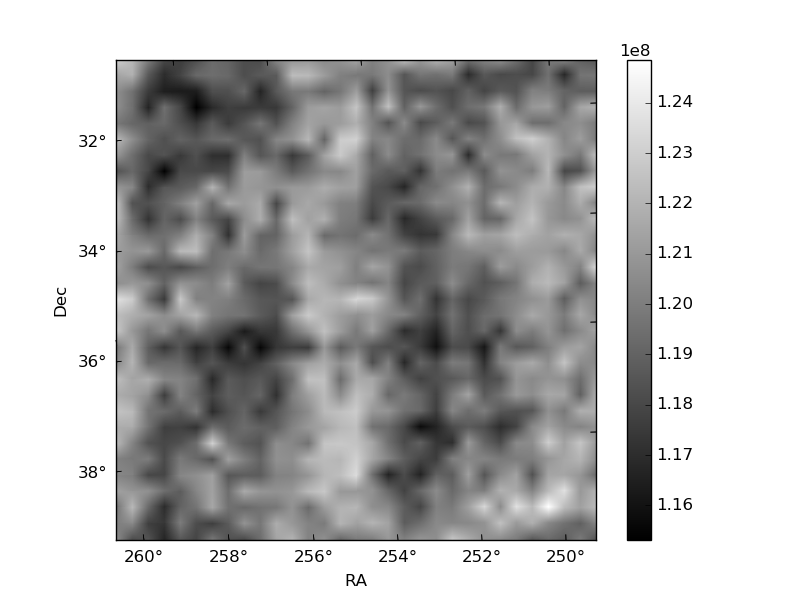
Histogram calculated using DETX and DETY for each event in the final _common_clean file
| Quadrant A | 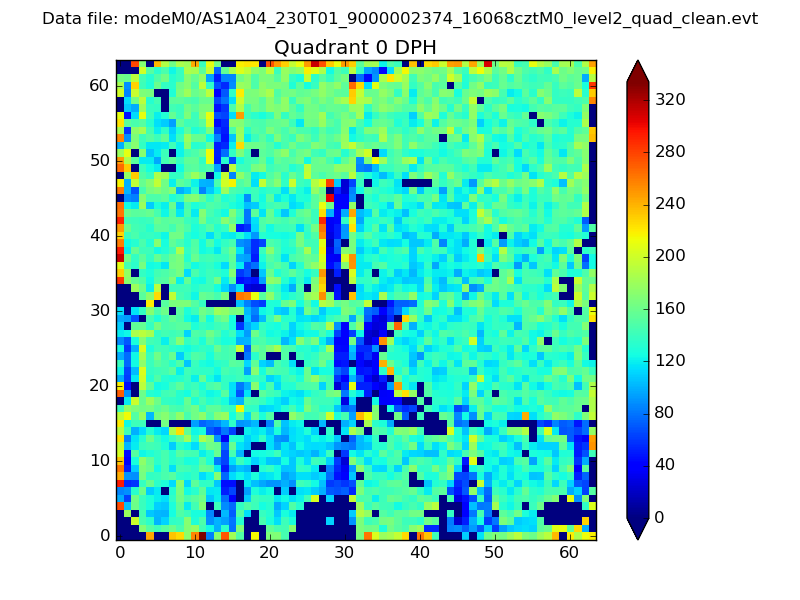 |
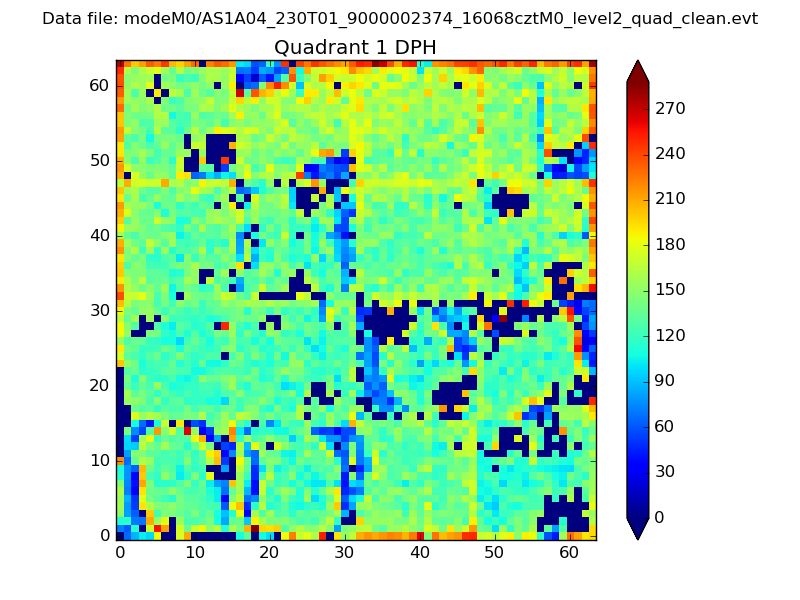 |
Quadrant B |
|---|---|---|---|
| Quadrant D | 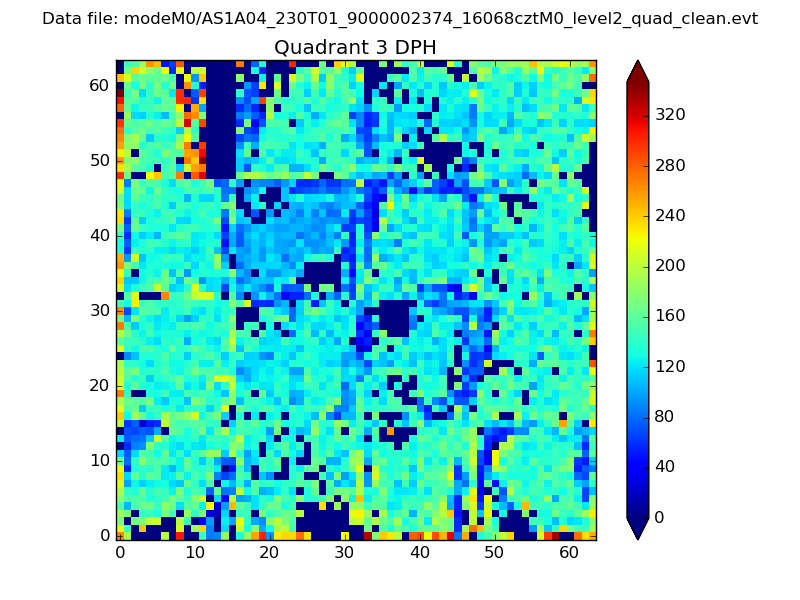 |
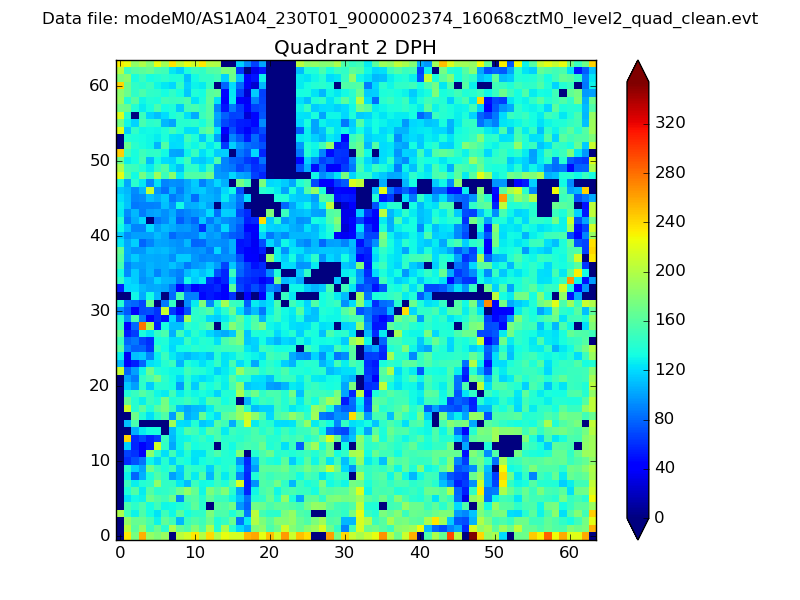 |
Quadrant C |
| Plot type | Count rate plots | Images |
|---|---|---|
| Comparison with Poisson distribution Blue bars denote a histogram of data divided into 1 sec bins. Red curve is a Poisson curve with rate = median count rate of data. |
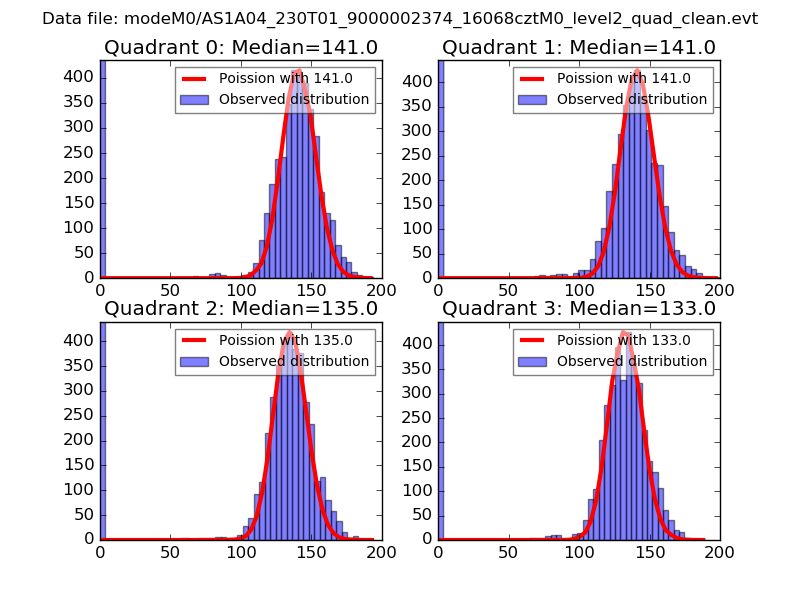 |
 |
| Quadrant-wise count rates Data is divided into 100 sec bins |
 |
|
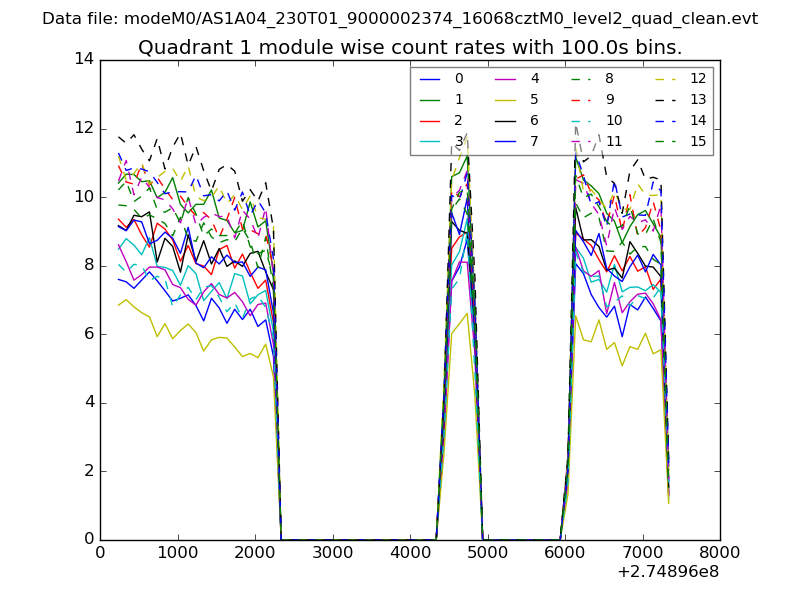
| Module-wise count rates for Quadrant A Data is divided into 100 sec bins |
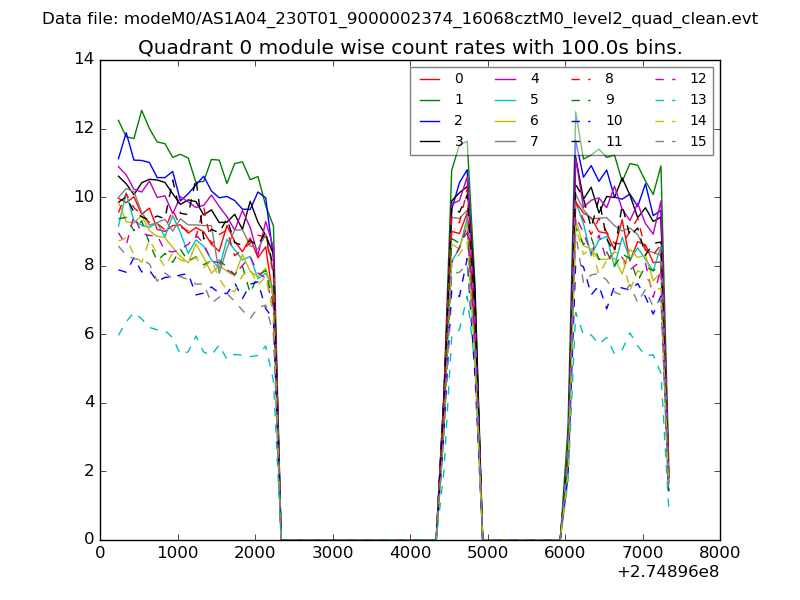 |
 |
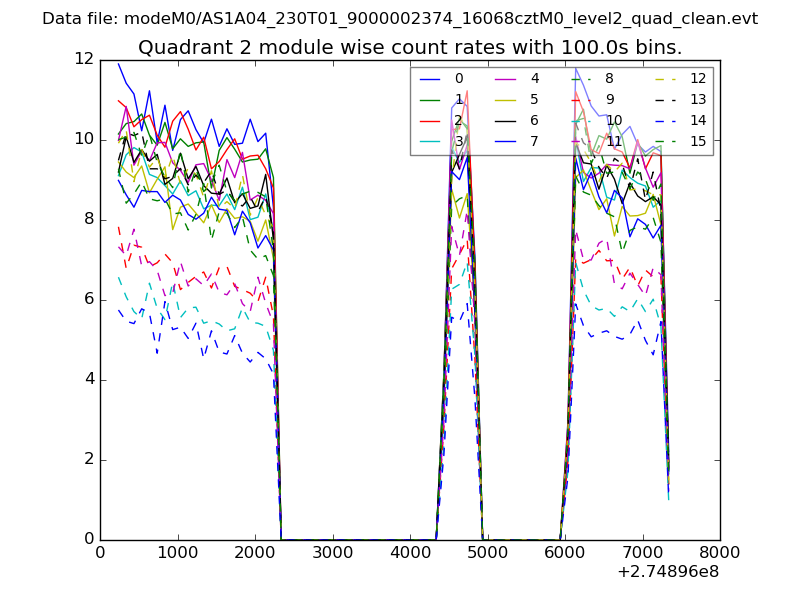
| Module-wise count rates for Quadrant B Data is divided into 100 sec bins |
 |
 |
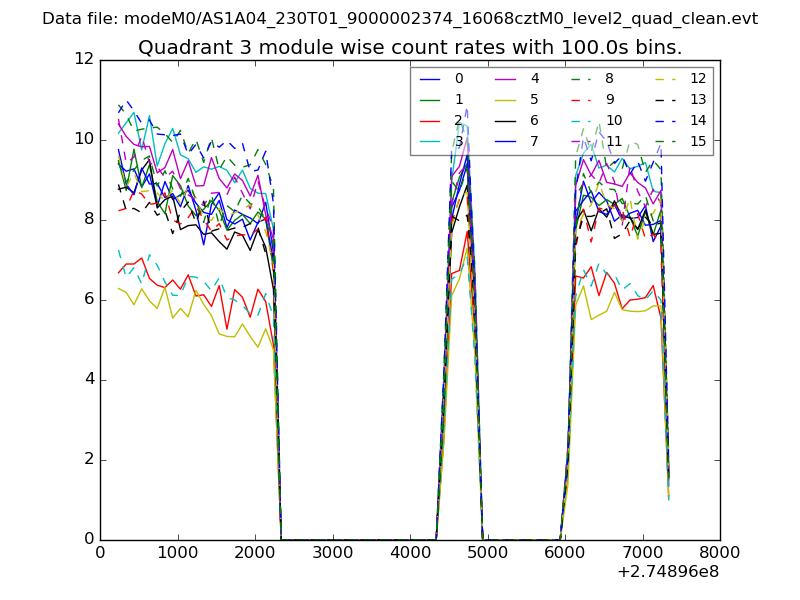
| Module-wise count rates for Quadrant C Data is divided into 100 sec bins |
 |
 |
| Module-wise count rates for Quadrant D Data is divided into 100 sec bins |
 |
 |
| Parameter | Plot |
|---|---|
| CZT HV Monitor | 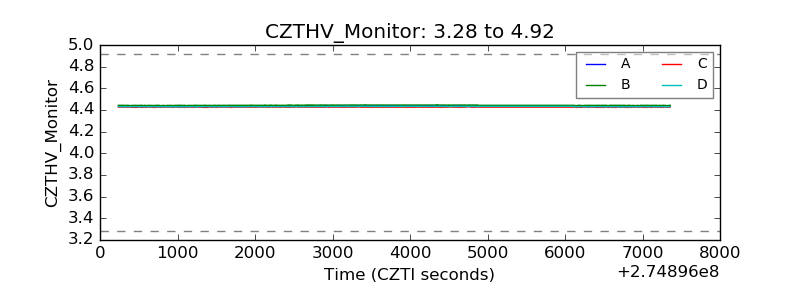 |
| D_VDD |  |
| Temperature 1 | 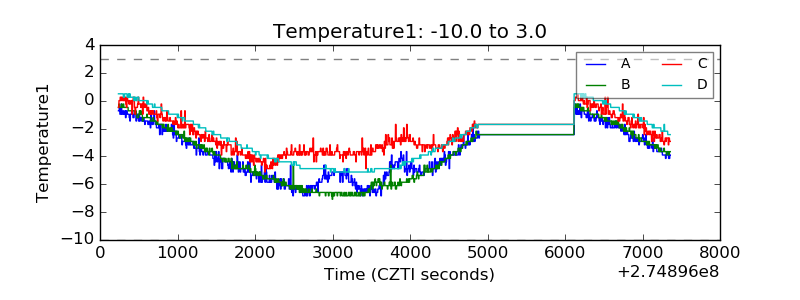 |
| Veto HV Monitor | 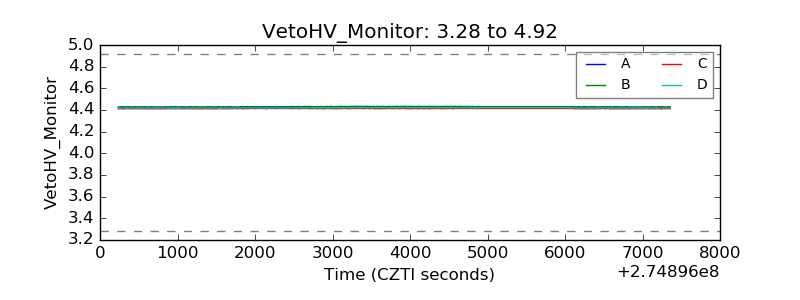 |
| Veto LLD | 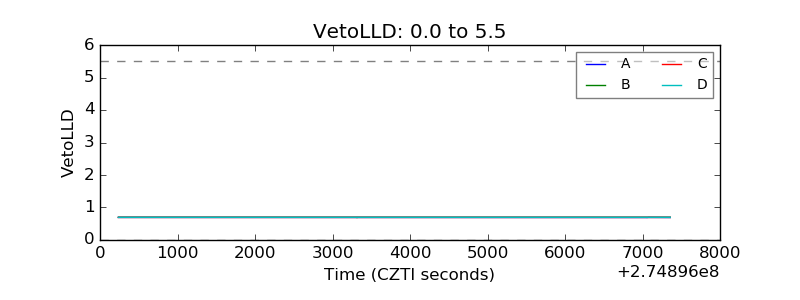 |
| Alpha Counter |  |
| _CPM_Rate | 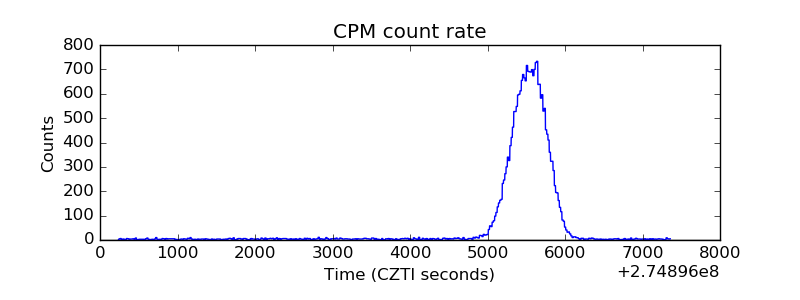 |
| CZT Counter | 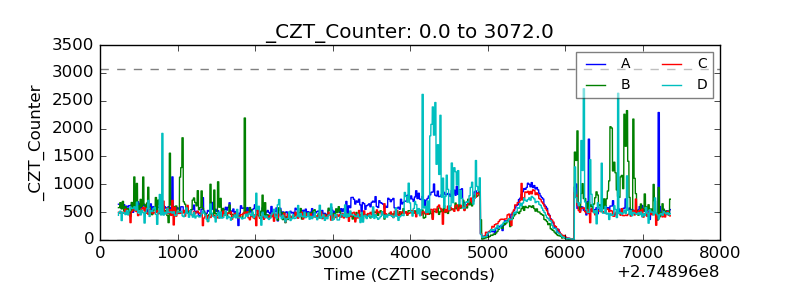 |
| +2.5 Volts monitor |  |
| +5 Volts monitor |  |
| _ROLL_ROT | 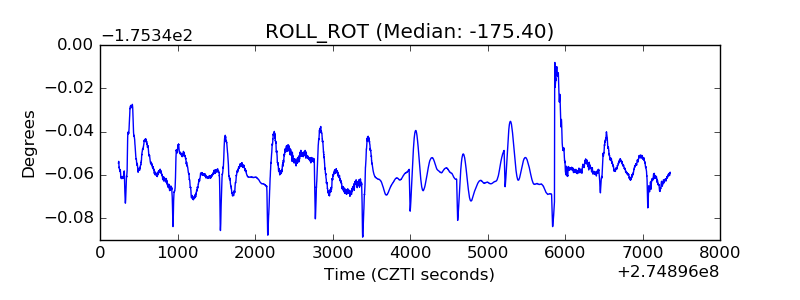 |
| _Roll_DEC | 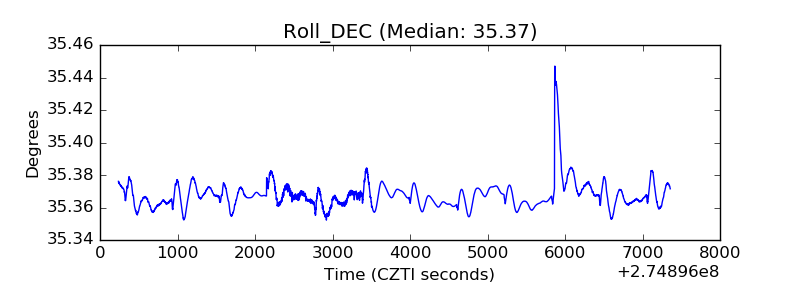 |
| _Roll_RA | 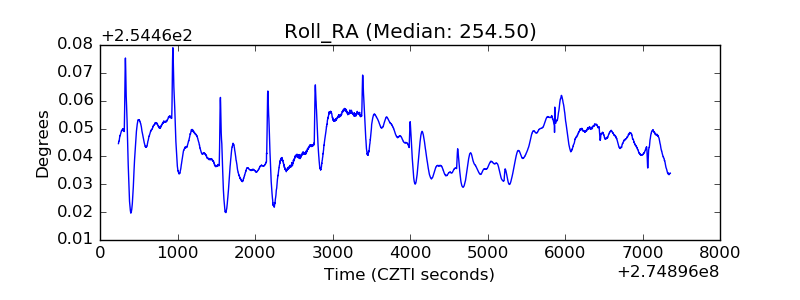 |
| Veto Counter | 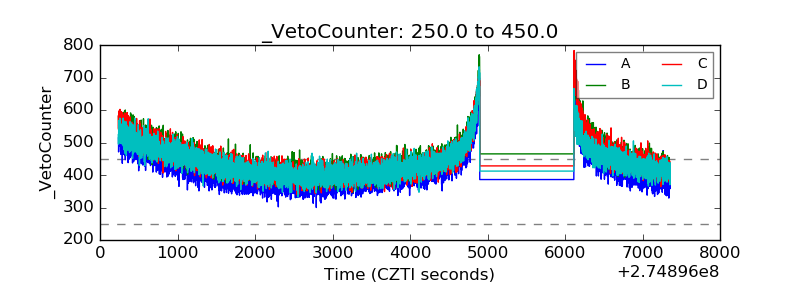 |