| Param | Original file | Final file |
|---|---|---|
| Filename | modeM0/AS1A04_230T01_9000002374_16069cztM0_level2.evt | modeM0/AS1A04_230T01_9000002374_16069cztM0_level2_quad_clean.evt |
| Size (bytes) | 503,349,120 | 93,355,200 |
| Size | 480.0 MB | 89.0 MB |
| Events in quadrant A | 3,526,719 | 606,856 |
| Events in quadrant B | 3,933,610 | 605,616 |
| Events in quadrant C | 3,193,980 | 587,738 |
| Events in quadrant D | 4,138,284 | 563,075 |
| Mode M9 | |||
|---|---|---|---|
| Quadrant | BADHDUFLAG | Total packets | Discarded packets |
| A | 0 | 9 | 0 |
| B | 0 | 9 | 0 |
| C | 0 | 9 | 0 |
| D | 0 | 10 | 0 |
| Mode SS | |||
|---|---|---|---|
| Quadrant | BADHDUFLAG | Total packets | Discarded packets |
| A | 0 | 134 | 0 |
| B | 0 | 134 | 0 |
| C | 0 | 134 | 0 |
| D | 0 | 134 | 0 |
| Mode M0 | |||
|---|---|---|---|
| Quadrant | BADHDUFLAG | Total packets | Discarded packets |
| A | 0 | 14536 | 3 |
| B | 0 | 16036 | 2 |
| C | 0 | 13770 | 2 |
| D | 0 | 16830 | 2 |
| Quadrant | Total seconds | Saturated seconds | Saturation percentage |
|---|---|---|---|
| A | 6655 | 54 | 0.811420% |
| B | 6655 | 152 | 2.283997% |
| C | 6655 | 62 | 0.931630% |
| D | 6655 | 264 | 3.966942% |
Noise dominated data is calculated using 1-second bins in cleaned event files. If a bin has >2000 counts, and if more than 50% of those come from <1% of pixels, then it is considered to be noise-dominated and hence unusable.
| Quadrant | # 1 sec bins | Bins with >0 counts | Bins with >2000 counts | High rate bins dominated by noise | Noise dominated (total time) | Noise dominated (detector-on time) | Marked lightcurve |
|---|---|---|---|---|---|---|---|
| A | 7561 | 6656 | 18 | 18 | 0.24% | 0.27% | 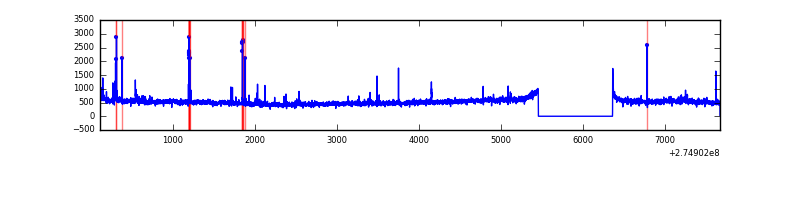 |
| B | 7561 | 6657 | 66 | 66 | 0.87% | 0.99% | 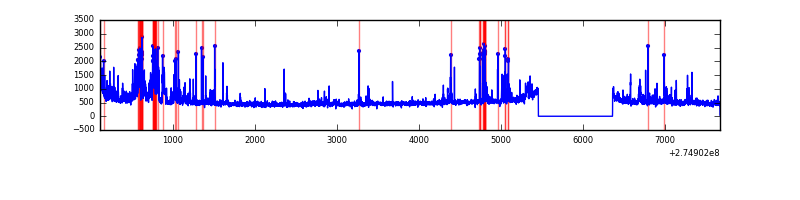 |
| C | 7561 | 6656 | 1 | 1 | 0.01% | 0.02% | 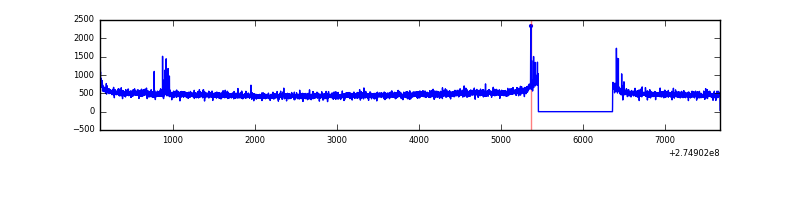 |
| D | 7561 | 6656 | 208 | 208 | 2.75% | 3.12% | 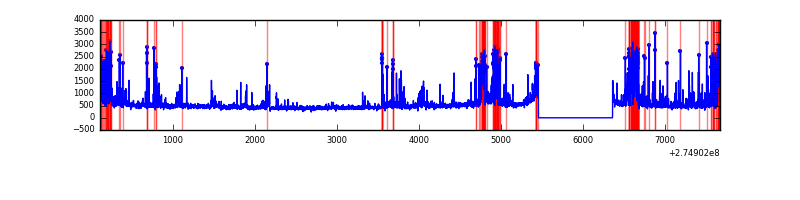 |
Top three noisy pixels from each quadrant. If the there are fewer than three noisy pixels in the level2.evt file, extra rows are filled as -1
| Pixel properties | Quadrant properties | ||||||
|---|---|---|---|---|---|---|---|
| Quadrant | DetID | PixID | Counts | Sigma | Mean | Median | Sigma |
| A | 3 | 80 | 318853 | 1955.01 | 803 | 786 | 162.7 |
| A | 15 | 239 | 81438 | 495.73 | 803 | 786 | 162.7 |
| A | 9 | 143 | 22324 | 132.38 | 803 | 786 | 162.7 |
| B | 0 | 189 | 293818 | 1924.31 | 805 | 786 | 152.3 |
| B | 4 | 173 | 110019 | 717.32 | 805 | 786 | 152.3 |
| B | 7 | 220 | 86440 | 562.48 | 805 | 786 | 152.3 |
| C | 14 | 238 | 117391 | 634.45 | 778 | 782 | 183.8 |
| C | 0 | 207 | 29137 | 154.28 | 778 | 782 | 183.8 |
| C | 3 | 233 | 9143 | 45.49 | 778 | 782 | 183.8 |
| D | 1 | 52 | 595115 | 3042.85 | 774 | 753 | 195.3 |
| D | 12 | 218 | 387502 | 1979.97 | 774 | 753 | 195.3 |
| D | 2 | 152 | 59473 | 300.62 | 774 | 753 | 195.3 |
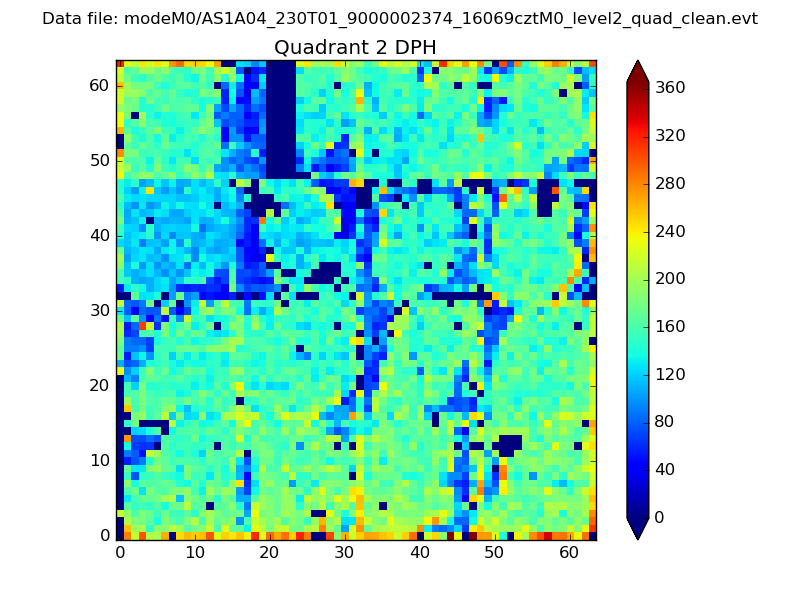
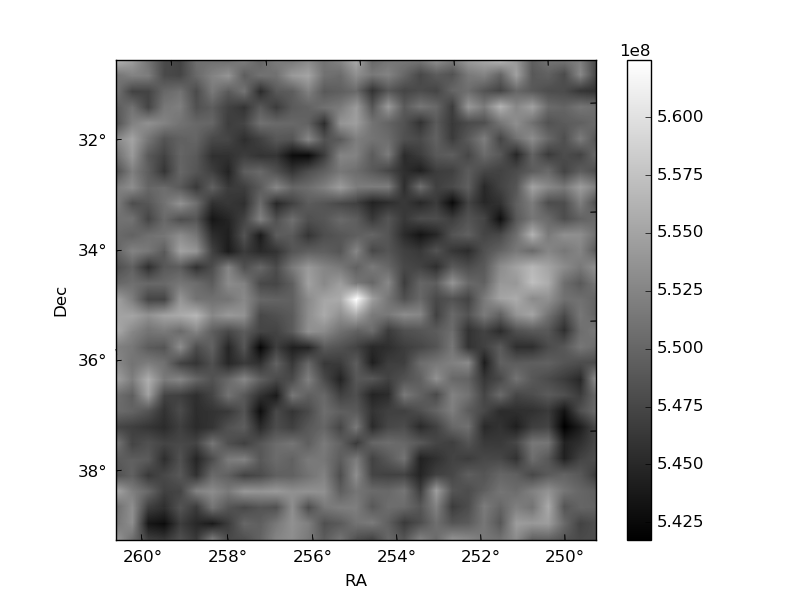
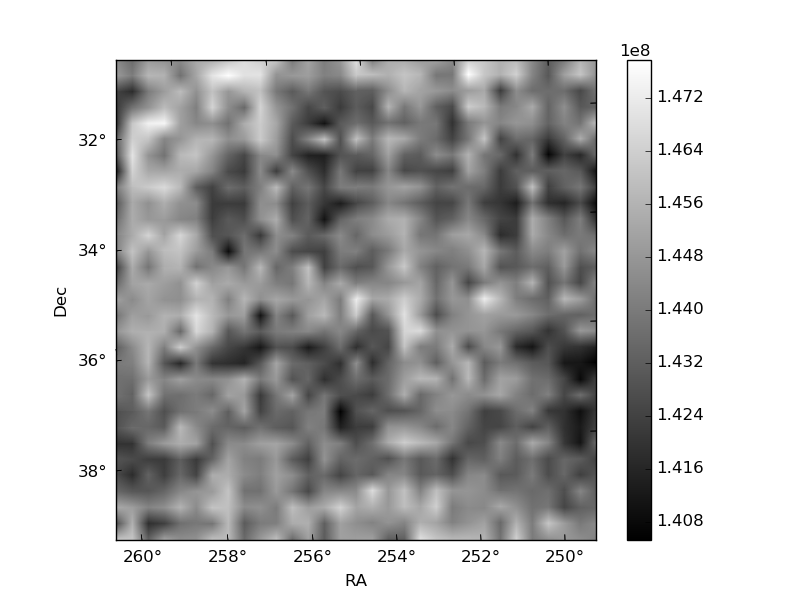
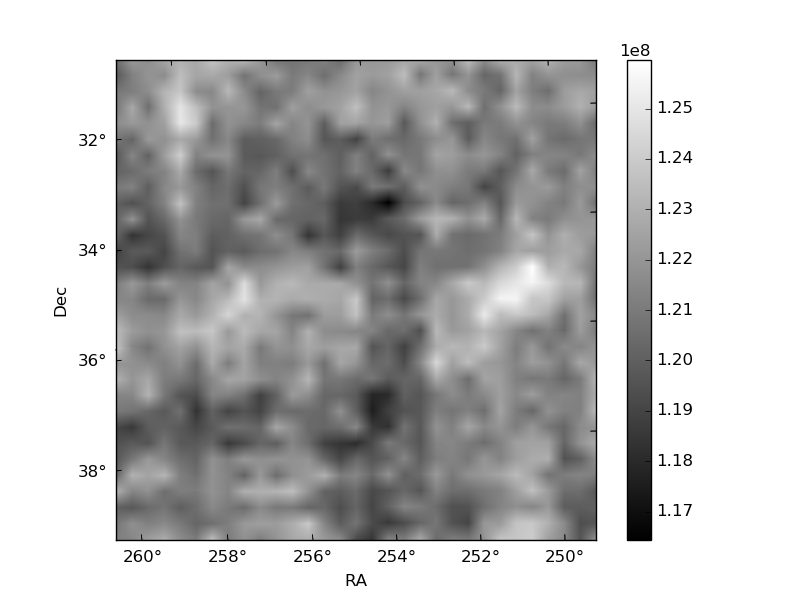
Histogram calculated using DETX and DETY for each event in the final _common_clean file
| Quadrant A | 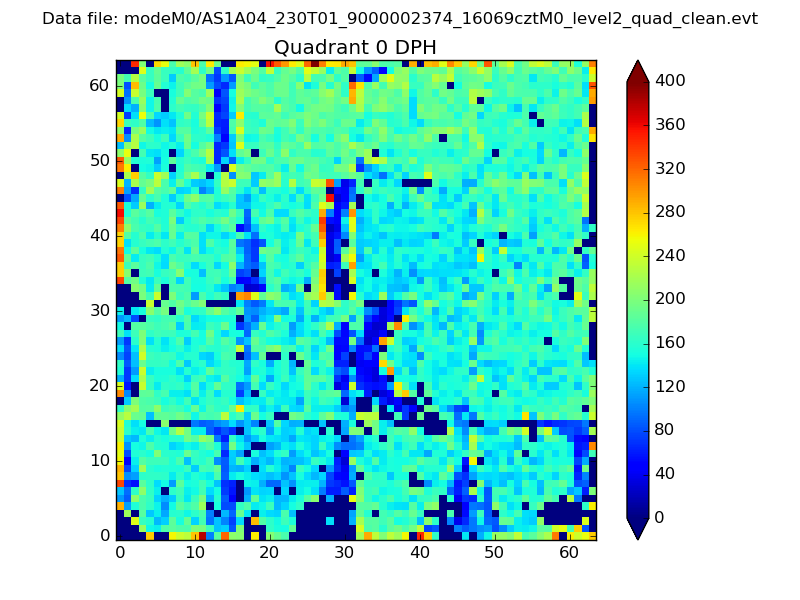 |
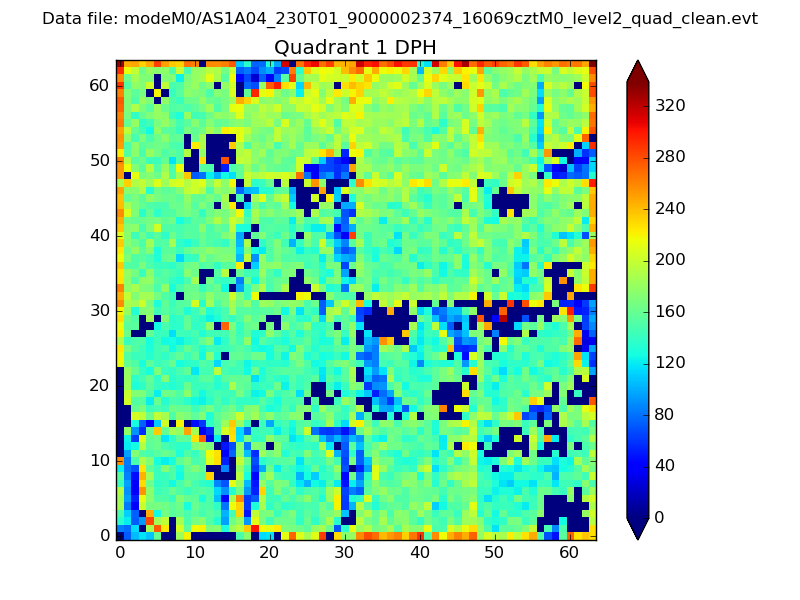 |
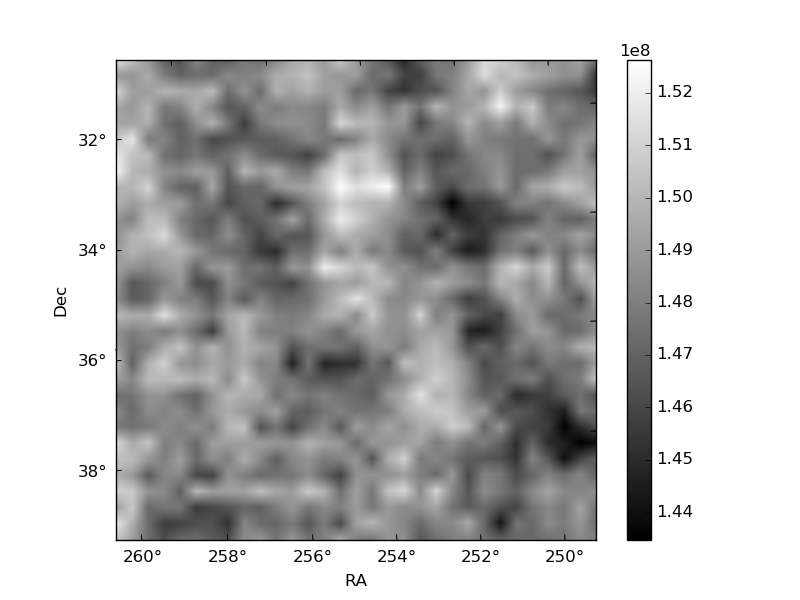
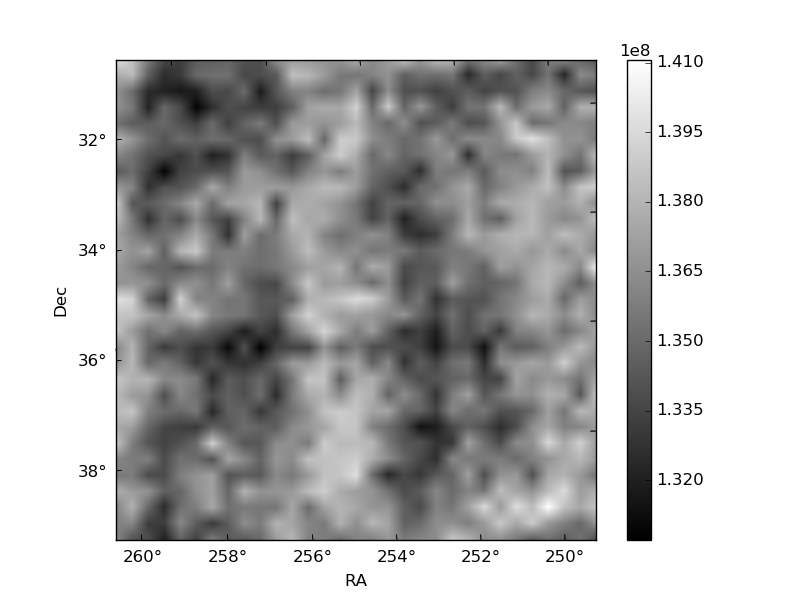
Quadrant B |
|---|---|---|---|
| Quadrant D | 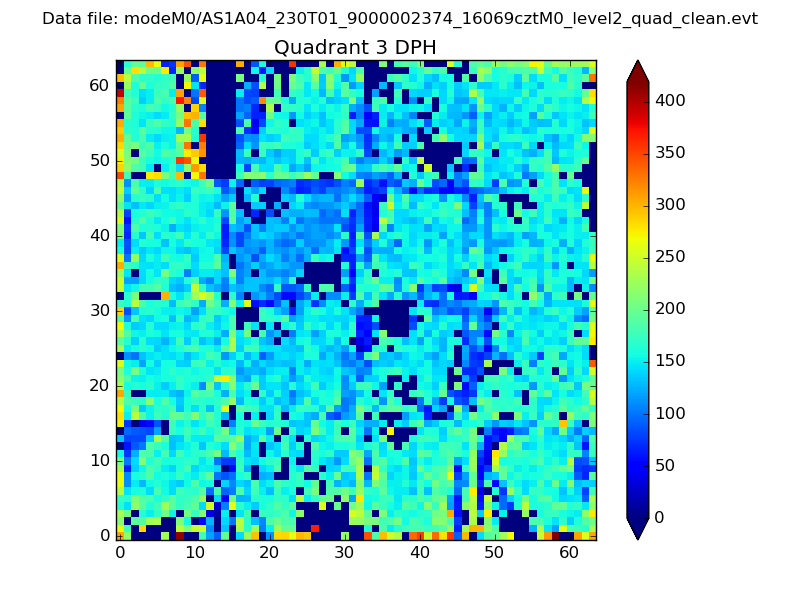 |
 |
Quadrant C |
| Plot type | Count rate plots | Images |
|---|---|---|
| Comparison with Poisson distribution Blue bars denote a histogram of data divided into 1 sec bins. Red curve is a Poisson curve with rate = median count rate of data. |
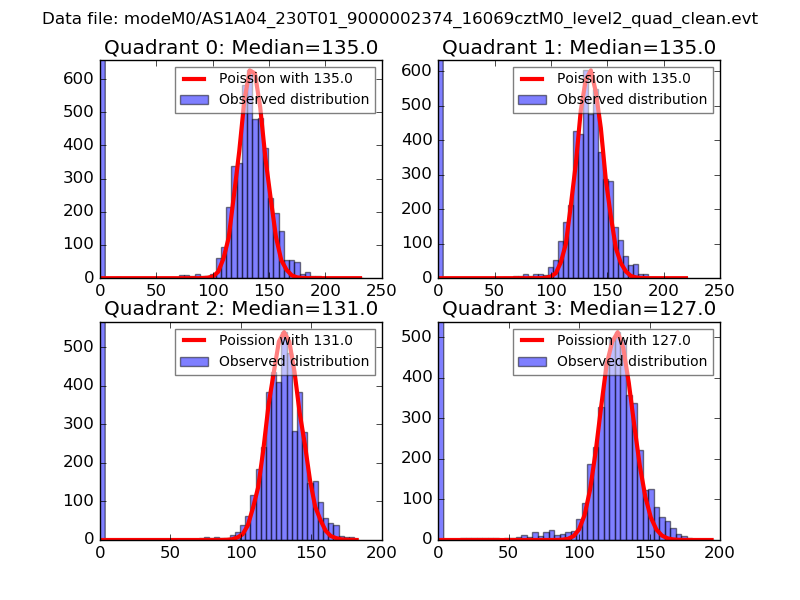 |
 |
| Quadrant-wise count rates Data is divided into 100 sec bins |
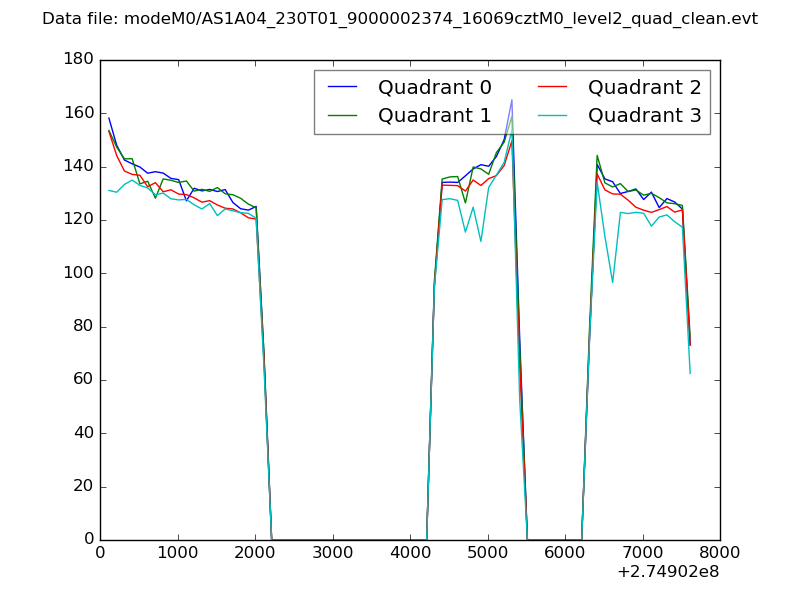 |
|
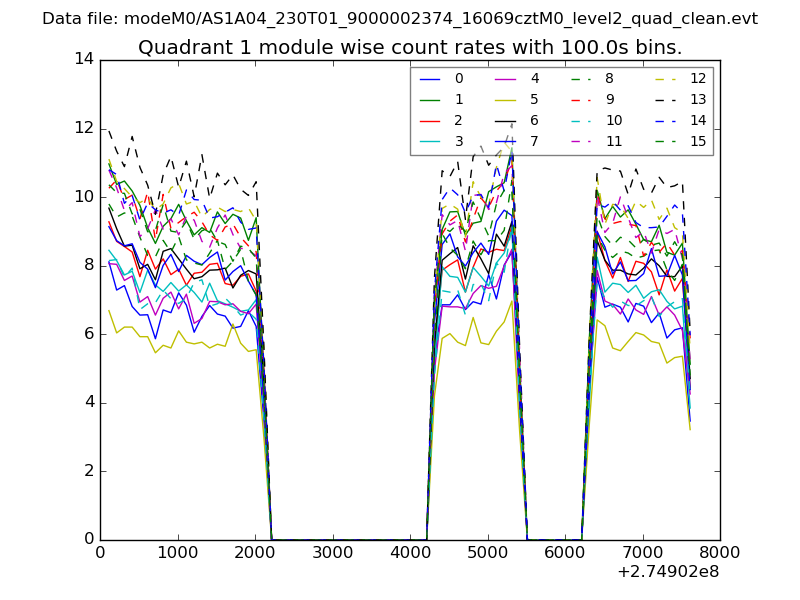
| Module-wise count rates for Quadrant A Data is divided into 100 sec bins |
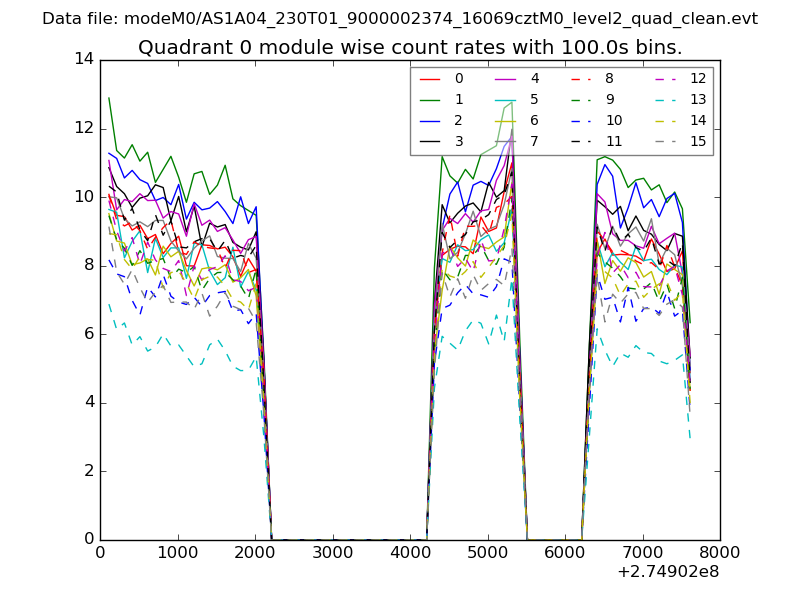 |
 |
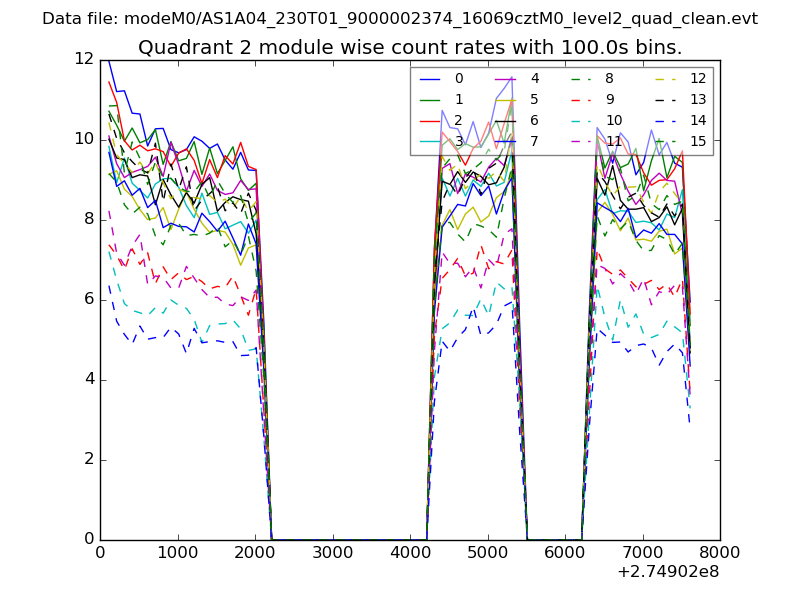
| Module-wise count rates for Quadrant B Data is divided into 100 sec bins |
 |
 |
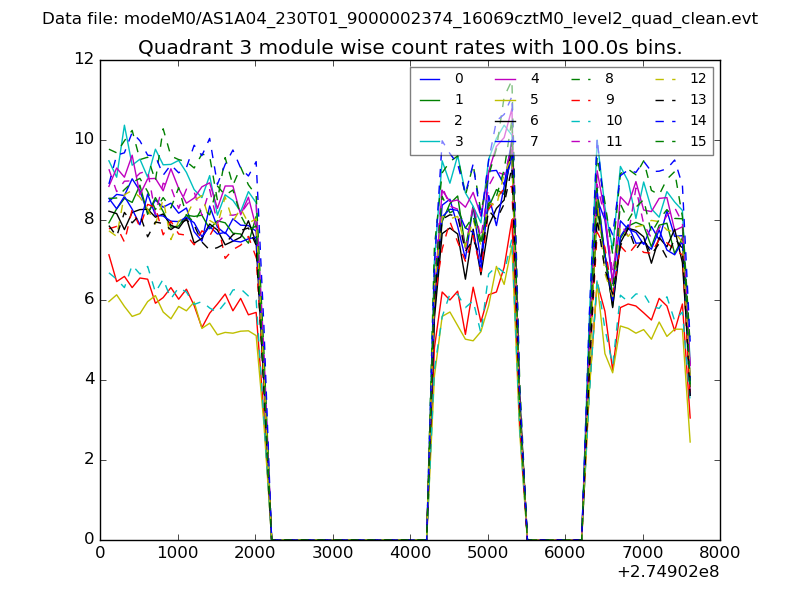
| Module-wise count rates for Quadrant C Data is divided into 100 sec bins |
 |
 |
| Module-wise count rates for Quadrant D Data is divided into 100 sec bins |
 |
 |
| Parameter | Plot |
|---|---|
| CZT HV Monitor | 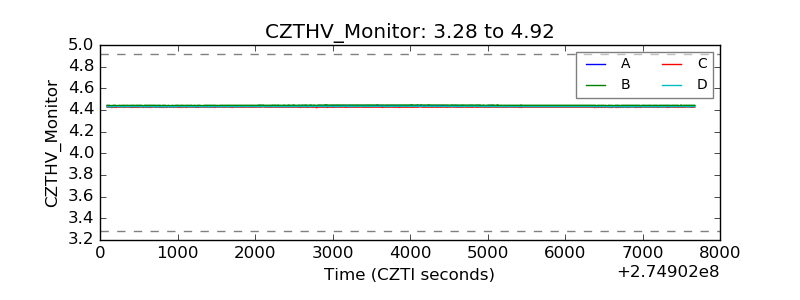 |
| D_VDD | 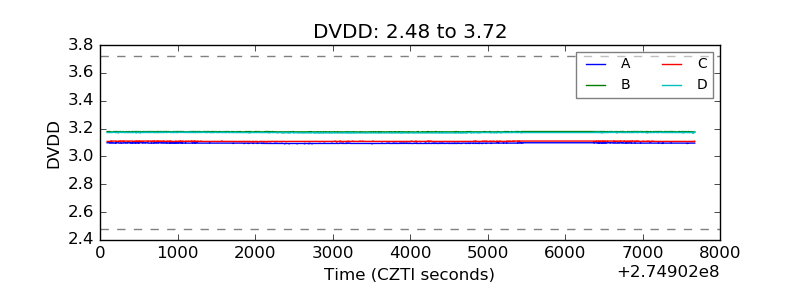 |
| Temperature 1 | 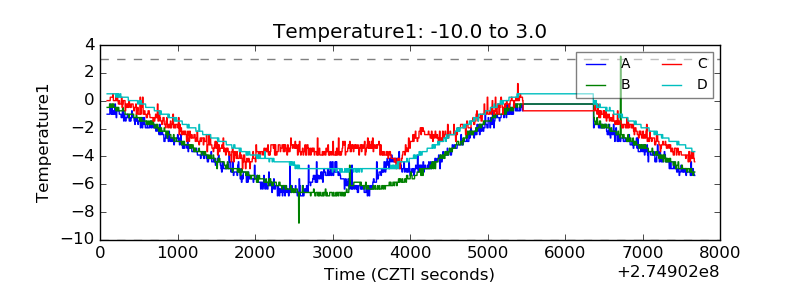 |
| Veto HV Monitor | 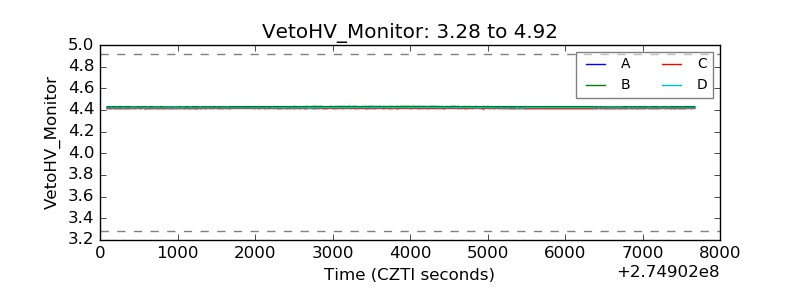 |
| Veto LLD | 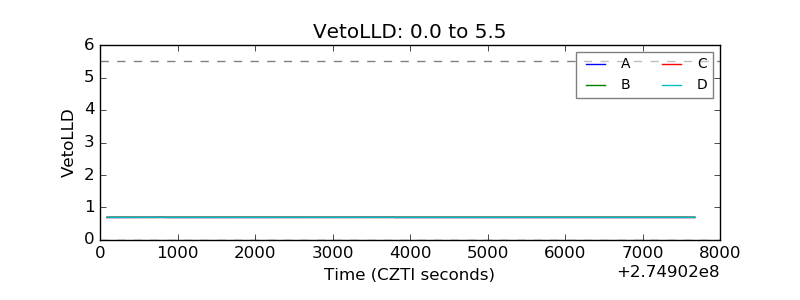 |
| Alpha Counter | 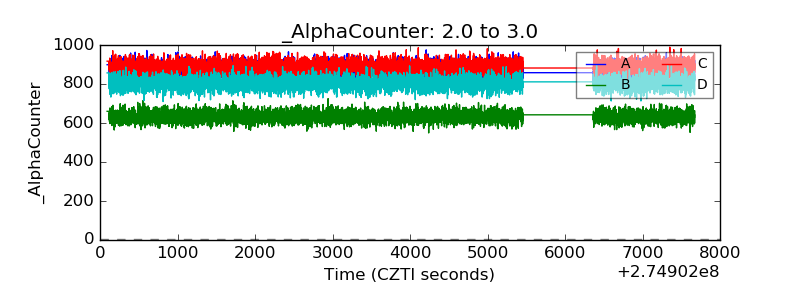 |
| _CPM_Rate | 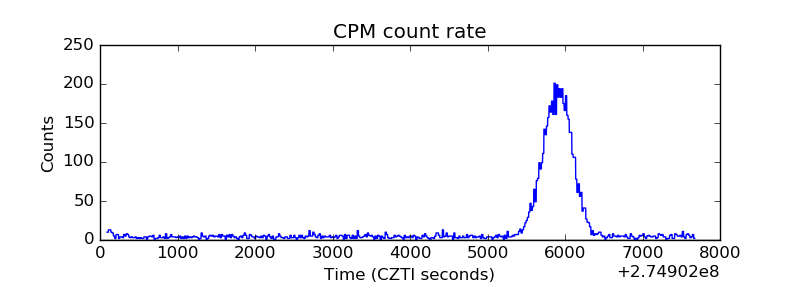 |
| CZT Counter | 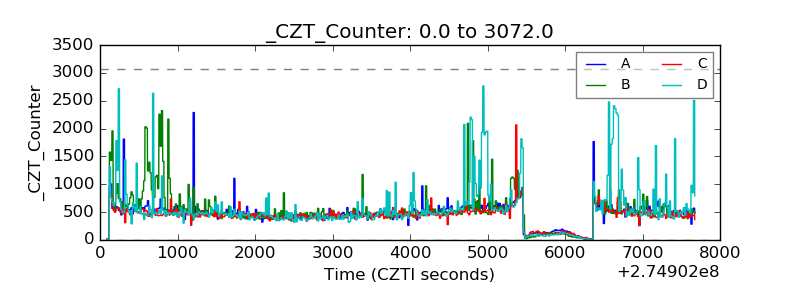 |
| +2.5 Volts monitor |  |
| +5 Volts monitor | 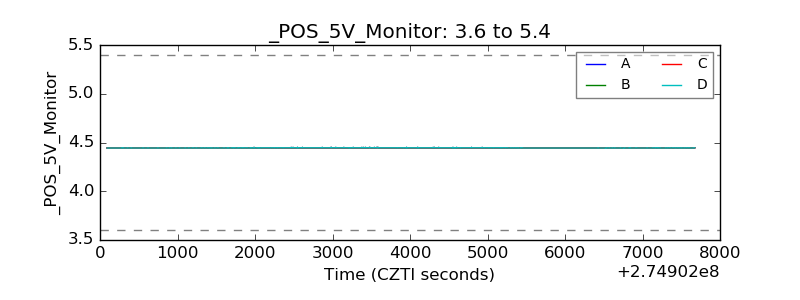 |
| _ROLL_ROT | 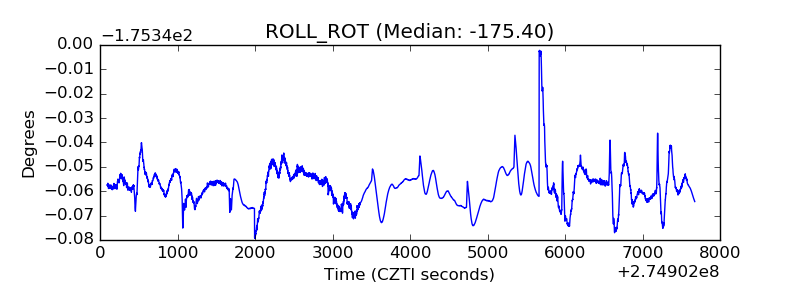 |
| _Roll_DEC | 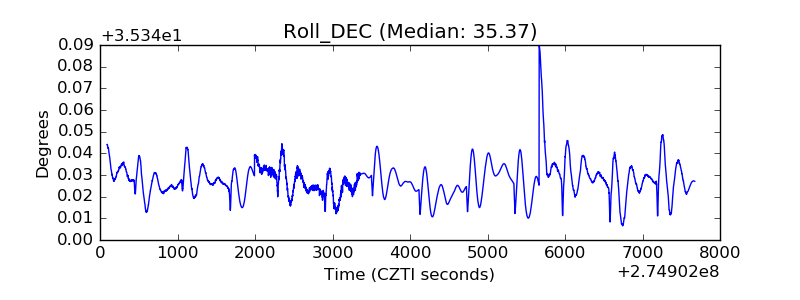 |
| _Roll_RA | 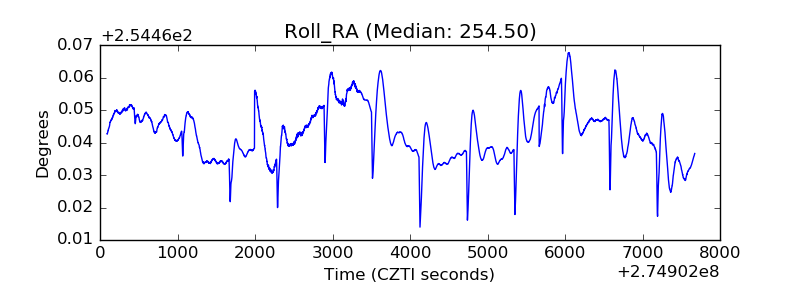 |
| Veto Counter | 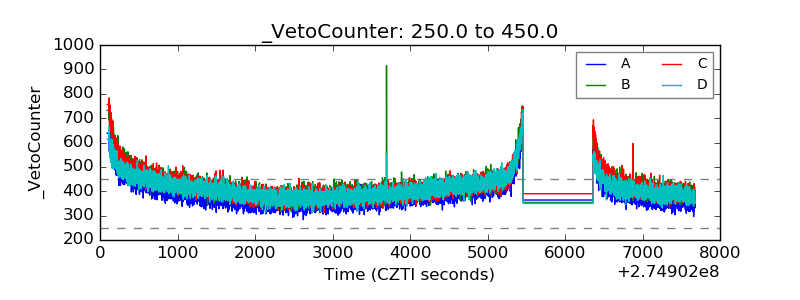 |