| Param | Original file | Final file |
|---|---|---|
| Filename | modeM0/AS1A04_230T01_9000002374_16070cztM0_level2.evt | modeM0/AS1A04_230T01_9000002374_16070cztM0_level2_quad_clean.evt |
| Size (bytes) | 567,480,960 | 98,251,200 |
| Size | 541.2 MB | 93.7 MB |
| Events in quadrant A | 3,691,258 | 639,684 |
| Events in quadrant B | 3,814,006 | 640,700 |
| Events in quadrant C | 3,388,508 | 619,016 |
| Events in quadrant D | 5,810,296 | 580,726 |
| Mode M9 | |||
|---|---|---|---|
| Quadrant | BADHDUFLAG | Total packets | Discarded packets |
| A | 0 | 11 | 0 |
| B | 0 | 11 | 0 |
| C | 0 | 11 | 0 |
| D | 0 | 12 | 0 |
| Mode SS | |||
|---|---|---|---|
| Quadrant | BADHDUFLAG | Total packets | Discarded packets |
| A | 0 | 144 | 0 |
| B | 0 | 144 | 0 |
| C | 0 | 144 | 0 |
| D | 0 | 144 | 0 |
| Mode M0 | |||
|---|---|---|---|
| Quadrant | BADHDUFLAG | Total packets | Discarded packets |
| A | 0 | 15384 | 3 |
| B | 0 | 15949 | 2 |
| C | 0 | 14676 | 2 |
| D | 0 | 22124 | 2 |
| Quadrant | Total seconds | Saturated seconds | Saturation percentage |
|---|---|---|---|
| A | 7109 | 60 | 0.844001% |
| B | 7109 | 142 | 1.997468% |
| C | 7109 | 84 | 1.181601% |
| D | 7109 | 703 | 9.888873% |
Noise dominated data is calculated using 1-second bins in cleaned event files. If a bin has >2000 counts, and if more than 50% of those come from <1% of pixels, then it is considered to be noise-dominated and hence unusable.
| Quadrant | # 1 sec bins | Bins with >0 counts | Bins with >2000 counts | High rate bins dominated by noise | Noise dominated (total time) | Noise dominated (detector-on time) | Marked lightcurve |
|---|---|---|---|---|---|---|---|
| A | 7570 | 7111 | 5 | 5 | 0.07% | 0.07% | 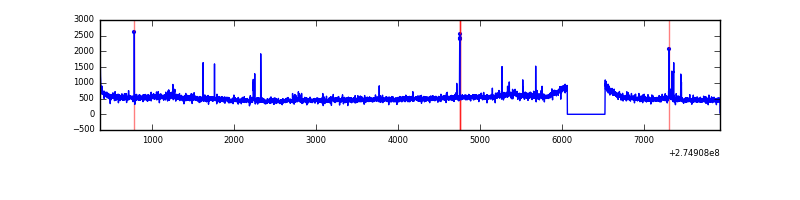 |
| B | 7570 | 7111 | 41 | 41 | 0.54% | 0.58% | 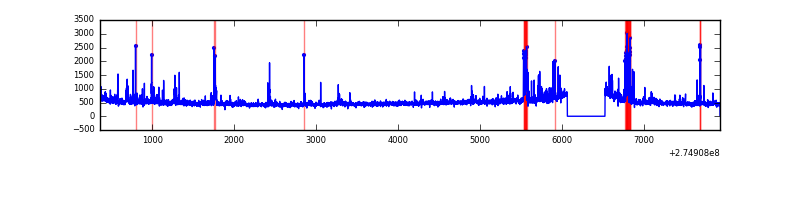 |
| C | 7570 | 7111 | 0 | 0 | 0.00% | 0.00% | 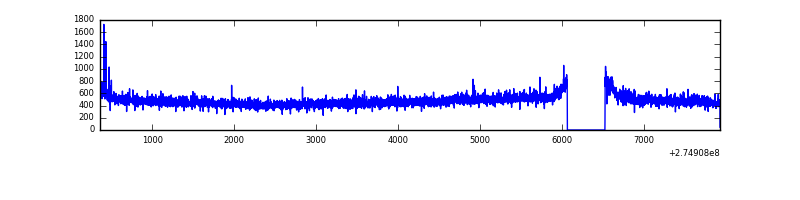 |
| D | 7570 | 7111 | 653 | 653 | 8.63% | 9.18% | 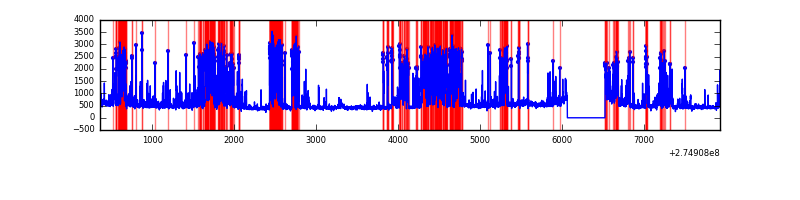 |
Top three noisy pixels from each quadrant. If the there are fewer than three noisy pixels in the level2.evt file, extra rows are filled as -1
| Pixel properties | Quadrant properties | ||||||
|---|---|---|---|---|---|---|---|
| Quadrant | DetID | PixID | Counts | Sigma | Mean | Median | Sigma |
| A | 3 | 80 | 330010 | 1910.89 | 851 | 831 | 172.3 |
| A | 15 | 239 | 38546 | 218.94 | 851 | 831 | 172.3 |
| A | 9 | 143 | 23999 | 134.49 | 851 | 831 | 172.3 |
| B | 7 | 220 | 164069 | 1006.01 | 853 | 830 | 162.3 |
| B | 0 | 189 | 61146 | 371.72 | 853 | 830 | 162.3 |
| B | 0 | 190 | 60105 | 365.3 | 853 | 830 | 162.3 |
| C | 14 | 238 | 124679 | 641.33 | 822 | 826 | 193.1 |
| C | 0 | 207 | 34708 | 175.45 | 822 | 826 | 193.1 |
| C | 4 | 238 | 10063 | 47.83 | 822 | 826 | 193.1 |
| D | 1 | 52 | 1921624 | 9809.69 | 803 | 779 | 195.8 |
| D | 12 | 218 | 689851 | 3519.07 | 803 | 779 | 195.8 |
| D | 2 | 152 | 38599 | 193.15 | 803 | 779 | 195.8 |
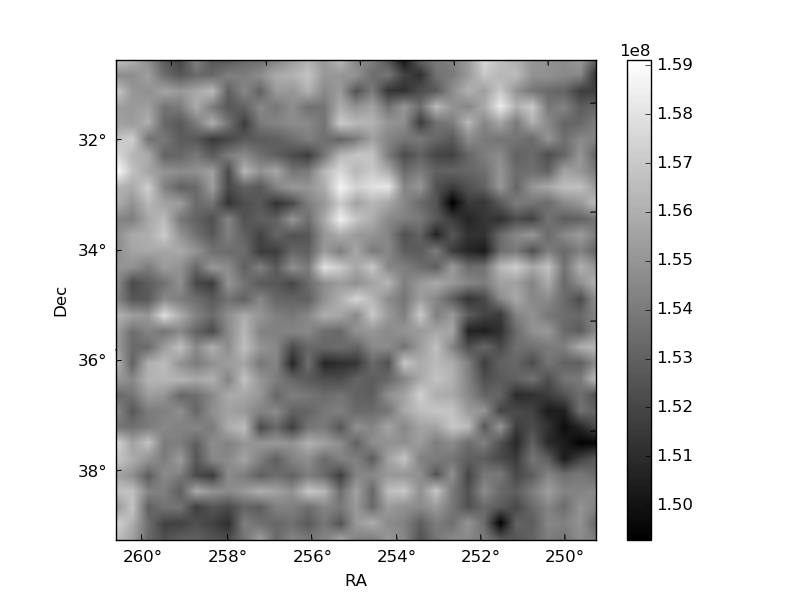
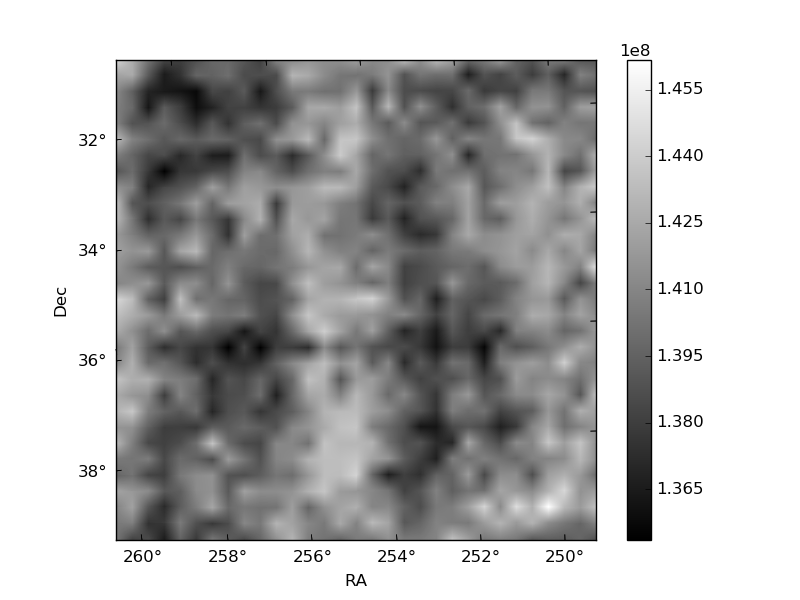
Histogram calculated using DETX and DETY for each event in the final _common_clean file
| Quadrant A | 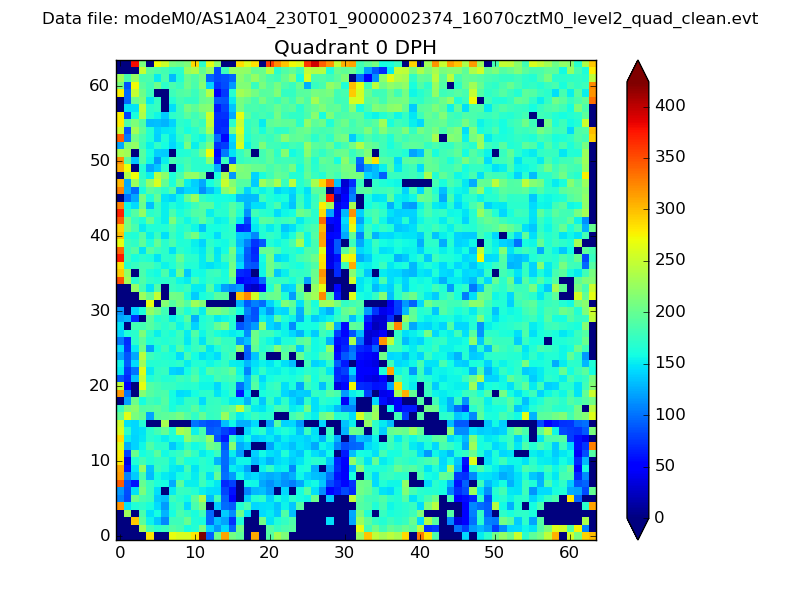 |
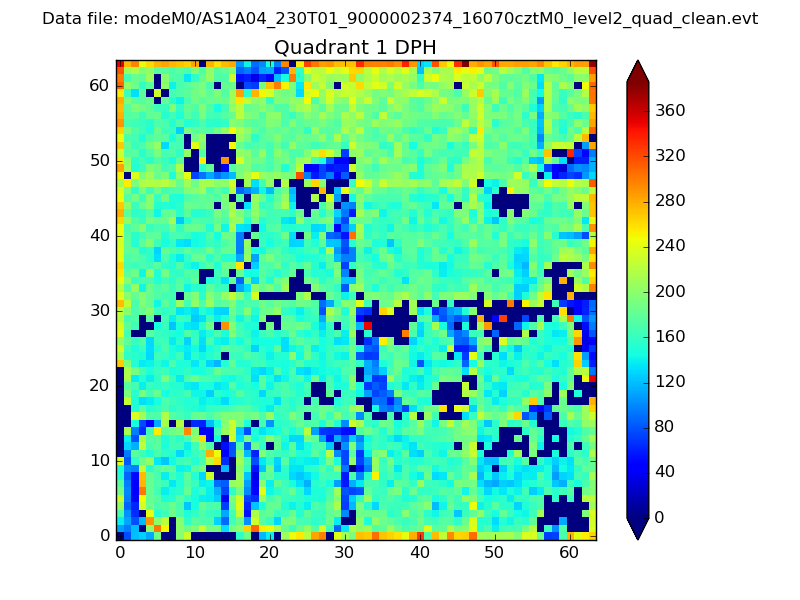 |
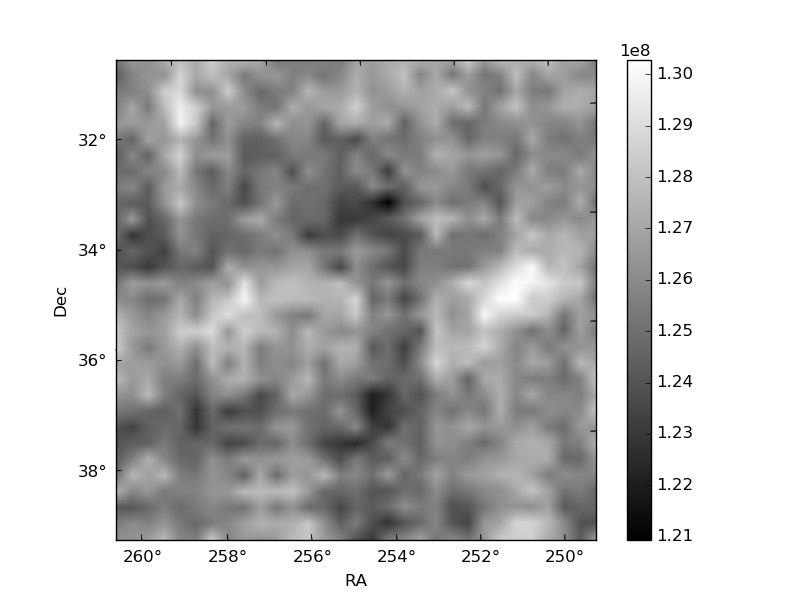
Quadrant B |
|---|---|---|---|
| Quadrant D | 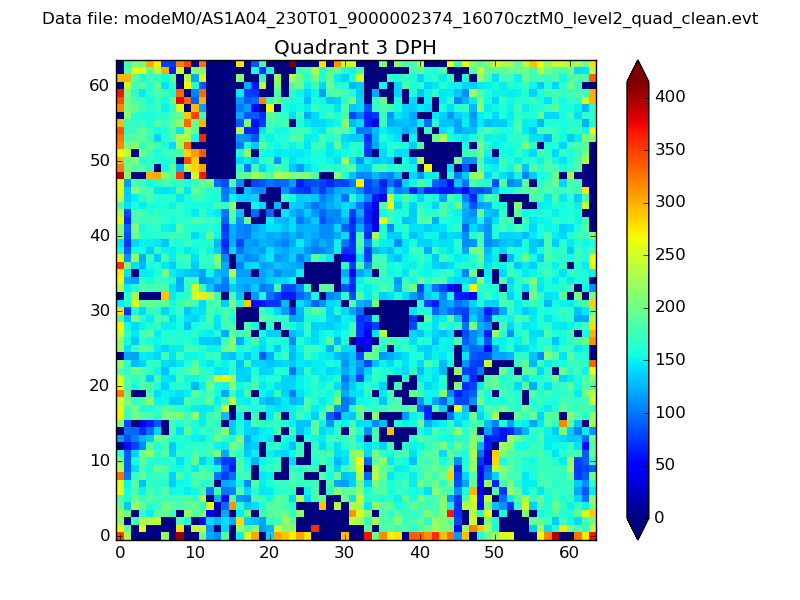 |
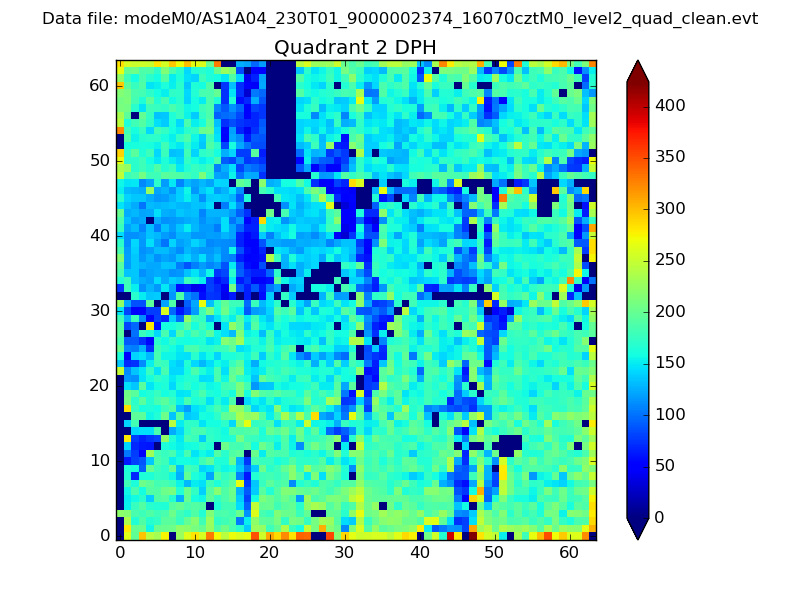 |
Quadrant C |
| Plot type | Count rate plots | Images |
|---|---|---|
| Comparison with Poisson distribution Blue bars denote a histogram of data divided into 1 sec bins. Red curve is a Poisson curve with rate = median count rate of data. |
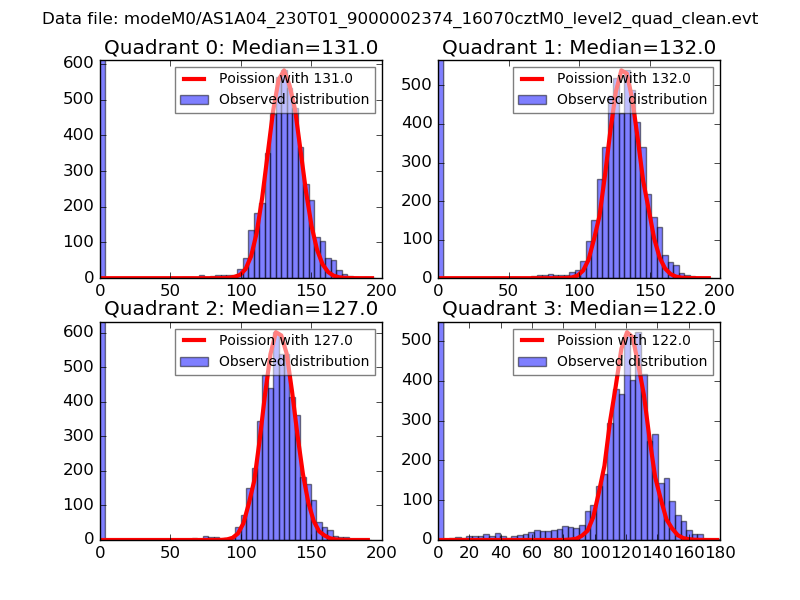 |
 |
| Quadrant-wise count rates Data is divided into 100 sec bins |
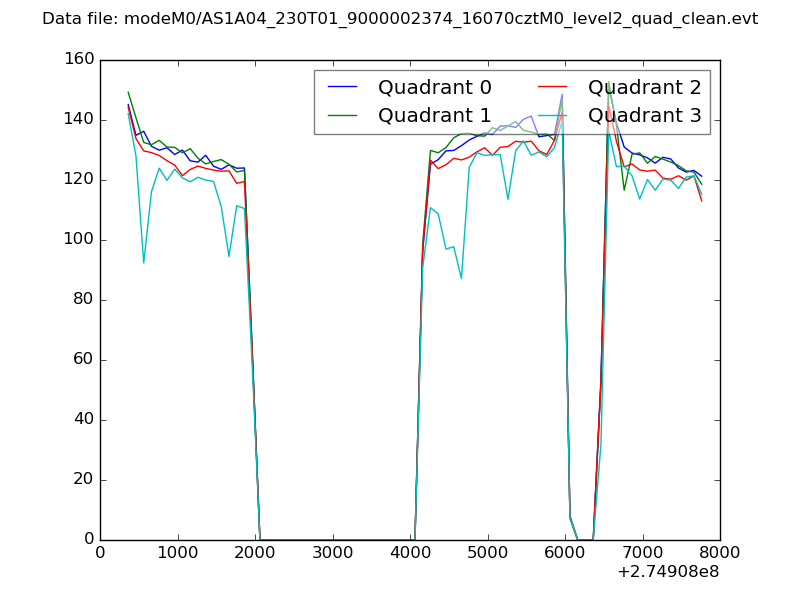 |
|
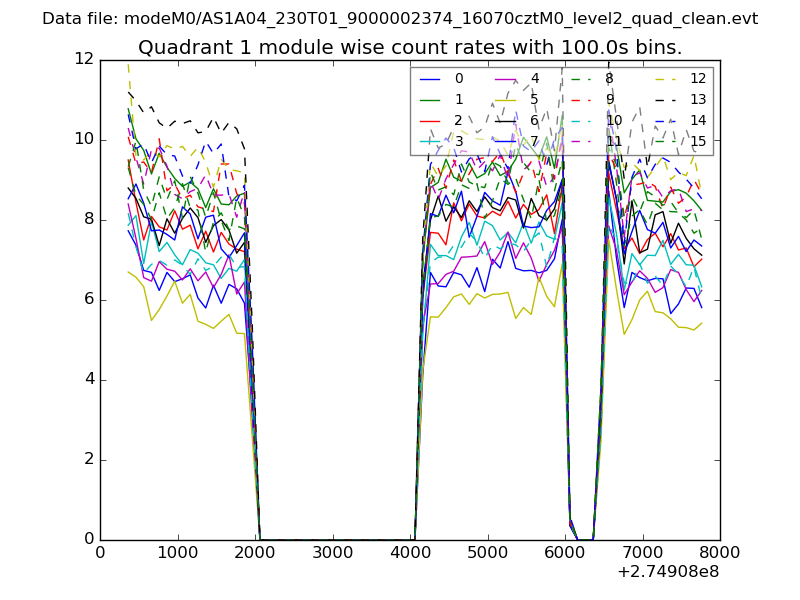
| Module-wise count rates for Quadrant A Data is divided into 100 sec bins |
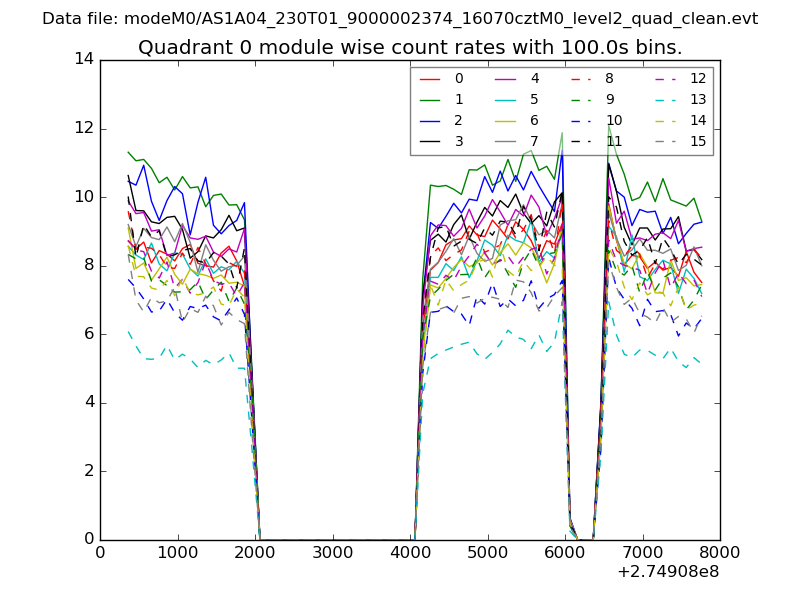 |
 |
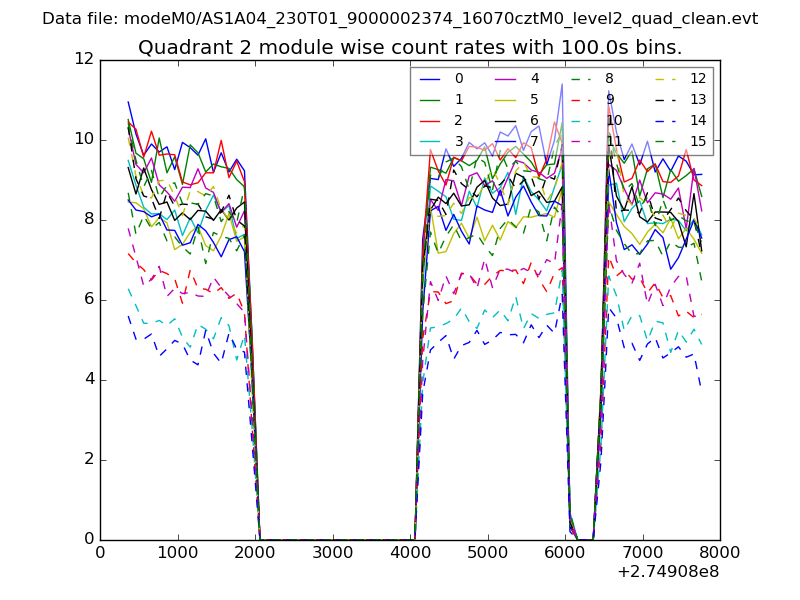
| Module-wise count rates for Quadrant B Data is divided into 100 sec bins |
 |
 |
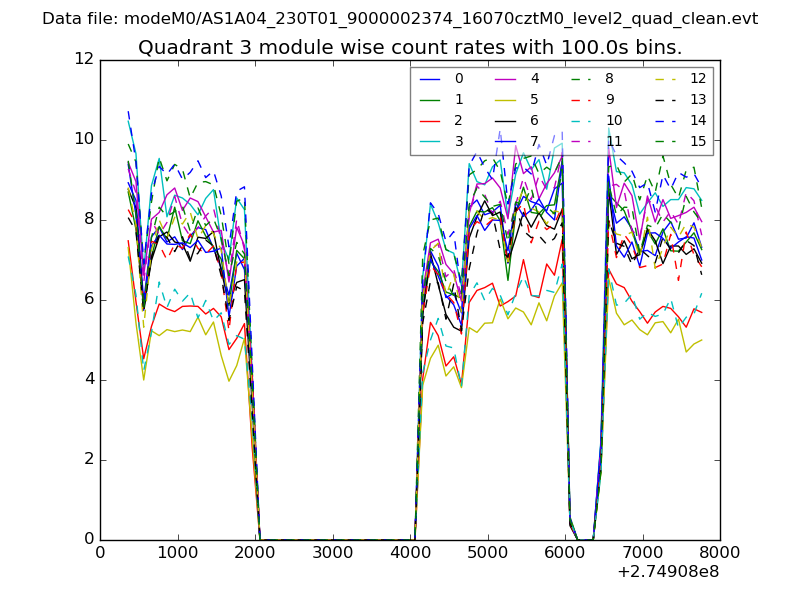
| Module-wise count rates for Quadrant C Data is divided into 100 sec bins |
 |
 |
| Module-wise count rates for Quadrant D Data is divided into 100 sec bins |
 |
 |
| Parameter | Plot |
|---|---|
| CZT HV Monitor | 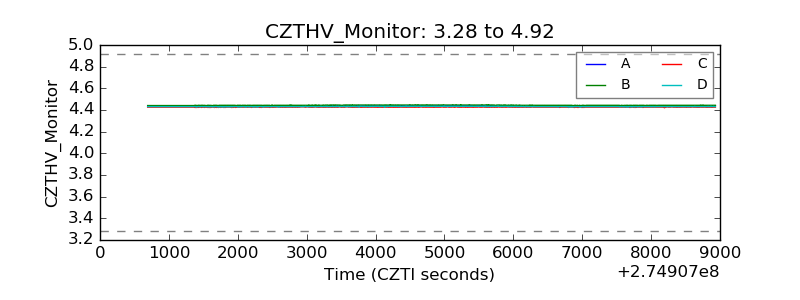 |
| D_VDD | 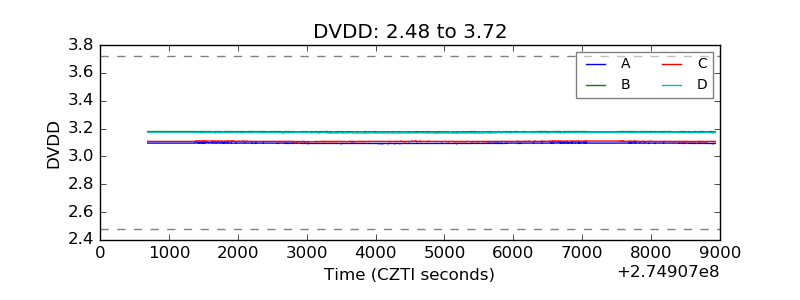 |
| Temperature 1 | 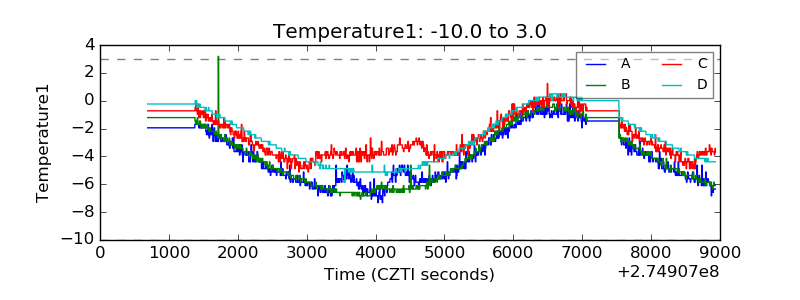 |
| Veto HV Monitor | 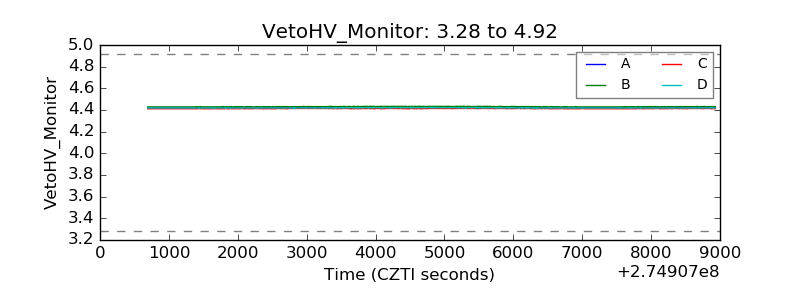 |
| Veto LLD | 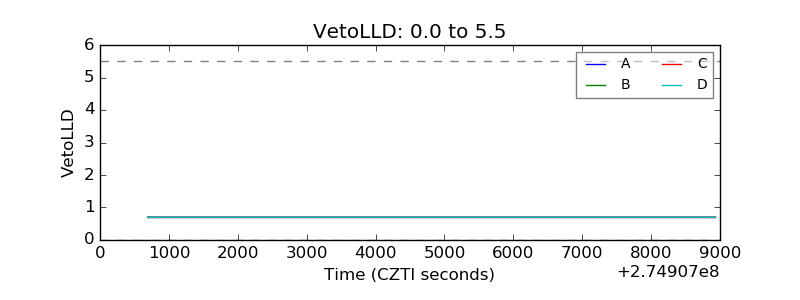 |
| Alpha Counter | 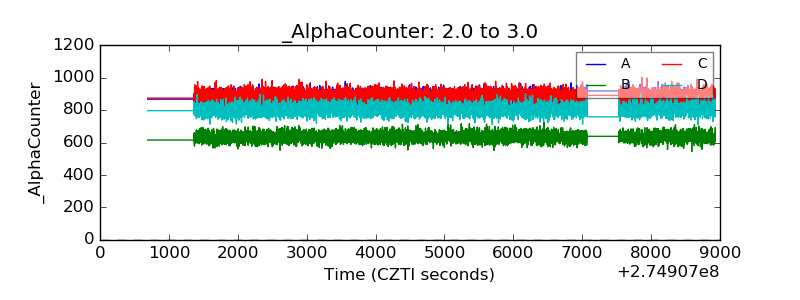 |
| _CPM_Rate | 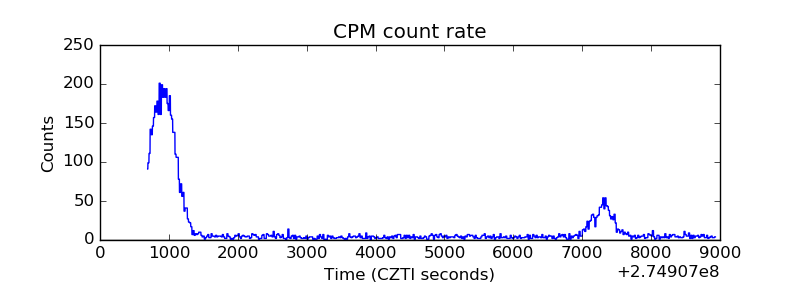 |
| CZT Counter | 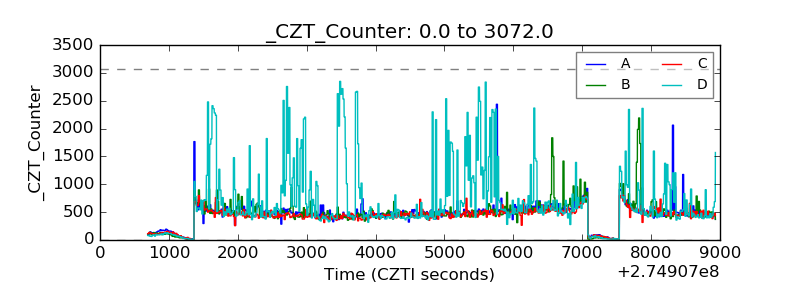 |
| +2.5 Volts monitor |  |
| +5 Volts monitor | 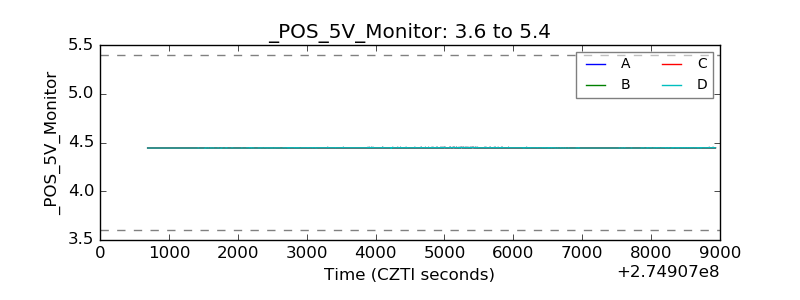 |
| _ROLL_ROT | 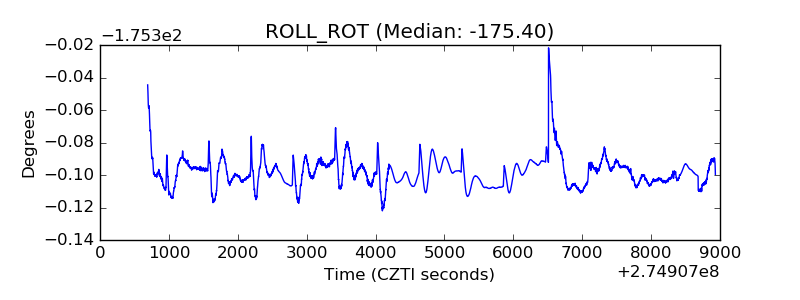 |
| _Roll_DEC | 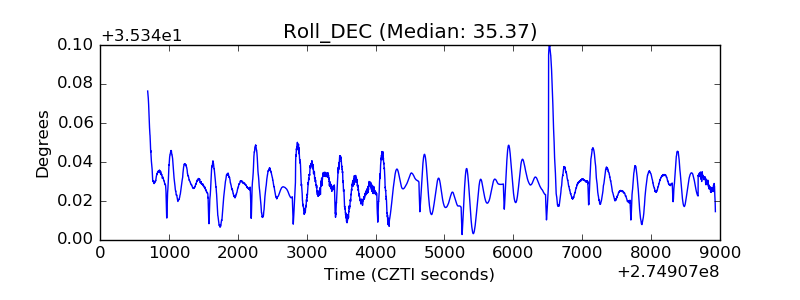 |
| _Roll_RA |  |
| Veto Counter | 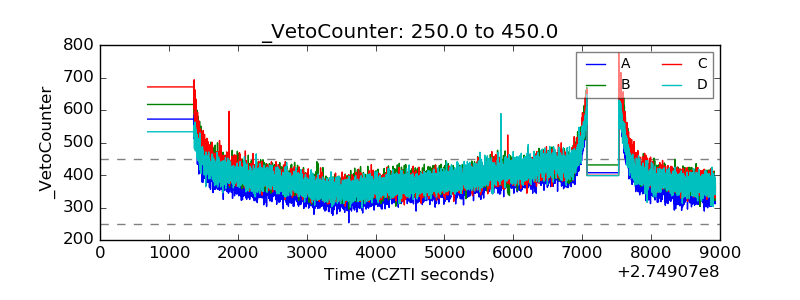 |