| Param | Original file | Final file |
|---|---|---|
| Filename | modeM0/AS1A04_230T01_9000002374_16071cztM0_level2.evt | modeM0/AS1A04_230T01_9000002374_16071cztM0_level2_quad_clean.evt |
| Size (bytes) | 580,628,160 | 96,477,120 |
| Size | 553.7 MB | 92.0 MB |
| Events in quadrant A | 3,830,378 | 622,137 |
| Events in quadrant B | 3,992,528 | 617,693 |
| Events in quadrant C | 3,648,557 | 596,593 |
| Events in quadrant D | 5,598,895 | 557,762 |
| Mode M9 | |||
|---|---|---|---|
| Quadrant | BADHDUFLAG | Total packets | Discarded packets |
| A | 0 | 8 | 0 |
| B | 0 | 8 | 0 |
| C | 0 | 8 | 0 |
| D | 0 | 8 | 0 |
| Mode SS | |||
|---|---|---|---|
| Quadrant | BADHDUFLAG | Total packets | Discarded packets |
| A | 0 | 154 | 0 |
| B | 0 | 154 | 0 |
| C | 0 | 154 | 0 |
| D | 0 | 154 | 0 |
| Mode M0 | |||
|---|---|---|---|
| Quadrant | BADHDUFLAG | Total packets | Discarded packets |
| A | 0 | 16242 | 3 |
| B | 0 | 16907 | 2 |
| C | 0 | 15779 | 2 |
| D | 0 | 21755 | 2 |
| Quadrant | Total seconds | Saturated seconds | Saturation percentage |
|---|---|---|---|
| A | 7583 | 88 | 1.160491% |
| B | 7583 | 187 | 2.466042% |
| C | 7583 | 110 | 1.450613% |
| D | 7583 | 570 | 7.516814% |
Noise dominated data is calculated using 1-second bins in cleaned event files. If a bin has >2000 counts, and if more than 50% of those come from <1% of pixels, then it is considered to be noise-dominated and hence unusable.
| Quadrant | # 1 sec bins | Bins with >0 counts | Bins with >2000 counts | High rate bins dominated by noise | Noise dominated (total time) | Noise dominated (detector-on time) | Marked lightcurve |
|---|---|---|---|---|---|---|---|
| A | 8364 | 7586 | 11 | 11 | 0.13% | 0.15% | 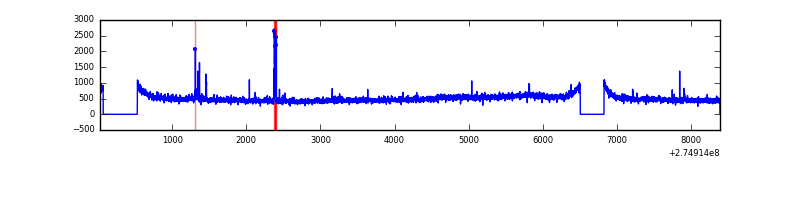 |
| B | 8364 | 7586 | 37 | 37 | 0.44% | 0.49% | 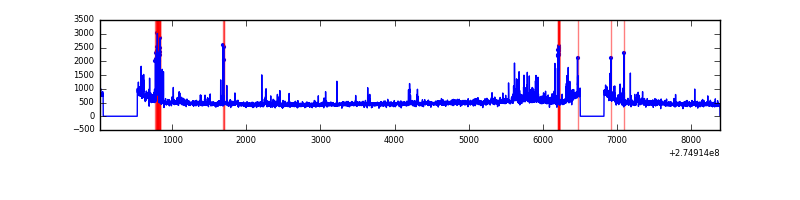 |
| C | 8364 | 7586 | 1 | 1 | 0.01% | 0.01% | 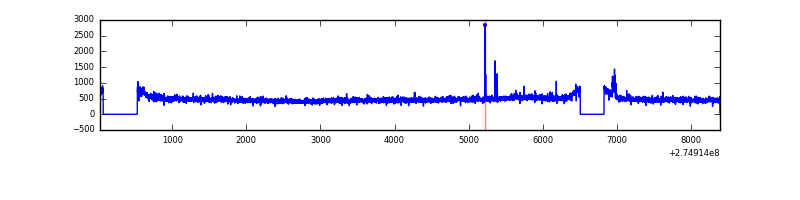 |
| D | 8364 | 7586 | 477 | 477 | 5.70% | 6.29% | 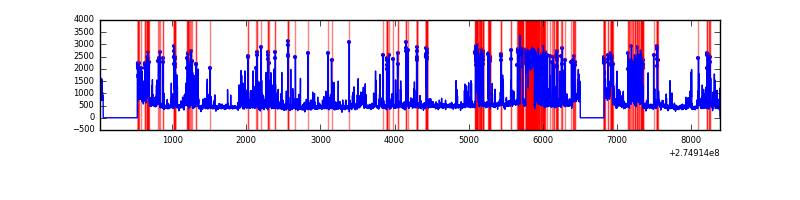 |
Top three noisy pixels from each quadrant. If the there are fewer than three noisy pixels in the level2.evt file, extra rows are filled as -1
| Pixel properties | Quadrant properties | ||||||
|---|---|---|---|---|---|---|---|
| Quadrant | DetID | PixID | Counts | Sigma | Mean | Median | Sigma |
| A | 3 | 80 | 251845 | 1362.99 | 909 | 889 | 184.1 |
| A | 15 | 174 | 49078 | 261.72 | 909 | 889 | 184.1 |
| A | 15 | 239 | 24259 | 126.93 | 909 | 889 | 184.1 |
| B | 7 | 220 | 180575 | 1023.45 | 911 | 889 | 175.6 |
| B | 0 | 189 | 57589 | 322.95 | 911 | 889 | 175.6 |
| B | 0 | 190 | 32885 | 182.24 | 911 | 889 | 175.6 |
| C | 14 | 238 | 132984 | 631.2 | 879 | 885 | 209.3 |
| C | 0 | 207 | 44656 | 209.15 | 879 | 885 | 209.3 |
| C | 3 | 233 | 32908 | 153.01 | 879 | 885 | 209.3 |
| D | 1 | 52 | 1771298 | 8349.1 | 862 | 837 | 212.1 |
| D | 13 | 232 | 256897 | 1207.52 | 862 | 837 | 212.1 |
| D | 12 | 218 | 230259 | 1081.9 | 862 | 837 | 212.1 |
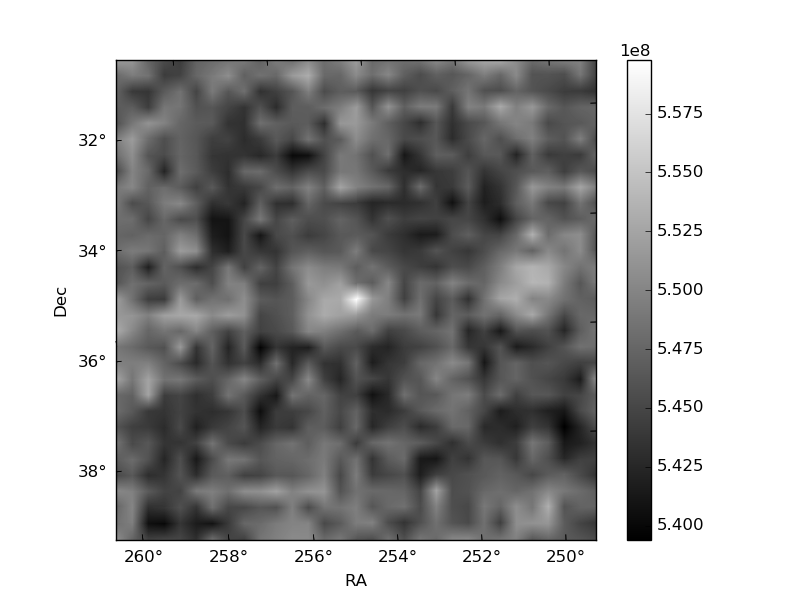
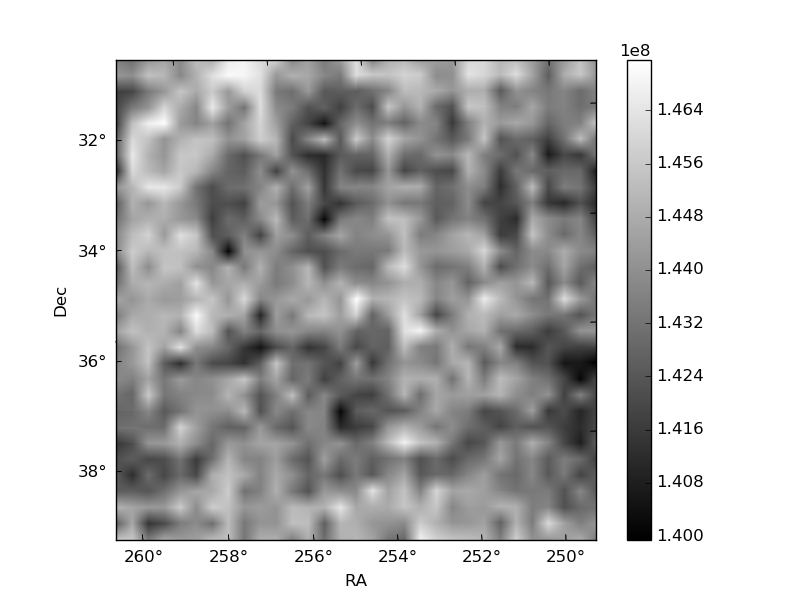
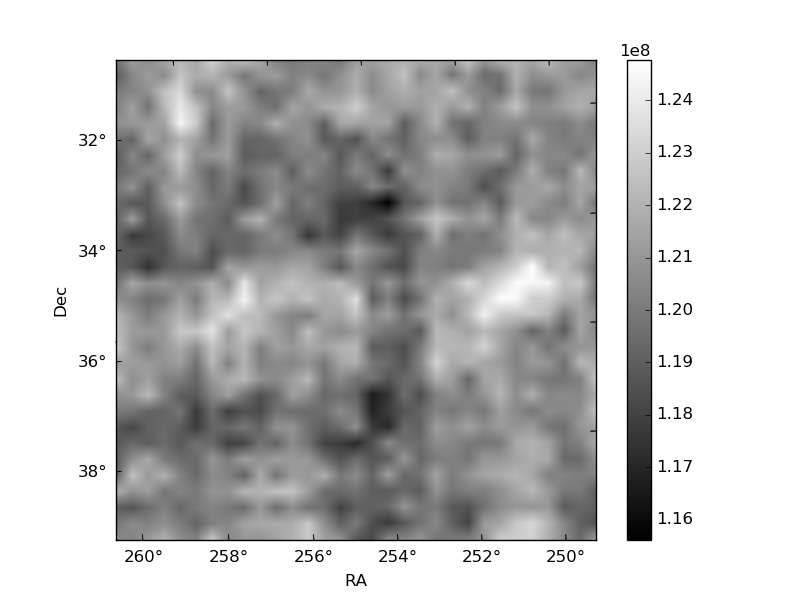
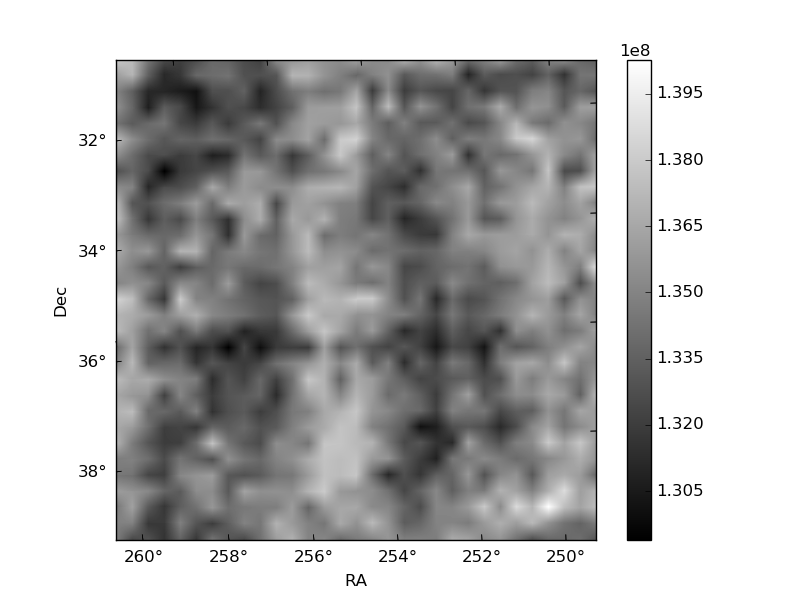
Histogram calculated using DETX and DETY for each event in the final _common_clean file
| Quadrant A |  |
 |
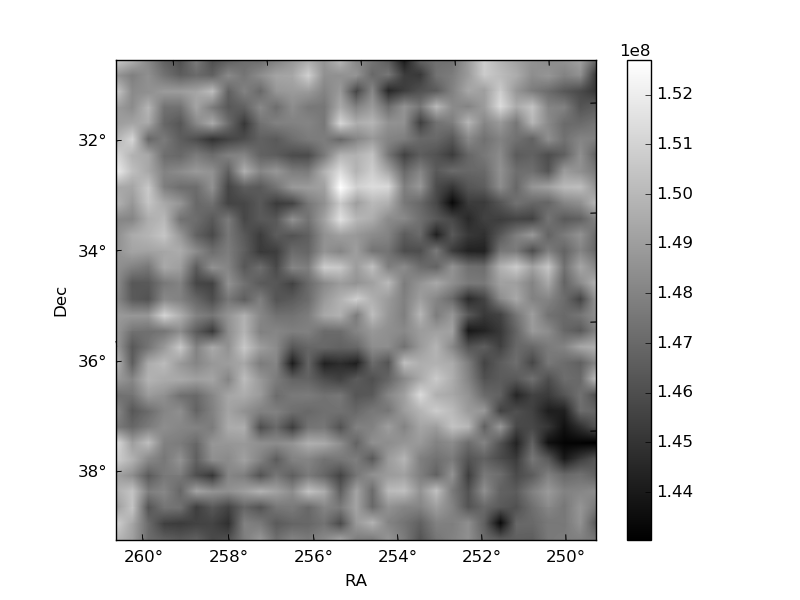
Quadrant B |
|---|---|---|---|
| Quadrant D |  |
 |
Quadrant C |
| Plot type | Count rate plots | Images |
|---|---|---|
| Comparison with Poisson distribution Blue bars denote a histogram of data divided into 1 sec bins. Red curve is a Poisson curve with rate = median count rate of data. |
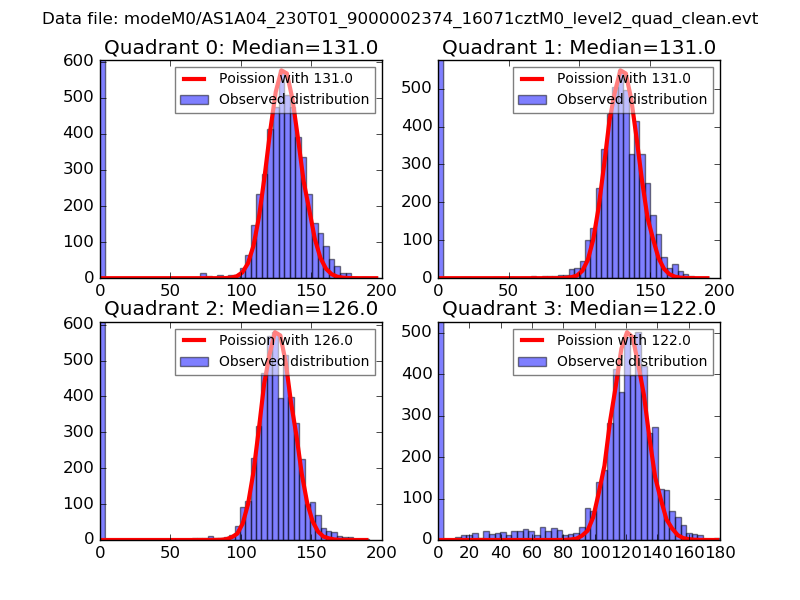 |
 |
| Quadrant-wise count rates Data is divided into 100 sec bins |
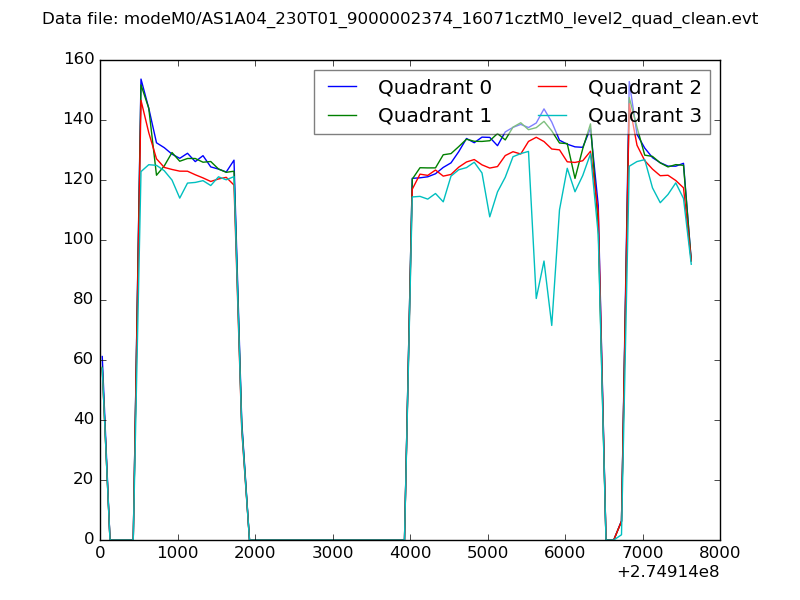 |
|
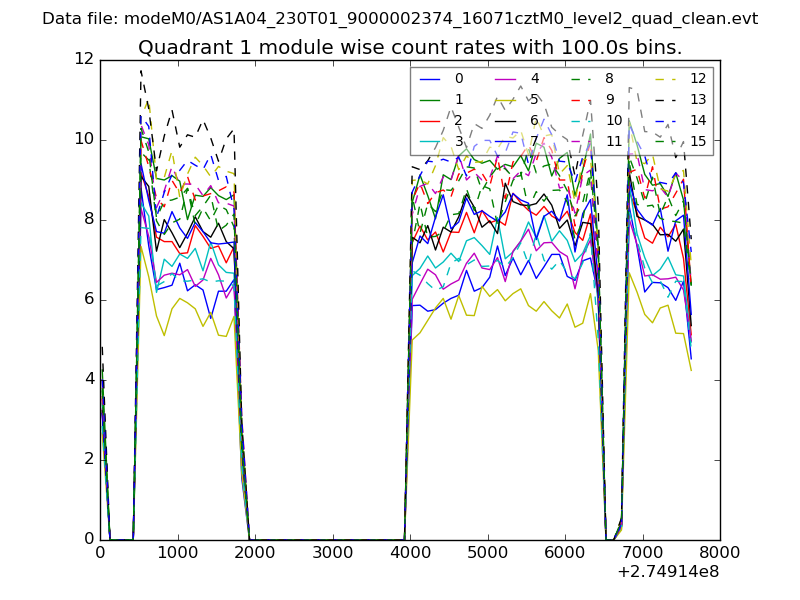
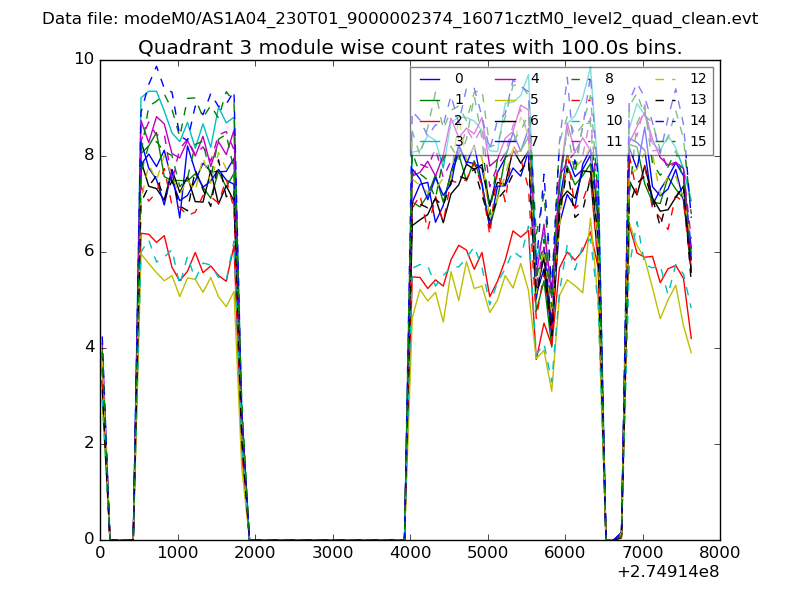
| Module-wise count rates for Quadrant A Data is divided into 100 sec bins |
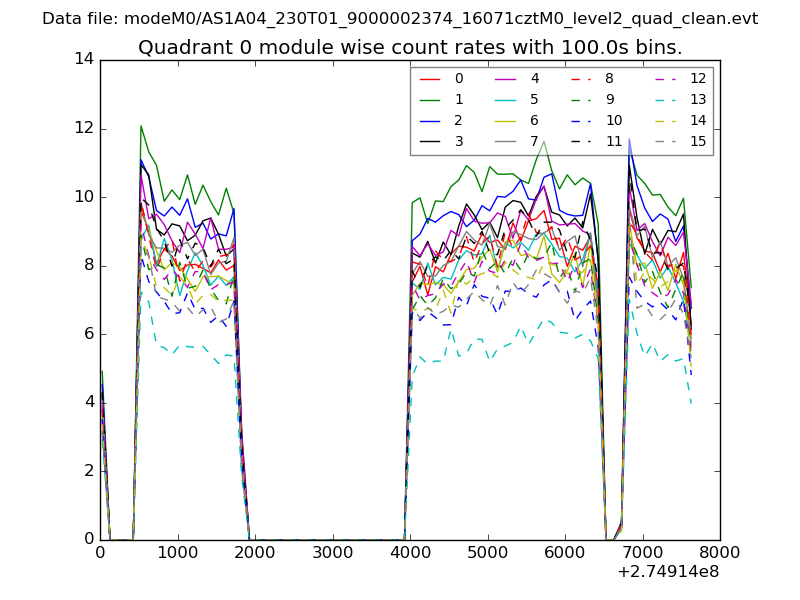 |
 |
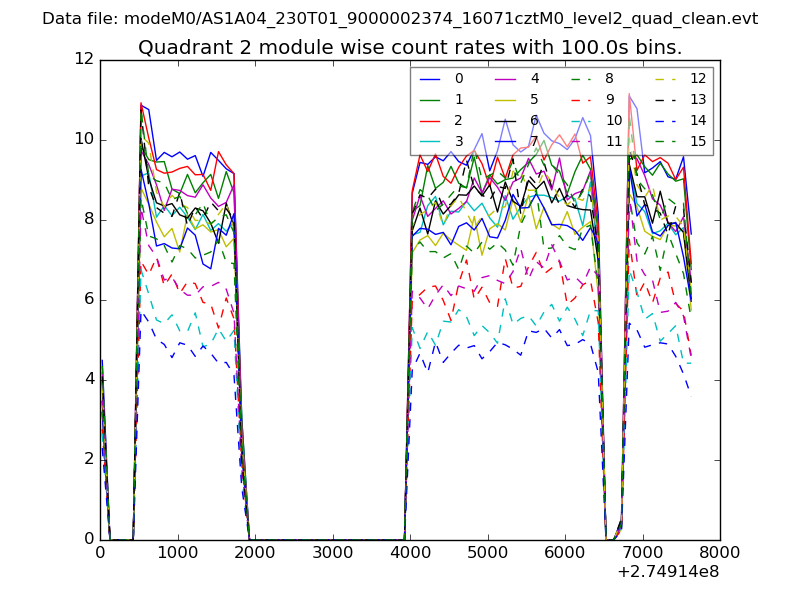
| Module-wise count rates for Quadrant B Data is divided into 100 sec bins |
 |
 |
| Module-wise count rates for Quadrant C Data is divided into 100 sec bins |
 |
 |
| Module-wise count rates for Quadrant D Data is divided into 100 sec bins |
 |
 |
| Parameter | Plot |
|---|---|
| CZT HV Monitor | 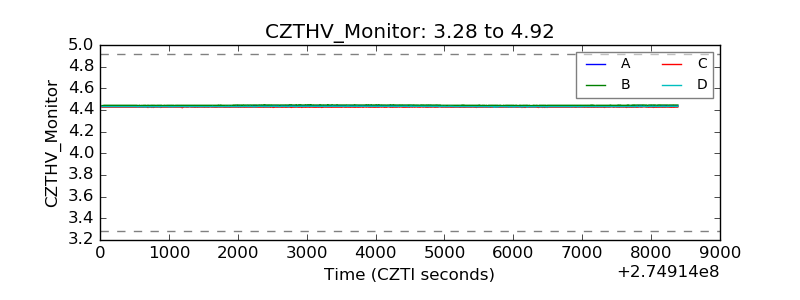 |
| D_VDD | 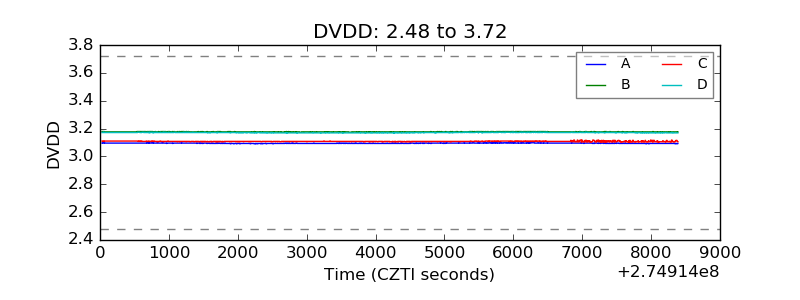 |
| Temperature 1 | 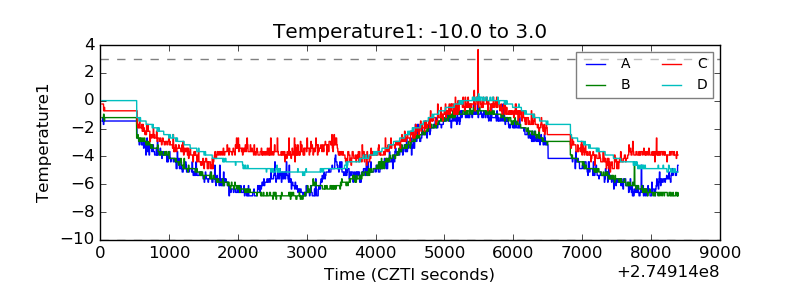 |
| Veto HV Monitor | 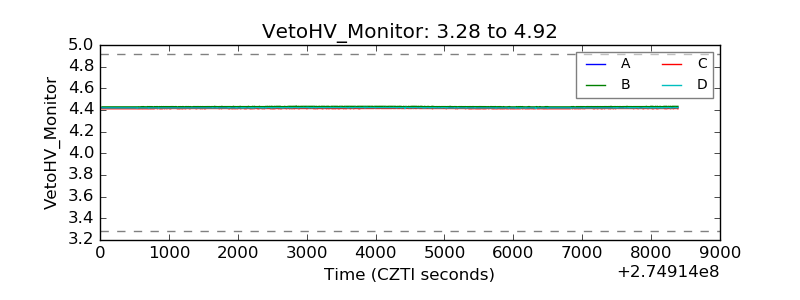 |
| Veto LLD | 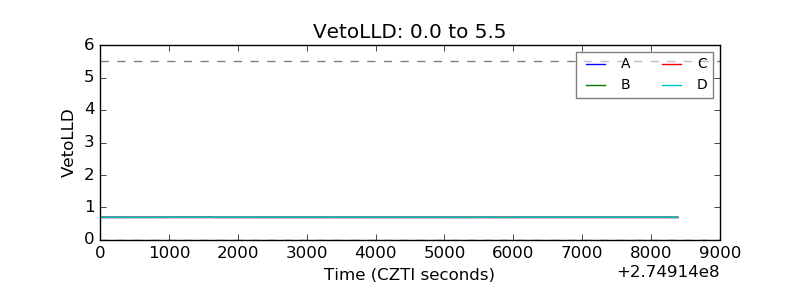 |
| Alpha Counter | 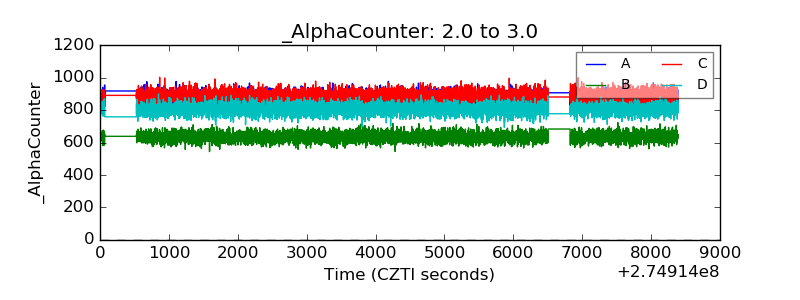 |
| _CPM_Rate | 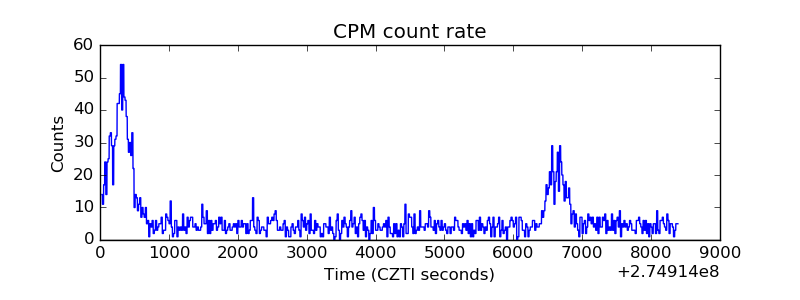 |
| CZT Counter | 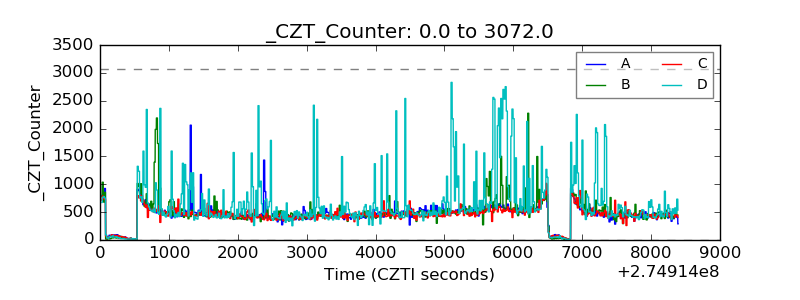 |
| +2.5 Volts monitor | 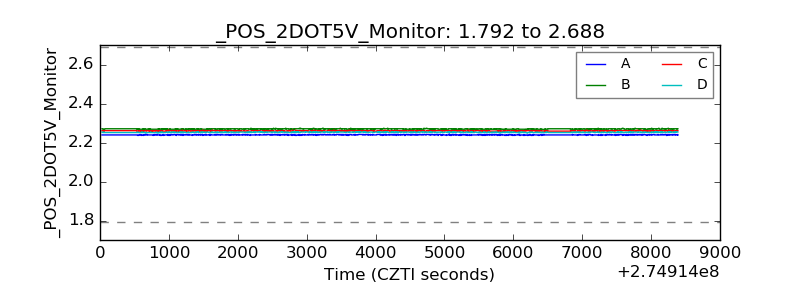 |
| +5 Volts monitor |  |
| _ROLL_ROT | 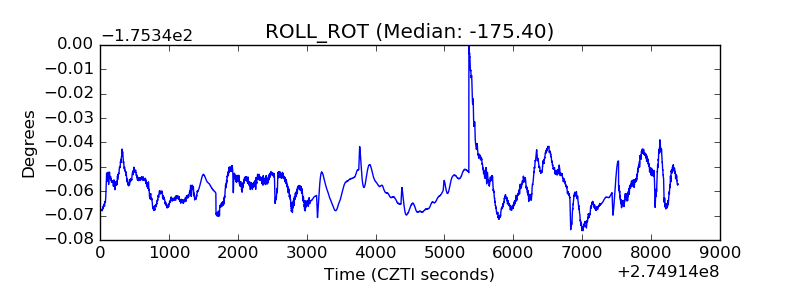 |
| _Roll_DEC | 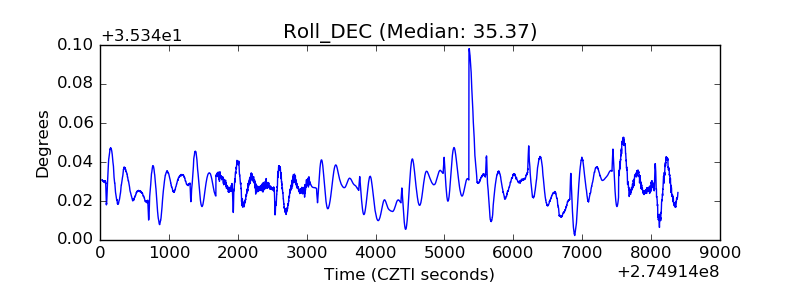 |
| _Roll_RA |  |
| Veto Counter | 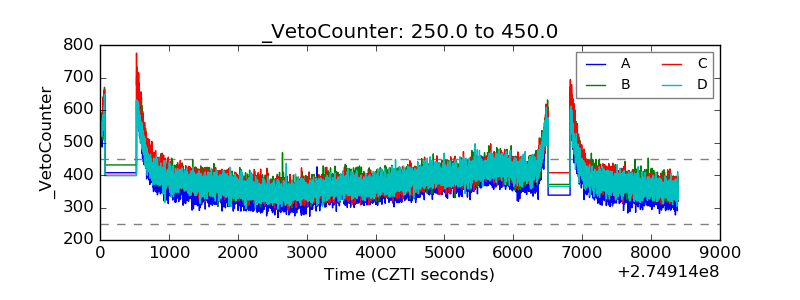 |